Wednesday, May 27, 2020

North Slope Meltout

Spring has arrived in earnest on the North Slope in the past week, and the NWS noted today that breakup is underway:

209 PM AKDT WED MAY 27 2020

...BREAK-UP UNDER WAY ACROSS THE NORTH SLOPE...

WARM TEMPERATURES IN THE BROOKS RANGE ARE CAUSING RAPID SNOW MELT
THAT WILL CONTINUE THROUGH THIS WEEKEND. RIVERS DRAINING TO THE NORTH
SUCH AS THE COLVILLE, KUPARUK AND SAGAVANIRKTOK RIVERS ALL HAVE 
ICE REMAINING NEAR THE COAST, AND COULD HAVE ICE JAM ISSUES THIS 
WEEK AND WEEKEND AS RISING WATER LEVELS MOVE DOWNSTREAM. 

RIVERS NEAR THE ARCTIC COAST SHOULD BE MONITORED CLOSELY FOR ICE 
JAMS AND POTENTIAL FLOODING THROUGH THIS WEEKEND.


Here's the latest NWS breakup map (click to enlarge).


The average date for breakup at the Colville River delta is June 3, based on reports since 1996, so this year will not be far from normal.  The historical chart - see below - suggests a trend towards later breakup, but this is entirely because of two early years at the beginning of the series.  The long-term trend in temperature during May is most decidedly up.


Here are a couple of satellite images that illustrate the extent of snow cover remaining; the first image below is from Monday afternoon, and the second image is from today (click to enlarge).  Patchy cloud cover obscures the situation slightly, but there's no doubt the snow is disappearing.


[Update Friday pm: here's a great view from today, courtesy of and annotated by Rick Thoman.]


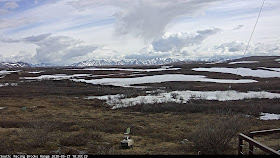
The Umiat webcams confirm that snow is gone on the middle Colville River (289' elevation), and even up at Toolik Lake (2460') there's a lot of bare ground now.  Both of these sites have exceeded 60°F already; summer's here.


Wednesday, May 20, 2020

Fire Season Speculation

News of a small wildfire that started north of Wasilla on Saturday brought a reminder that Alaska's fire season is imminent, and recent dry conditions have created high fire risk.  According to akfireinfo.com,

"With no significant precipitation since the snow pack melted off a month ago and greenup still in process, conditions in the Mat-Su Valley are extremely dry and the wildfire danger is very high. A burn permit suspension has been in effect since May 1 prohibiting the use of burn barrels and debris burning for the Mat-Su area and the rest of the state with the exception of Southeast Alaska."

The fire risk seems ironic after such wet weather in late winter and early spring, but it doesn't take very long to dry things out with long hours of sunshine and low humidity.  Check out how suddenly the deluge was shut off at the CRN site near Fairbanks:


Are there any indications of what the fire season might hold for Alaska?  As of May 1, the NIFC fire potential outlook suggested no reason to expect anything other than "normal" fire conditions this summer, although they indicated that the start of fire season might be later than normal because of the healthy snowpack.

A couple of years ago (see here) I noted a modest connection between fire season acreage and May ocean/atmosphere conditions across the North Pacific and Alaska; of course a warm, dry May tends to set up an active season.  It was also interesting to see that significant El Niño episodes tend to occur after active fire years, so if El Niño is showing signs of developing during summer, then enhanced fire activity might be expected.

Last year my exploration continued with a closer look at May North Pacific SSTs, and rather remarkably it turns out that all of the very active fire seasons in recent decades have occurred in tandem with a positive North Pacific Mode (NPM), indicating unusual ocean warmth to the south of Alaska.

The chart below illustrates the connection between Alaska fire acreage in the last 30 years and the May NPM index and August ONI (Oceanic Niño Index); both of these "predictors" are significantly positively correlated with statewide fire acreage.  The top 10 fire years all had a positive NPM phase, but we should note that a positive NPM doesn't quite guarantee an active fire year; 2014 was the major exception, with an extremely warm North Pacific but less than a quarter of a million acres of fire in Alaska.


If we create a standardized index from the May NPM and August ONI, the scatter plot shows a remarkable absence of bad fire years when the index is negative; but again a positive index is not quite a guarantee of a busy year.


So what can we deduce for 2020?  Well, we're certainly don't seem to be heading for El Niño, and in fact it's quite the reverse, with a cooling trend developing recently and expected to continue in the equatorial Pacific.  La Niña appears to be considerably more likely than El Niño in the latter part of the year, but it's also quite possible that near-neutral conditions will persist.

As for the North Pacific, it's warm.  Here's the last month's SST anomaly map:


Consequently the North Pacific Mode is positive, although not nearly as positive as it was last summer and autumn.


So far this month we've seen above-normal 500mb heights over most of Alaska, and as mentioned earlier it's been dry.


All in all, then, it seems there are mixed messages.  The trend towards La Niña is perhaps hinting at a relatively low fire year, but on the other hand the North Pacific is unusually warm, and Alaska has been dry and warm in recent weeks.  Perhaps the main conclusion is that there's no strong signal in either direction; a very active fire year would be a surprise, I think, given the tropical cooling; but a very quiet year would perhaps also be unexpected, given the North Pacific warmth.  So I'll go for near-normal, i.e. between about 0.3 and 1.0 million acres.  We'll find out soon enough.

Tuesday, May 12, 2020

Spring Floods

Summer-like warmth has suddenly arrived in interior Alaska, and with plenty of snow still in place across the higher hills, creeks and rivers are in flood.  Fairbanks recorded 82°F on Sunday and 80°F yesterday; this is only the second time in the modern climate record (1930-present) that more than one day has reached 80°F before May 20.  The other time was the ridiculous early heat wave of 1995 (88°F on May 11).

Looking at the SNOTEL snowpack data up on Munson Ridge (east of Fairbanks at 3100' elevation), there's a long way to go to eliminate the very substantial snowpack: more than 12" of liquid equivalent water remains at this time.  The massive snowpack accumulation in late winter really was remarkable: as the chart below demonstrates, the snowpack went from being only modestly above normal in mid-March to nearly twice the normal amount just one month later.  It didn't reach the excess of 2018, which I reported on here, but it's an impressive snowpack nonetheless (click to enlarge).


I've commented before on the fact that above-normal snowpack has become the norm in recent years - where "normal" is defined as the 1981-2010 median.  The winter before last (2018-19) turned out to be the first below-normal snowpack in the Chena Basin since 2009-10, although it was barely below normal on April 1.


So with this winter now in the books, it's been 10 consecutive winters without a seriously deficient snowpack in this part of Alaska.  But of course the same is not true elsewhere; the Kenai peninsula had a dry winter this year, and my impression (although I haven't examined the data) is that the low-snow theme has been as dominant there as the excess snow near Fairbanks.  Here's the April 1 snowpack map from NRCS:


And here are the SNOTEL sites that contributed to the above basin-wide analysis:


Thursday, May 7, 2020

Seasonal Forecast

Regular readers will know that I have strong personal and professional interests in long-range forecasting, including both sub-seasonal (weeks ahead) and seasonal (months ahead) outlooks.  It's a challenging discipline, of course, but seasonal forecasting in particular is a mature field with well-established methods and tools that (can) lead to a modest degree of success.

Among the tools that are regularly consulted by seasonal forecasters are both dynamical model forecasts produced by well-funded supercomputing centers and statistical forecasts from any and all sources.  An attractive aspect of statistical techniques is that they can be simple enough to run on a desktop computer in minutes; there's no barrier to entry in this field.

In the past week I've been digging into a new approach reported by Matti Kämäräinen of the Finnish Meteorological Institute:

https://journals.ametsoc.org/doi/abs/10.1175/JCLI-D-18-0765.1

I won't reproduce details, but the essence of the scheme is that it develops a large ensemble of regression models over a long 70-year history to predict surface temperature in 3-month periods.  The predictors are simple: global sea surface temperature and 150mb (lower stratosphere) geopotential height patterns in previous 3-month periods.

Kämäräinen and his co-authors report significant skill in predicting area-average temperature over large domains such as Scandinavia and western Europe.  I managed to reproduce most of the results with my own code and then apply the scheme to a domain over Alaska and western Canada.  The model produces forecasts for the area-average temperature in terms of departure from trend, and the chart below shows results for the entire verification period, 1986-present (click to enlarge).


Here's the forecast domain: note that we're predicting area-average temperature for the whole region, not for any particular point.


The overall correlation is modest but unquestionably positive.  Here are the correlation coefficients for the last 20 years of 3-month forecasts, i.e. 80 consecutive seasonal forecasts for 2000-2019:

Dec-Feb  +0.66
March-May  +0.35
June-Aug   +0.58
Sep-Nov   +0.36

Bearing in mind that this is strictly out-of-sample verification (i.e. we're not cheating), and that the long-term trend was removed (i.e. the trend does not boost the skill), this is quite impressive in my view.

So what does the scheme predict for this summer?  The last data point on the chart shows the forecast for June-August 2020, and it's a cool look; in fact, the regression predicts the lowest trend-relative temperature for summer since 2009.  The cool forecast doesn't look like much on the chart, because variance is low in summer, but it's a big change from last year's forecast, which was (correctly) quite warm.

Given that the latest dynamical model forecasts are pointing warm, and NOAA's Climate Prediction Center also shows warm, it will be interesting to see how the summer turns out.  Of course, a true comparison of these forecasts would require us to reconcile the different climate reference points, because "below trend" could easily be "above normal" if we're talking about the 1981-2010 baseline that CPC currently uses.  I'll leave that detail for another day.