Saturday, December 28, 2019

More on Cold

A couple of items of quick follow-up are warranted regarding the holiday-season cold snap of 2019.  First, here's a summary of low temperatures from the NWS:

PUBLIC INFORMATION STATEMENT...CORRECTED
NATIONAL WEATHER SERVICE FAIRBANKS AK
438 PM AKST SAT DEC 28 2019

...NORTHERN ALASKA COLD SPELL LOW TEMPERATURE REPORTS...

BELOW IS A SUMMARY OF MINIMUM LOW TEMPERATURE OBSERVATIONS DURING
THE RECENT COLD SNAP ACROSS NORTHERN ALASKA. THE -60 F AT BETTLES,
IF ACCEPTED BY THE NOAA NATIONAL CENTERS FOR ENVIRONMENTAL INFORMATION,
WOULD TIE THE ALL-TIME DECEMBER RECORD LOW SET IN DECEMBER 15, 1946. 

OBSERVATIONS ARE COLLECTED FROM A VARIETY OF SOURCES WITH VARYING
EQUIPMENT AND EXPOSURES. DATA IS CONSIDERED PRELIMINARY UNLESS
NOTED AS OFFICIAL. WE THANK ALL VOLUNTEER WEATHER OBSERVERS 
FOR THEIR DEDICATION.


LOCATION                     TEMP       LAT/LON            TIME/DATE 

MANLEY HOT SPRINGS 15 MI NE  -65 F      65.14N/150.22W     0800 AM 12/28 (OFFICIAL)      
ALLAKAKET (FAA-ALASKA)       -60 F      66.55N/152.63W     1220 PM 12/28
BETTLES                      -60 F      66.92N/151.52W     0153 AM 12/28       
CHALKYITSIK RAWS             -57 F      66.60N/144.35W     0120 AM 12/28  
NOWITNA RIVER                -57 F      64.50N/154.13W     1205 AM 12/28  
ARCTIC VILLAGE               -57 F      68.12N/145.57W     0956 AM 12/27  
FORT YUKON                   -56 F      66.57N/145.27W     0803 PM 12/27    
TELIDA RAWS                  -56 F      63.43N/153.35W     0953 AM 12/27      
NORUTAK LAKE RAWS            -55 F      66.83N/154.32W     0721 AM 12/28  
TANANA                       -55 F      65.17N/152.10W     1152 AM 12/27 (OFFICIAL) 
MANLEY HOT SPRINGS DOT CAMP  -54 F      65.01N/150.61W     1000 PM 12/27       
COLDFOOT (FAA-ALASKA)        -52 F      67.26N/150.19W     1040 AM 12/27  
HUSLIA                       -52 F      65.70N/156.35W     0656 AM 12/27  
WISEMAN NWS COOP             -52 F      67.42N/150.11W     0700 AM 12/27 (OFFICIAL)      
NIKOLAI                      -51 F      63.02N/154.35W     0655 AM 12/27  
KALTAG                       -49 F      64.33N/158.75W     0553 AM 12/28 (OFFICIAL)
MCKINLEY RIVER RAWS          -50 F      63.65N/151.64W     1050 AM 12/27  
GALENA                       -49 F      64.73N/156.93W     0756 AM 12/27
SEVEN MILE RAWS              -49 F      65.94N/149.85W     0219 AM 12/28     
CLEAR SKY LODGE NWS COOP     -46 F      64.25N/149.18W     0806 PM 12/27 (OFFICIAL)
UMIAT AIRFIELD RAWS          -46 F      69.37N/152.14W     1023 AM 12/28  
SHUNGNAK                     -45 F      66.88N/157.17W     1117 AM 12/28  
SALCHA RAWS                  -45 F      64.59N/146.15W     0852 PM 12/27  
UAF TOOLIK FIELD STATION     -45 F      68.63N/149.60W     1100 AM 12/28  
AMBLER                       -44 F      67.10N/157.85W     0456 AM 12/28
EIELSON AFB                  -44 F      64.67N/147.10W     0857 PM 12/27 (OFFICIAL)  
FORT WAINWRIGHT              -44 F      64.83N/147.62W     1013 PM 12/27 (OFFICIAL)
NENANA                       -44 F      64.55N/149.08W     0922 PM 12/27 (OFFICIAL)      
NUIQSUT                      -44 F      70.22N/151.00W     0353 PM 12/28 (OFFICIAL)             
MCGRATH                      -43 F      62.97N/155.62W     1213 PM 12/26 (OFFICIAL)      
BUCKLAND                     -42 F      65.98N/161.15W     0811 PM 12/27  
MINCHUMINA                   -42 F      63.90N/152.32W     0256 AM 12/27  
DEADHORSE                    -41 F      70.20N/148.47W     0253 AM 12/28 (OFFICIAL)     
GOLDSTREAM CREEK NWS COOP    -41 F      64.89N/147.88W     0954 PM 12/27 (OFFICIAL)          
FAIRBANKS AIRPORT            -40 F      64.80N/147.85W     0553 PM 12/27 (OFFICIAL)  

The "preliminary" label attached to the observations has some significance in this case, because there's serious doubt concerning the -60°F at Bettles.  The problem is that the ASOS thermometer reported a minimum of -57°F, but the climate observation was manually adjusted down to -60°F.  Here's the proof... the original midnight (actually 23:53 AKST) METAR was available by 23:55 as follows (I've highlighted the 24-hour minimum, -49.4°C or -57°F):

METAR PABT 280853Z 00000KT 10SM CLR M48/ A2983 RMK AO2 SLP148 T1483 414831494 58022

Then two minutes later another 23:53 METAR became available with a manual correction:

METAR PABT 280853Z COR 00000KT 10SM CLR M48/ A2983 RMK AO2 SLP148 T1483 414831511 58022

The ASOS instruments did not measure a temperature below -57°F; this was a manual correction by the FAA observer based on some other information.  NOAA/NCEI may decide to throw out the correction; it's obviously a small difference, but it has some significance in view of the potential for a new December cold record at the site.

On another note, with changing pressure patterns across the state, extreme cold in certain areas has given way to extreme wind chills in others.  For instance, Deadhorse this morning reported a temperature of -38°F with a 21 mph sustained wind, equating to a wind chill of -72°F.  Perhaps surprisingly, more than half of winters in Deadhorse do not see a wind chill this low; and only once in recent decades has the wind chill dropped below -80°F (January 23, 2012).  The record low wind chill prior to the New Year in Deadhorse is -75°F.

Conditions have been nasty in western and southwestern Alaska, too.  Bethel reported -18°F with 28 mph winds yesterday afternoon, for a wind chill of -49°F.  Again, this is very unusual for this early in the winter; in the ASOS era (1998-present), the record low wind chill for December is -56°F.

Here's the 3am surface/MSLP analysis from Environment Canada (click to enlarge).


Finally, it was interesting to see temperatures jump up in the coldest parts of the interior last night as winds broke through the inversion and mixed down warmer air.  Here's an example from the Chalkyitsik RAWS near Fort Yukon.


Friday, December 27, 2019

Cold Returns to Alaska

A fresh wave of Arctic cold has sunk south across Alaska in the past couple of days, and surface temperatures have plummeted in areas where skies have cleared.  Sub-minus 50°F was observed today in a wide range of locations from the Kuskokwim valley upstream of McGrath, northward to the Koyukuk River drainage, and east to the usual cold spots in the northeastern interior.  Fairbanks held off the cold for a while but has dropped to -40° this evening.  Click to enlarge the map below.


The coldest report was from a cooperative observer near Eureka, just northeast of Manley Hot Springs, where the thermometer apparently registered -65°F.  This is the lowest observed temperature in Alaska in nearly 8 years.


Another notable data point came in from the high-quality CRN site in the Nowitna NWR (Ruby 44 ESE); the temperature dropped to -57°F, which is the lowest temperature observed so far by any CRN site in the nation (in any year).  Most of the CRN sites in Alaska were installed in the last 10 years; the Nowitna site didn't start reporting reliably in winter until two years ago, but nevertheless it already held the CRN record with -54°F in January 2018.

Finally, it's worth noting that Bettles has not risen above -55°F since midnight, and if this holds through midnight tonight it will be the coldest December day in Bettles' history (data since 1951).  The last time the daily high temperature was -55°F or below was in January 1993, and it's never happened outside of January (again, since 1951).

Satellite data indicate that the heart of the cold was over the Kanuti Flats south of Bettles; this is certainly one of the coldest parts of the interior (try searching for "Kanuti" on this blog).  Below are a couple of images showing the lowest temperature estimated by the radiometer on the Suomi polar orbiting satellite today; I've marked several of the sites of interest, and the second image is a zoomed-in view with a different color scale.  Note that white indicates missing data.


The lowest estimated temperature in the satellite grid is -64°F on the Kanuti Flats, which seems very plausible in light of the nearby observations.  Allakaket, which is usually colder than Bettles, reported as low as -60°F and hovered around -58°F all day.

On the other hand, the satellite data don't seem particularly supportive of the -65°F near Eureka (MLYA2), although there's no reason to think it's physically implausible.

Here's a simple animation of the webcam view from the Allakaket airport today. It's interesting to see the slight and variable air movements in the half-light of a near-solstice day right on the Arctic Circle.


And for the record, here's yesterday morning's 500mb analysis showing the main culprit for the cold: the intense Arctic vortex north of the Alaska-Canada border.  Based on sounding data from Utqiagvik (850mb temperatures below -32°C), the air mass is the coldest prior to the New Year since 1983.  From a scientific perspective, it's nice to see something different after the pervasive warmth of recent months and years.


Monday, December 23, 2019

Cold and Dry

The past few days have brought a fairly notable cold spell to the eastern and northeastern interior, with the first sub-minus 50°F temperatures of the season emerging at the usual cold spots.  Today is the fifth consecutive day with a daily minimum of -50°F or lower at the Chalkyitsik RAWS site near Fort Yukon, and this appears to be the most since January 2010 for that particular site (although there's a lot of missing data from 2012-2015).

It's been pretty chilly in Fairbanks too, with daily low temperatures below -30°F for three days, and a high temperature of -30°F on Saturday.  Of course solar heating is essentially zero at the winter solstice.  As an aside, here's a link to a very attractive solstice video from the other day.


It has been a little unusual to see cold like this at valley level without colder conditions aloft.  According to the Fairbanks balloon soundings, the 850mb temperature did not drop below zero Fahrenheit; this temperature is colder than normal at 850mb, but not dramatically so - a colder air mass prevails about a quarter of the time in deep winter (per data since 1981).  In contrast, only about 5% of days see a high temperature of -30°F or lower in Fairbanks at this time of year.

This means, of course, that the surface-based temperature inversion has been strong; see Saturday morning's sounding below.  The surface-850mb temperature difference has been about 20°C in recent days, and this is exceeded on only about 7% of days in December and January - and more often than not it happens when conditions are warmer than normal aloft.  Big inversions tend to occur under high pressure, when clear skies and calm winds allow for strong radiational cooling, and at the same time subsidence aloft produces relatively warm, dry air above the inversion.  In contrast, cold air aloft tends to occur in association with a trough, which also typically brings cloudier and less calm conditions that don't promote a strong inversion.


So the unusual aspect of recent days has been the juxtaposition of relatively clear and calm conditions with a cool air mass, allowing surface cold to "outperform" over the northeastern interior.  One important reason for the absence of cloud is that the air aloft has been very dry indeed; the total column water vapor ("precipitable water") dropped to about 1mm late last week, which is down in the extreme lower tail of the historical distribution.  Less than 2% of soundings are this dry in Fairbanks in December and January.  The dryness of the air probably has to do with its origin in the high Arctic, as it seems to have been transported southward on the west side of a persistent and intense "polar vortex" near Canada's Banks Island.  This is illustrated below by the 500mb charts from last Friday morning and this morning respectively, courtesy of Environment Canada:


If we look at the history of precipitable water and surface-850mb inversion strength in Fairbanks, there is an inverse relationship, and this stands out particularly clearly when cold air is in place - see the figure below.  The blue markers show precipitable water versus inversion strength for the lowest 10% of 850mb temperatures in December and January; notice the uniformly low water content when the air is cold both aloft and at the surface (i.e. blue markers and strong inversion).


In conclusion, the combination of very cold and very dry air aloft is a recipe for extreme cold at the surface in Alaska's interior, and the last few days fulfilled the dry aspect of this.  There's a chance the "very cold" part may show up too in the near future; and this would be quite a shock to the system after all the warmth of recent years.   At the very least, the coming weekend looks to bring the coldest weather of the season so far.

Tuesday, December 17, 2019

Bering Ice Loss Modeling

Last week Rick Thoman, the founder of this blog and still occasional contributor, announced the publication of a paper of which he is lead author, entitled, "The Record Low Bering Sea Ice Extent in 2018: Context, Impacts, and an Assessment of the Role of Anthropogenic Climate Change".


The brief paper is well worth a read for those interested in Alaska climate; Rick and co-authors document various aspects of the unusual winter of 2017-2018 in the Bering Sea, with a focus on the extreme lack of sea ice.  As we discussed on this blog at the time (for example, here), late winter Bering Sea ice extent was far below previous records in the modern satellite era, with both pre-existing ocean warmth and extremely persistent southerly flow contributing to the anomaly.

The most striking conclusion of the paper arises from an analysis of climate model output, which indicates that the very low ice level of two winters ago "will likely by typical by the 2040s", i.e. barely more than 20 years from now.  This result is obtained by applying a bias correction to the climate model's ice predictions over the satellite era, and then finding the frequency with which the 2018 ice shortfall is surpassed in the model forecasts for future decades.  It should be noted that the model simulations use the RCP8.5 climate forcing, which is a high-emissions scenario that some suggest is unlikely to occur, although of course this is just one aspect of the uncertainty (see the following article for discussion of RCP8.5: https://www.carbonbrief.org/explainer-the-high-emissions-rcp8-5-global-warming-scenario).

One point that is dealt with briefly in the paper, but may be worthy of further consideration, is the apparent discrepancy in Bering Sea ice trends between the climate model and the real world.  Despite the drastic drop-off in ice extent in 2018 and 2019, the 41-year downward trend is not yet statistically significant, and in fact prior to 2018 the trend was upward; it was even statistically significant in the upward direction for a while (e.g. 1979-2013).  See the figure below for the observed January-April ice extent.  According to the paper, most of the model's simulations (35 members of a 40-member ensemble) have 1980-2018 declining trends that are greater than what has really happened.


Does this mean that the model is not realistic?  Not at all.  As Thoman and co-authors explain, the variability of Bering Sea ice on time scales of a few years ("subdecadal-scale") is essentially random, and this means that the observed 41-year trend is only one of a wide range of trends that could have occurred.  In other words, the real world is only one of an infinite number of possible realizations based on the same physics, and the climate model suggests that the actual Bering Sea trend - with its lack of decline until recently - happens to have been an unlikely one.  Obviously it's very important to verify that the model is in fact simulating sea ice properly, and the paper cites other studies showing that this is the case.  And of course it goes without saying that sea ice loss in the Arctic as a whole has been extremely statistically significant, unlike the relatively small Bering Sea basin.


All in all - congratulations to Rick on the publication - this is good work.

Tuesday, December 10, 2019

Chukchi Beach

It's been a dramatic turnaround for temperatures in Alaska over the past few days, as the brief seasonal chill was quickly replaced by highly unusual warmth once again over much of the state.  Deep southerly flow has pushed warm air all the way up into the Arctic, and temperatures have been widely above freezing in western and southern parts of Alaska since yesterday.

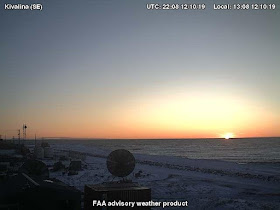
As an illustration of the unusual conditions, the village of Kivalina on the Chukchi Sea coast has been above freezing (up to 39°F) with a strong offshore breeze since yesterday, and the FAA webcam shows open water along the coast.  It's striking to see the afternoon sun poke just slightly above a horizon of open water; tomorrow's sunset will be the last of the year in Kivalina.  For reference, the 1981-2010 climate normal points to a typical daily mean temperature of +5°F on this date.

Here's a view of sunrise today in Kivalina at about 1pm local time:


And here's a simple animation of the beach scene.


Thursday, December 5, 2019

Cold Spell

It won't last long, but interior Alaska is seeing conditions worthy of early winter today, with temperatures dropping below -30°F in the usual cold spots and below -40° in some locations.  Chicken dropped to -44°F this morning, and the Chalkyitsik RAWS reached -45°F.  Fort Yukon hovered near -40° all day, and Tanana and Eagle both reached -36°F.  Here's a map of minimum temperatures from midnight through mid-afternoon (click to enlarge):


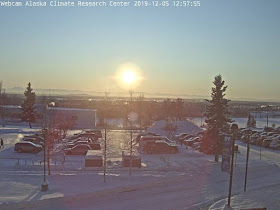
Here's the view from UAF at close to solar noon, with a mere 3° of solar elevation above the horizon.


Up in Fort Yukon, polar night is now only a little more than 100 miles to the north, and this was today's view during the sun's brief traverse of the southern sky:


Clear skies and calm winds are the main ingredients for this kind of "normal" cold spell; the 3am surface analysis shows a modest anticyclone over northern Alaska.


The air mass aloft is chilly, but not especially cold; for example, the 850mb temperature over Fairbanks was just below -20°C this morning.  Based on 1981-2010 data, temperatures this low or lower are typically observed over Fairbanks about 15% of the time in December and 20% of the time in January; but in the past 10 years it's been more like 10% and 15% respectively.  Real cold tends to show up when 850mb temperatures get closer to -30°C, and that's a rather rare occurrence these days.

Here's the 6-10 day forecast from CPC; enjoy the cold, if you can, while you can.


Friday, November 29, 2019

ERA5 Winter Precipitation Type

In light of recent posts on winter rain in Bethel and elsewhere, I thought it would be worthwhile to see what the new ERA5 reanalysis data has to say about winter precipitation type in Alaska.  I've mentioned the ERA5 data on previous occasions, for example here:

https://ak-wx.blogspot.com/2019/05/era5-data-for-alaska-including-download.html

The ERA5 dataset includes a precipitation type indicator, which makes it a simple task to assess the frequency of each category across the 0.25-degree latitude/longitude grid.  The six categories are: Snow, Wet Snow, Rain/Snow Mix, Rain, Freezing Rain, and Ice Pellets; the determination is based on the modeled surface temperature and the temperature profile aloft.  Here is some more information on the model algorithm:

https://confluence.ecmwf.int/display/FUG/Types+of+Precipitation

Based on the hourly ERA5 data for 40 winters since 1979-1980, I simply added up the number of occurrences of each category of precipitation type for the months of November through March.  Below are maps for the four simple categories, i.e. snow, rain, and in-between.  Note that a precipitation type is assigned whenever the model has a non-zero precipitation rate, no matter how small; so for example the model indicates snow falling more than 90% of the time over the Arctic waters, but rates would be extremely low much of the time.  Click to enlarge the maps.


Here are the two other categories, freezing rain and ice pellets, with a different scale to reveal areas of low frequency.  For reference, a frequency of 1% corresponds to 36 hours per winter.


And here are the rain, rain/snow mix, and "wet snow" maps on the same "zoomed in" color scale:


It's interesting to see relatively high frequencies extending around the north side of the Alaska Range to the middle Tanana River valley (e.g. Nenana and Fairbanks); the spatial distribution looks realistic to me, although the absolute values of the frequencies might be biased high or low (more on that in another post).

Finally, here's the sum of frequencies for everything other than dry snow.  I'd be interested to hear readers' perceptions of these results - feel free to leave a comment below.


Monday, November 25, 2019

Chukchi Partial Freeze-Up

Arctic waters in the Chukchi Sea, northwest of Alaska, have finally begun to succumb to the seasonal chill, with Chukchi sea ice extent approximately tripling in just the last 10 days, according to NSIDC daily data.  As of Saturday the basin-wide extent is no longer the lowest on record for the date, as 2019 is now slightly ahead of 2017.  However, with a powerful storm currently moving up the west side of the Bering Sea, and strong southerly winds pushing up into the Arctic ahead of the storm, the situation looks tenuous.


The two maps below show the sea ice analyses from two weeks ago and from today, courtesy of the NWS.  Interestingly the Bering Sea is doing a bit better than in recent years (with some ice along the Alaskan west coast), although it is still behind the 1981-2010 median for the date.  And of course essentially the entire open area to the north of the Bering Strait is anomalous in comparison to that earlier climate normal.


Tuesday, November 19, 2019

Winter Rain History

After a nasty ice storm a couple of weeks ago, Bethel experienced blizzard conditions today, with temperatures below 10°F and 40+mph wind gusts combined with heavy snow this morning.  However, as the warm front approached this afternoon, warm air aloft caused the snow to change over to a brief period of freezing rain again before precipitation ended.

The (nominally) 3pm balloon sounding from Bethel shows the dramatic temperature gradient just above the surface.


At the time the balloon was launched (2pm), the surface air temperature was 16°F, but freezing rain was already occurring as there was enough warm air upstream to melt falling snow; the sounding profile shows the temperature just nudging above freezing at 400m above sea level.  Notice the veering (clockwise directional change) of the wind with height, indicative of the rapid approach of warm air.

As of 6pm this evening, the temperature is up to 36°F, and the wind has gone around to the southeast; it must feel positively tropical compared to the conditions only 8 hours earlier.  Check out the temperature gradient and wind shift across the Y-K delta region in the 6pm surface data (click to enlarge):


Here's the 3am surface analysis, courtesy of Environment Canada; note the strong pressure gradient over southwestern Alaska, with a cold high to the north (-28°F at Galena this morning, -26°F at Kaltag).


In light of the ice storm earlier in the month (see my earlier post), I took a quick look at the historical frequency of liquid precipitation (rain or drizzle) in winter at Bethel and a few other sites.  The chart below shows the annual percentage of winter (November-March) hourly observations that reported rain or drizzle, regardless of temperature, in Bethel.  Note that I've excluded supplementary observations that were not taken at the top of the hour.


I'd be surprised if there are not some systematic biases between the pre-ASOS era (pre-1998) and the modern era, so I think about all we can say is that there's no evidence of an increase in the frequency of winter rain in Bethel.  The frequency has been relatively high in the past decade, but it seems to have been high also in the 1980s and in many previous years.

Here's the same chart for McGrath and Fairbanks, with the same vertical scale to emphasize the drastic difference in climatological frequency of liquid precip in winter.  If the trends are reliable, McGrath seems to have seen a rather steady decline in frequency, whereas Fairbanks has seen an upward trend in the last 20-30 years (but perhaps not exceeding the levels of earlier decades).


For completeness, I include the chart for Anchorage below, which also shows nothing particularly exceptional.  However, the second chart below shows the frequency of liquid precipitation at sub-freezing temperatures, i.e. freezing rain or freezing drizzle, and this does seem to show a decline since the 1980s (the 2013-2014 spike notwithstanding).  It seems possible that the warming trend in the more maritime zone of south-central Alaska has tended to produce more plain rain at the expense of freezing rain in winter.


Tuesday, November 12, 2019

Summer Forecast Verification

This is just a quick follow-up to a post from way back in May, where I showed the Climate Prediction Center's summer forecast and commented on a possible connection between equatorial winds in the stratosphere and summer rainfall in parts of Alaska.  Here's the post:

https://ak-wx.blogspot.com/2019/05/seasonal-outlook.html

Let's see how well the CPC forecast did.  First, for temperature: compare the maps below.  The second map shows the estimated summer temperature anomaly (departure from 1981-2010 normal) from the new start-of-the-art ERA5 reanalysis.  The forecast was a strong success, with the very high (>60%) chance of significantly above-normal temperatures in southern and western Alaska being fully justified by the exceptionally warm summer that actually occurred.


Second, for precipitation.  The ERA5 verification map indicates that the wet tilt to the forecast verified as correct for the North Slope, but most of the interior, south, and west was near normal or below normal for summer rainfall.  The expectation for widespread above-normal precipitation was therefore not correct, although the tilt in the probabilities was small and this would be considered only a minor forecast bust.


The ERA5 reanalysis is, of course, only a model, so let's take a second look using gridded precipitation data based solely on surface observations (available only over land).  This shows a wet summer on the Seward Peninsula, which is confirmed by Nome's 10" of summer rain - it was one of the wetter summers in Nome's history.  So this certainly provides some vindication for the CPC forecast.


In my earlier post I suggested that the phase of the equatorial Quasi-Biennial Oscillation (QBO) might produce a drier tendency over northwestern Alaska than the CPC was expecting.  While it did indeed turn out drier in much of the interior, neither of the two locations I cited as showing a QBO influence - Bettles and Kotzebue - had a dry July-August period.  So I won't make any bold claims about this being a success, but it is possible that consideration of the QBO phase might have improved the CPC precip forecast slightly.

Wednesday, November 6, 2019

Kuskokwim Ice Storm

The topic of this post is not ice on the Kuskokwim River, but rather a severe and long-duration freezing rain event ("ice storm") yesterday in the lower Kuskokwim region.  Bethel seems to have been hard-hit, with schools closed yesterday (I'm guessing this doesn't happen often).  The following photo, provided on Twitter by Mark Springer of Bethel, illustrates the kind of difficulties residents ran into (click to enlarge).


The observations from Bethel airport recorded the remarkable persistence of rain at sub-freezing temperatures; rain began at 1am on Tuesday with a temperature of 21°F, and it continued uninterrupted until 4am today, by which time the temperature had risen to 31°F.  The midnight-to-midnight precipitation total was 0.52", which was all rain.

Yesterday's 3pm surface analysis from Environment Canada shows the situation: a low pressure system to the south, strong high pressure (with associated cold surface air) draped over northern Alaska, and a frontal zone just to the south of Bethel.


Surface temperatures showed a sharp gradient between the Y-K delta and the Alaska Peninsula - see the red numbers in the 7am plot below.


Looking at the lowest levels of yesterday's 3pm Bethel sounding (below), the cold surface flow is from the northeast, but not far above the surface the flow has a southerly component, and a substantial above-freezing layer is evident from about 980mb up to 880mb.  This is a freezing rain temperature profile: snow formed at higher levels melts as it falls through the warm layer, but then it is super-cooled below freezing in the short journey through the surface cold layer - and then it freezes on impact with any surface object.


Farther up the valley in McGrath, freezing rain developed around noon (at a temperature of 15°F!) and persisted for about 12 hours, although it was mixed with ice pellets or other solid precipitation at times owing to the deeper, colder surface layer.  Additional light amounts have been occurring on and off today.


It would be worth taking a look at historical data from Bethel and McGrath to see how often freezing rain events of this magnitude have occurred in the past.  Fairbanks has seen a considerable number of freezing rain events in recent years, but the phenomenon is by no means just a recent one in interior Alaska (see e.g. here https://ak-wx.blogspot.com/2018/01/freezing-rain.html).  A comprehensive study of whether and where freezing rain is becoming more common, and whether it's an expected consequence of a warming climate in the far north, would be interesting and useful.


Update Nov 8: here's a paper about rain-on-snow events in Alaska, suggesting that frequency is likely to increase in (interestingly) southwestern and interior regions.

https://iopscience.iop.org/article/10.1088/1748-9326/aac9d3/pdf

And here's another of my posts from some years ago:

http://ak-wx.blogspot.com/2013/11/winter-rain-climatology.html