Wednesday, October 2, 2013

The PDO in Early Winter

As we move from autumn towards winter in interior Alaska, the phase of the Pacific Decadal Oscillation (PDO) will become a more important influence on the prevailing climate anomalies.  The PDO phase is quite highly correlated with average temperatures from about November through March in interior Alaska, while September is the month with the weakest connection.  The chart below shows that the PDO was negative for most of this summer, returned to near-neutral in early September, and has become more negative again in recent days.  Longer term, the PDO has been predominantly negative since late 2007, after being generally positive from 1976 to 1997.


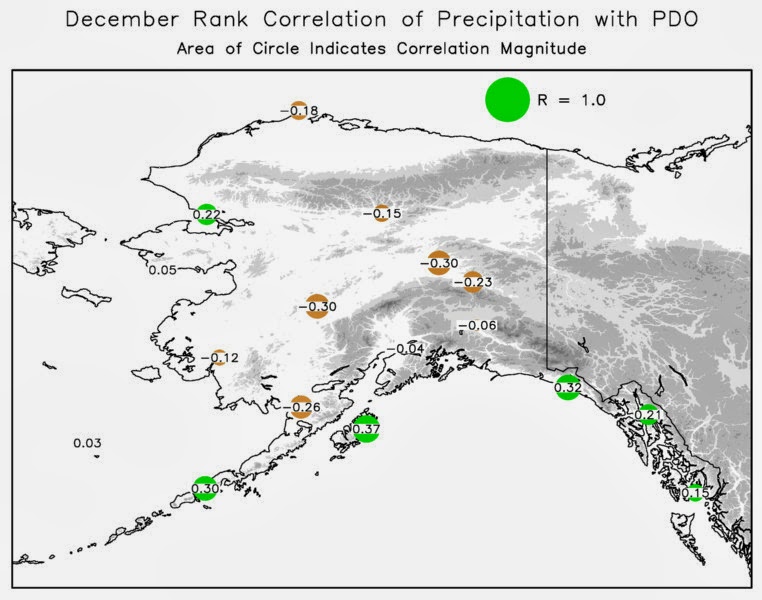
Much has been written about the influence of the PDO on Alaska climate, but to illustrate the effects here I looked at monthly data for 17 stations from 1950 to 2010.  The maps below show the rank correlation of the monthly PDO index with temperature and precipitation for October through December; note that you should be able to click on the maps individually to bring up full-size versions.  I've used the Spearman rank correlation coefficient rather than the Pearson correlation coefficient, because the Pearson correlation can be badly swayed by outliers and is inappropriate for precipitation, which has a non-Gaussian distribution.

A few points stand out from the maps:

  • The positive correlation with temperature is universal across Alaska, as expected, is stronger in the south as expected, and stronger in November and December than in October (except in the southwest).  Thus a negative PDO phase tended to be associated with colder temperatures in 1950-2010, and a positive phase with warmer.
  • The correlations with precipitation are much smaller but are consistently positive along the south coast in November and December - i.e. a negative PDO favors drier conditions there.  Interestingly, the correlations become negative throughout the interior in December, i.e. a negative PDO is (weakly) associated with wetter conditions.  I did not expect to see this, though perhaps it is common knowledge to some.


October


November


December


The interesting behavior for the interior prompted me to look at the correlation between temperature and precipitation.  I had assumed that the correlation would be positive throughout Alaska in winter, but this is not the case: the map below shows that for the October through December averages, temperature is slightly inversely correlated with precipitation at Fairbanks and Big Delta; in other words, warm Oct-Dec seasons tend to be drier than average, while cold is more associated with wet.  Presumably this has to do with the frequency of a chinook pattern, which is both warm and dry.  Elsewhere in Alaska, wetter Oct-Dec seasons are generally warmer, as expected.


In conclusion: if the PDO phase stays significantly negative through the early winter, then the chance of below-average temperatures will be boosted.  Do we know if the PDO will remain in the negative phase?  No, we don't; but in past years with a significantly negative phase in July and August, the PDO almost always remained negative through the subsequent winter months, and so a negative phase this winter appears to be a good bet.  Note that this idea of a cold early winter is at odds with the analog indication from early snow, which of course means that more research is required!

One last thing to point out is that the influence of the PDO is far from linear even for temperature; the climate frequency distribution changes in interesting ways as the PDO oscillates.  Rick has done some work on this, here for example:

http://weather.arsc.edu/Events/LAWS08/Presentations/Thoman.pdf

Monday, September 30, 2013

Fairbanks Temperature Categories

After September, the likelihood of Fairbanks achieving a high temperature over 60F (even 50F) rapidly diminishes. Here is the breakdown of high temperatures broken down into common 10-degree categories. All values correspond to the January through September time period. There are three comums for each category; A) 2013 values, B) long-term (1920-2012) values, and C) normal (1981-2010) values. The chart shows that there have been many more days in the 0s, 10s, 30s, and 80s than is typical; and far fewer days in the 50s and 60s. This is a consequence of the abrupt transition from Winter to Summer with nary a Spring season.


Saturday, September 28, 2013

Statewide Temperature Average

We are heading into the time of year when sub zero temperatures occur somewhere in Alaska every day. In 2013 the first occurrence of a subzero day in the databases that NCDC maintains was on October 10th. A couple of stations nearly reached zero the other day as Richard noted but it doesn't appear to have happened yet in Alaska. The following chart shows the statewide average high and low temperature (red colums) and the daily extremes (gray shaded area) between January 1, 2012, and September 24, 2013. It appears that June 18th was the warmest day in Alaska in 2013.


Note: You can zoom into the chart to see much shorter time periods. Click the Reset Zoom button to go back to the original view.

Friday, September 27, 2013

The Hot Spot

As a follow up to last week's blog post about the cold spot in the state of Alaska, this map shows which station recorded the daily high temperature the most times during 2012. There are three main concentrations. 1) Southeast Alaska is nearly always the warm spot during Winter. 2) the Central Interior is usually warmest in the early and middle Summer. 3) Southcentral Alaska is often warmest in early Summer and early Fall. Unfortunately warm temperatures are subject to more quality control problems than cold temperatures. In both warm and cold seasons, the temperature bias is far more likely to be too warm rather than too cold. Therefore, the coldest temperature readings in winter are likely showing an accurate temperature. However, in the summer, the warmest temperature readings are sometimes bogus. I manually went through the list and threw out as many obviously bad temperatures as I could but it is an imperfect exercise.

Yes, Deadhorse was the warmest day in Alaska on 7/23/12 with a high of 78F. Nuiqsut was #2 at 77F.


Wednesday, September 25, 2013

A Brief Chill in Barrow

Clear skies and offshore flow at Barrow allowed temperatures to briefly drop quite low for the time of year in the early morning hours of yesterday.  The temperature dropped to 6 °F before clouds and snow reappeared; the temperature was back up to 31 °F by late afternoon.

The low of 6 °F is the coldest so early in the season for Barrow since 1985, when 3 °F was observed on the same date.  The earliest that 0 °F has been observed is October 3.

The chart below show that temperatures have been close to normal in Barrow since mid-August, but were frequently much above normal throughout the early and middle summer.  The June-August average temperature was the sixth warmest on record, and 2013 was the fifth consecutive summer that was warmer than the 1981-2010 average.


Tuesday, September 24, 2013

2013 Fairbanks Temperature Update

2013 Temperature in Fairbanks Here is the update on annual temperatures in Fairbanks. The green shaded area represents the middle tercile (1/3) of temperatures. If temperatures are normally distributed (which is the case over the long term) we would expect for the temperature to be above the middle tercile 1/3 of the time, within the middle tercile 1/3 of the time, and below the middle tercile 1/3 of the time. I am experimenting with a new graphing tool so please bear with me if it doesn't work well on a mobile device. If it does work properly, you should be able to move your mouse over the lines to retrieve the daily information. You can also turn on or off items in the legend. We'll see ....

Monday, September 23, 2013

Short Summer Thaw Season

Back in May we had extensive discussion about the unusually cold spring conditions, which broke some longstanding records in Fairbanks - including the latest date with daily mean temperature below freezing (May 18).  With the early arrival of freezing conditions this month, it should be no surprise that the length of the continuous summer thaw season was the shortest on record in Fairbanks (despite the summer being much warmer than normal).  The most recent similar year was 1992 - again, no surprise, though it is interesting to note that 1992 was cold both in spring and in September, similar to this year.

See below for the data in graphical form; I've defined the thaw season as the period when daily mean temperatures are continuously above freezing.

In Bettles the continuous thaw season ended with the record freeze of August 31.  Remarkably, the season was bounded on both ends by hard frost (10 °F on May 19, 15 °F on August 31).  The 103 days of continuous thaw matched the outcome in 1983.


Sunday, September 22, 2013

Chilly Alaska In Context

Much of mainland Alaska is having the coolest sustained weather in September since 2004, with occasional bouts of (mostly) light snow from the Alaska Range northward as well as higher elevations in South Central. In context, an interesting aspect of this chilly weather is shown by Sunday morning's 500mb analysis:

Courtesy of Environment Canada
I've highlighted the 546dm contour, which nicely defines what we might call a polar vortex". Notice that vortex is displayed completely away from the Pole, with a massive 566dm high centered at 85N north of Scandinavia.

The anomalies show up dramaticly in the this plot from the Penn State e-wall:


There are three centers with more than 240 meter anomalies: the near-pole high, the high centered over the United Kingdom and  the broad low heights stretching from the Chukchi Se southeastward across Alaska and into the Northwest CONUS and a very deep center in the Gulf of Alaska.

Saturday, September 21, 2013

The Cold Spot in Alaska

* Updated with table* 
The coldest location in the State of Alaska today was Anaktuvuk Pass (low temperature of 9°F). Looking at an entire year, I thought it would be interesting to see which station recorded the daily low temperature the most times. The first map below shows each station that recorded a statewide daily low temperature in 2012 and the count of days that the station was the state's low. In total, 72 stations recorded the daily, statewide low temperature for a calendar day. If more that one station recorded the statewide low, each station earned a tally. Therefore, even though 2012 had 366 days, adding up all the numbers on the map yields a grand total of 468. Rick communicated to me via e-mail that FAA data are not archived at NCDC (i.e., Anaktuvuk Pass, Arctic Village, etc.), so this map should be taken with a grain of salt. Also, cooperative stations usually take their temperature measurements at 7 a.m. so there is often a time of day confound. As you can see from the map, there is a concentration in the central and southeastern Interior. Remember that this map is for the entire year. The second map below shows the September 2012 daily low stations. Who can guess the station that was both the September and the annual winner for 2012?


There are companion maps for summer but I'll save those for another day.


Friday, September 20, 2013

Winter Trends in Early Snow Years

Wednesday's early accumulating snow in Fairbanks raises the question of whether similar occurrences in the past offer any hints as to the climate patterns in the upcoming winter.  I'm always on the lookout for analogs like this, because years ago I found that unusual early-season snowfall in certain parts of the lower 48 can be a useful predictor for winter conditions.  It's conceivable that the same might be true in interior Alaska.

To take a first look at the data, I pulled out the years in which measurable (0.1" or greater) snow was observed in Fairbanks on or before September 20.  Since 1930, there have been 10 of these years prior to this year: 1930, 1933, 1948, 1962, 1972, 1978, 1980, 1989, 1992, and 1993.  Looking at the temperature and snowfall data from the subsequent winters, it seems there is a tendency for warmer than normal and snowier than normal conditions in each of November, December, and January.  For the three-month average, 2 of the 10 years had below-normal temperature, 2 had near-normal temperature, and 6 had above-normal temperature (based on the 1930-2012 tercile categories).  The distribution was the same for snowfall: 2 below-normal, 2 near-normal, and 6 above-normal.

Below are histograms of the November-December snowfall and temperature, with the columns split between the early-snow and no-early-snow years.  Although a subset of 10 years is rather small to draw a robust conclusion, the distribution does seem to be shifted towards relatively warm and snowy conditions in the years when early snow occurred.

In conclusion, the early Fairbanks snowfall seems to give us a very tentative hint that November through January might be warmer and snowier than average in Fairbanks this winter.  It's not clear why this might be the case, although the early snowfall might be signaling something about the oceanic or atmospheric pattern that is likely to persist or influence the winter conditions.  There is a lot more that could be said about the outlook for the winter, based on other factors, and I hope to put up some more posts in the weeks ahead.


Thursday, September 19, 2013

A Short But Intense Growing Season

With the 0.6" of snow that fell in Fairbanks on Wednesday, we can calculate the length of the snow-free period since the last Spring snow. 123 snow-free days occurred between the May 17th snow and the September 18th snow. During those 123 days, over 1,300 growing degree days (GDD) accumulated in Fairbanks. A GDD is tabulated for every degree that the daily average temperature is above 50°F. For example, a day with a daily average temperature of 55°F records 5 GDD for that day.

The 2013 value is the second most on record for the snow-free period. Only 2004 had more GDDs. What is remarkable is that the accumulated GDDs occurred during one of the shortest snow-free periods on record. Looking at it on a per snow-free day, 2013 was far and away the largest value for any year on record.

Wednesday, September 18, 2013

First Snow of the Autumn at Fairbanks

The first snow of the new autumn fell late Tuesday evening at Fairbanks Airport. This is four days earlier than the long term average of date of first snow of September 21st. Amounts in town have been very light, just a trace. Even on the hills there has been just a dusting, with 0.1" here on Keystone Ridge through 5am AKDT Wednesday.

Last year the first trace of snow at the Fairbanks Airport was on September 30th. So, today's trivia question is: what's the earliest and latest "first snow" (not hail) in the autumn at Fairbanks?

7pm update:  Snowfall picked up after 5am and it snowed smartly for several hours this morning. Fairbanks Airport wound up with 0.6" of snow and UAF West Ridge 0.9". This is 12 days earlier than the average date of the first measurable snow (at the Airport). These are the earliest measurable snows in the autumn at these low elevation locations since 1993.

Here at Keystone Ridge the 0.1" of snow before midnight Tuesday made this the earliest accumulating snow in the autumn since way back in 2004, and another 0.8" fell this morning.

Monday, September 16, 2013

Fall Midpoint Map

What defines the Fall season? Well, if you look it up in a textbook there will be one of two definitions. 1) astronomical Fall is between September 21 and December 21 (plus or minus a day), and 2) climatological Fall encompasses the calendar months of September, October, and November.

From a philosophical point of view, both Fall and Spring are seasons without meaning. They represent the transition period from the warm season (Summer) to the cold season (Winter) - and vice versa. As humans we give them attributes (fall foliage, greenup, breakup, etc.) but they lack the definitive markers that summer and winter have. I have done some preliminary research of alternate definitions of season boundaries but given other time constraints have not made much progress. Do they necessarily need to be equal lengths (90 days)?

Using the definition of Fall as the time period between Summer and Winter, and defining Summer and Winter by their respective peaks and troughs, a midpoint for Fall can be defined. In essence, it represents the date falling exactly between the warmest day of the year and the coldest day of the year.

The following three maps show the climatological date for the climatological midpoints of 1) Fall, 2) Summer, and 3) Winter, based on the 1981-2010 climate normals published by NCDC.

I find the Summer and Winter midpoint maps fairly intriguing but the Fall map is rather uninspiring. Anecdotally, I would define Summer in Interior Alaska as May 25th to August 10th and would define Winter as October 20th to April 20th; but I digress. Perhaps seasons can be grouped according to the climate divisions laid out in Climate Divisions for Alaska Based on Objective Methods by Bienief et al.


Sunday, September 15, 2013

September 1992…Round One Done

By late on September 15th, the snow was pretty much done in Fairbanks-land. There were widespread power outages as the heavy snow bent and brought down trees across power lines.
The rapid evolution of the upper level pattern can be seen in the 12 hourly 500mb height and anomaly plots from the NCEP/NCAR reanalysis (4pm AKDT Sep 14, 1992 right, 4am Sep 15 center, 4pm Sep 15 right):

NCEP/NCAR Reanalysis 500mb Heights & Anomalies 00Z Sep 15 (left), 12Z Sep 15 (center) and 00Z Sep 16, 19 (right)

The deep cold low that had been north of Barrow two days below sent one piece of energy southeast across the northern and eastern Interior, with a second center remaining in the Beaufort Sea.This resulted in rapid end to the precipitation over the central Interior during the day on the 15th.

The snowfall amounts from the 12th through the 15th were truly remarkable in the central Alaska Range and also in the Fairbanks area:
  • Denali National Park Headquarters: 38.1"
  • Healy coop: 24"
  • Two Rivers coop: 17.8"
  • Fairbanks IA: 16.8"
  • College 5NW coop: 16.4

Here are a couple of plots of most of the snowfall amounts and liquid equivalents I could find, done shortly after the event. The locational plots are primitive but it's what we had to work with in 1992:
A few comments: the site labled "Goldstream is actually the College 5NW cooperative observation, and the snow amount at Eielson is too high because the observers were doing hourly snowfall measurements (this happened there throughout the early 1990s). The amount at North Pole is probably slightly too low. Note that the 10" at Chatanika though is real: there was definitely  less snow there. The site labeled 9NE is the only higher elevation observation available, unlikely the heavy snows in May 1992, this one in the Fairbanks area did not have much elevation dependency. The impact of the warm air push on the 13th is evident at Nenana, where some rain fell on the 13th, so overall there was much less snow with far more liquid.

Here's a similar clunky-looking plot from the time for the Delta Junction area:

Here the main item of interest is the dramatic drop-off in precipitation south of Fort Greely. The accuracy was of these observations were confirmed at the time with the met team at Fort Greely, who reported at the snow on the ground south of Bolio Lake went to very little in just a couple miles.

First Freeze at Fairbanks

Clear skies, light wind and a cool air mass allowed the temperature to fall below freezing Sunday morning for the first time this autumn at the Fairbanks International Airport. This is about a week later than average for the Airport (median date since the observations have been at Fairbanks IA is September 8th) Many, though not all valley location had one or more freezes in late August (most widespread on the 25th). A few hillside areas have yet to freeze; the low at Keystone Ridge Sunday morning was 33F but with frost, and the Nenana Hills RWIS reported a low of 36F (though the thermometer sensor is 4 meters or more above the ground).

The plot below shows the raw date (not adjusted for leap years) of the date of first freeze at the Fairbanks Airport. As you can see, September15th is in keeping with first freeze dates over the past 15 years.


Saturday, September 14, 2013

Warmth Fading

Tuesday's high temperature of 71 °F in Fairbanks was very likely the last time that 70 °F will be reached in 2013, and it's fairly likely that even 65 °F won't be seen again this year, as the rate of seasonal change gathers pace.  The chart below shows the climatological (1930-2012) probability of reaching the temperature on the x-axis after September 15 in Fairbanks, showing that 70 °F is reached after September 15 in less than 10 % of all years, while only a third of years reach 65 °F after that date.  Note that the probabilities are about the same for the modern history (1981-present) as in the long-term history.


Thursday, September 12, 2013

September 1992…The First Snows

Continuing the saga…snow began in earnest in the Fairbanks area during the afternoon of September 12th and continued with only a few breaks into the early morning hours of the 15th. Below are the NCEP/NCAR reanalysis 500mb heights and anomalies for 10am AKDT Sep 12th (left) and 4pm AKDT Sep 13th (right). The most notable feature of this is the massive high over the southern Bering Sea. The "Death Star" had moved onto the Arctic coast with west-northwest winds aloft into Fairbanks-land.


500mb Heights and Anomalies, 18Z Sep 12 (left) and 00Z Sep 14 (right), courtesy NCEP/NCAR Reanalysis

The corresponding reanalysis for 850mb temperatures and anomalies are below. Note the temperature anomalies under the massive high aloft are not so dramatic except over the central Aleutians:
850mb Temperatures and Anomalies, 18Z Sep 12 (left) and 00Z Sep 14 (right), courtesy NCEP/NCAR Reanalysis
The image below is a scan of a gem I found in a file of miscellaneous stuff related to this event I have kept for the past 21 years. This is a hand plot of surface observations and a analysis sketch made within a few days of the event (as I recall, this was part of a post event analysis and not produced in real-time):

This is a plot of 4pm AKDT Sep 13th data. The area of snow at this time, as warm air had pushed in across the western Tanana Flats and Alaska Range: note the rain at Healy and Cantwell as well as southwest of Nenana. This critical detail is not evident in the relatively coarse-scale reanalysis. Also note that at this time north of the Yukon-Tanana uplands there was no precipitation occurring. On the 14th the cold air would push south to the Alaska Range. Here was the scenery at my house in Two Rivers (off of 22 Mile Chena Hot Springs Road) on the afternoon of September 13th:
This would be a boring photo if it was October 13th, but it wasn't. If you look close you can see the cottonwood trees behind the house are still in full leaf.

August and Summer Anomalies

The maps below show the August and climatological summer (June-August) temperature and precipitation anomalies for select observing sites in Alaska.  Red and green circles indicate above-normal temperature and precipitation respectively, while blue and brown circles indicate below-normal, relative to the 1981-2010 mean (temperature) and median (precipitation).  The size of the circles shows how far the anomalies departed from average, with larger circles indicating more unusual conditions.

For August, it's remarkable that every location experienced above-normal temperatures, although none of the anomalies was extreme: the highest standardized anomaly was at Cold Bay, where August mean temperature was 1.4 standard deviations above normal.  Both Cold Bay and Kodiak received more rainfall than in any August between 1981 and 2010, although neither location broke a record relative to the long-term history.


For the summer period of June through August, all locations were warmer than the 1981-2010 mean except for St Paul Island, which fell victim to the colder than normal Bering Sea temperatures.  Most locations were more than 1 standard deviation warmer than normal, and Gulkana temperatures were 2.2 SD above normal.  Interior and southeastern locations were much drier than average under the influence of the persistent ridge, but many coastal locations on the west side of the ridge were wet.  Barrow has seen above-median precipitation every month since March and had one of their wetter summers on record.


Tuesday, September 10, 2013

September 1992…Setting the Table

*** This is Part I. Part II is found HERE. Part III is found HERE.  ***

September 1992 brought some of the amazing out-of season-weather ever in Alaska. The Fairbanks area received several snowstorms during the month totaling more than two feet, and amazingly, the snow that started to accumulate on the September 13th remained on the ground until the following April. There was enough snow for people to be skiing on the 15th and I was running dogs with a sled on the autumnal equinox. The snow cover allowed temperatures to remain exceptionally low and produced the longest run of daily temperatures of four or more standard deviations below normal in Fairbanks weather history.

I'll be doing several posts on this historic event, starting with retrospective of September 10, 1992. Here is the mean 500mb pattern and height anomalies. The remarkably deep low north of Barrow was well forecast by the numerical models at the time, though we did not believe it in the days leading up to this event, referring to it jokingly as the "death star". Such a deep low so early in the autumn was beyond reasonableness.

The 850mb temperatures show a deep cold airmass over nearly all of the state. Temperatures in this NCEP/NCAR reanalysis are in degrees Kelvin, so freezing is 273K. The low temperature on the 10th at Fairbanks was 18F, easily a new record low for the date and the first of what would be eight daily record lows set during the month. And there was no snow on the ground yet.

Consecutive Wet Days

With Anchorage approaching the record number of consecutive days with measurable precipitation, I thought it would be interesting to see where other stations stacked up. The attached maps show the record number of consecutive days with measurable precipitation (>= 0.01") and the record number of consecutive days with at least a trace of precipitation. This was culled from the GHCN database for all Alaska stations. I decided to stick with "major" stations since they are more likely to capture days with small precipitation amounts. Ketchikan had the most consecutive days of measurable precipitation (88) and Adak had the most days with at least a trace of precipitation (203).


Here is the list that was used to make the maps above. It is sorted by max number of days with measurable precipitation.

Station_Name Measurable Trace
KETCHIKAN INTL AP 88 101
LITTLE PORT WALTER 69 71
SELDOVIA AP 58 68
ADAK 57 203
YAKUTAT STATE AP 53 90
ANNEX CREEK 53 61
JUNEAU DWTN1 51 68
KODIAK AP 50 51
JUNEAU INTL AP 49 68
WRANGELL AIRPORT 48 84
ANNETTE ISLAND AP 47 81
YAKATAGA AP 46 47
CORDOVA M K SMITH AP 45 57
JUNEAU DWTN2 43 63
MAC LEOD HARBOR 38 38
ST PAUL ISLAND AP 38 164
SEWARD AP 36 44
ST GEORGE ISLAND AP 29 115
VALDEZ WSO 29 42
BETHEL AP 29 48
JUNEAU FORECAST OFFICE 29 55
MIDDLETON ISLAND AUTO 27 49
HAINES AP 23 41
KING SALMON 22 45
TALKEETNA AP 21 30
BARROW POST ROGERS AP 21 80
EAGLE AP 21 27
HOMER AP 21 34
VALDEZ AIRPORT 20 22
MCGRATH AP 19 42
NOME MUNI AP 19 36
ANCHORAGE MERRILL FLD 19 28
KENAI MUNI AP 18 22
POINT HOPE 18 29
NENANA MUNI AP 17 50
ST MARYS AP 17 49
ANCHORAGE INTL AP 17 31
BETTLES AP 17 29
GIRDWOOD 17 22
MATANUSKA EXPERIMENT FARM 16 19
WISEMAN 16 24
FAIRBANKS MIDTOWN 16 26
KOTZEBUE RALPH WEIN AP 15 32
SKAGWAY AP 15 58
ANCHORAGE FRCST OFC 15 31
ANCHORAGE LAKE HOOD AP 15 17
BIG DELTA AP 15 24
EIELSON FLD 15 30
FAIRBANKS INTL AP 15 23
KEYSTONE RIDGE 14 23
POINT LAY 14 32
UNIVERSITY EXP STN 13 26
WOODSMOKE 13 29
GALENA AP 13 32
PRUDHOE BAY 12 33
WAINWRIGHT AP 12 40
EIELSON VISITOR CTR 12 14
FAIRBANKS AP #2 12 23
GULKANA AP 12 21
DEADHORSE AP 11 55
NUIQSUT AP 8 48