Tuesday, December 31, 2013

Deep Freeze (Temperatures Aloft)

Last week's post about the first -40° temperature of the winter in Fairbanks provoked a bit of discussion about the causes of the long-term decline in the frequency of very cold days in Fairbanks.  As reader Gary noted, there are numerous candidates for possible drivers of the long-term change, including changes in wind, cloud cover, and air mass characteristics; we also can't exclude the possibility of an urban heat island effect or subtle station siting issues.  As a simple first step at tackling this, I looked at the 850 mb temperatures from Fairbanks balloon soundings since 1948; the chart below shows the annual (cold season) number of days with 850 mb temperatures below -26 and -32 °C; these thresholds were chosen because the long-term frequencies of occurrence are close to those for -40 and -50 °F at the surface, respectively.  Last week's chart of -40 and -50 °F frequency is also reproduced below, except with an adjusted time scale for ease of comparison between the charts.


It's plain to see that the frequency of very cold temperatures aloft has also shown a notable decrease since the mid-1970's, although the warming appears less pronounced than at the surface.  Temperatures of -32 °C or lower at 850 mb have become rare in the past decade or so, just like -50 °F temperatures at the surface.  From a first glance, then, it seems that warming aloft explains at least a significant part of the dwindling of extreme cold frequency in Fairbanks.

Viewing the data in summary form, here are the 30-year counts of the extreme temperature categories, at the surface and aloft, for 1951-1980 and 1981-2010.

Surface1951-19801981-2010Difference
-40 °F or Lower434224-48%
-50 °F or Lower10615-86%

850 mb1951-19801981-2010Difference
-26 °C or Lower401257-36%
-32 °C or Lower8941-54%

Looking at the December-February mean conditions, temperatures at 850 mb have increased substantially, and only modestly less than at the surface:

DJF mean (°F)1951-19801981-2010Difference
850 mb8.311.9+3.6
Surface-9.1-4.1+5.0

As a final note, and as food for thought, the surface and upper-air data from McGrath show broadly similar trends, although the drop-off in extremely cold days is less pronounced at the surface than for Fairbanks (especially for -50 °F and below); see charts below.  Note that I used different 850 mb temperature thresholds to correspond to the long-term frequencies of the respective categories.  As an aside, it is also interesting that McGrath has a higher frequency of very cold days than Fairbanks (much higher in the modern era) despite being warmer in the mean, both at the surface and aloft.


Here are the 30-year counts and DJF means:

Surface1951-19801981-2010Difference
-40 °F or Lower481304-37%
-50 °F or Lower12783-35%

850 mb1951-19801981-2010Difference
-26 °C or Lower441341-23%
-32 °C or Lower11664-45%


DJF mean (°F)1951-19801981-2010Difference
850 mb11.413.3+1.9
Surface-7.5-2.9+4.6

Update: here's the McGrath 850 mb chart for the same temperature thresholds as Fairbanks:


Sunday, December 29, 2013

Solar Heating Minimum

** Updated on 12/30 **

As Richard noted in a recent post, there is little to no solar energy for much of Alaska this time of year. In fact, there is no functional solar heating anywhere north of Fairbanks for the next several weeks. In looking at hourly data for Bettles from NCDC, I looked at the average hourly temperature for every day of the year to see when solar energy stopped influencing daily temperatures (n=45 years). Bettles was chosen due to its location far away from any alternate heat source (e.g., an ocean).

Though trial and error, it appears that when the sun is 3° above the horizon or less, there is no perceptible diurnal temperature difference. At 3° above the horizon, the theoretical solar energy is 9 watts/square meter. At the latitude of Bettles, that translates to a 55-day period of no solar heating. The next two charts show the annual solar elevation for Bettles and for Barrow.


The chart immediately below shows the average hourly temperature for the 55-days at Bettles where the sun is less than 3° above the horizon. Interestingly, there is a very slight bump at the equivalent of solar noon – even on days when there is no sunrise at all!


The final graphic (map) shows the number of days with no effective solar heating; i.e., to maximum solar elevation is 3° or less. The 835 GHCN stations are shown as green dots.


** Updated Section **

Here are some charts showing the hourly temperatures and sea level pressure readings for the days with no sunrise and no sunset at Bettles (Dec. 12 to Dec. 31 & June 12 to July 2 respectively). Note: Due to Leap Years and the procession of the equinoxes, the dates will be slightly different from year to year.


The final (?) chart shows the hourly temperatures for Barrow between December 1st and January 27th. December 1st was chosen to account for the variability in sea ice pack closure around Barrow. January 27th was chosen due to that being the date that the sun is still below the horizon. The local effect at Bettles disappears. When only those days when the sun was within 2 degrees of the horizon were chosen, the line was still effectively flat. Interestingly, the point at which a daily insolation pattern was established in the Spring wasn't until the sun was 5° above the horizon (~Feb. 14th).

Also, the 3-hour pattern that Eric noted is highly exaggerated for Barrow. It turns out that this is due to some days recording temperatures in 3-hour increments instead of hourly. Those occurrences are much more frequent in the earlier part of the climate record when the temperatures at Barrow were significantly colder. It will take more work to tease out those obs.


Friday, December 27, 2013

Maximum Statewide Temperature Range

There have been several references in social media the last few days  (here and here) regarding the range of temperatures across the state approaching 100 degrees. I thought it would be interesting to see what the greatest daily temperature range was in the Alaska climate record. The winner appears to be February 3rd, 1977, with a statewide temperature range of 125°F. The high temperature was +60°F at Annette Island and the low temperature was -65°F at Umiat. There are 5 or 6 days in the GHCN database with larger ranges but they all contain highly questionable values; e.g., a max high of +73°F with the second highest of +45°F. None of those instances were even marginal so they were easy to toss out. No more than 4 days have ever had a daily range of over 120°F.

I initially expected the record range day to fall in mid February to early March since the far northerly latitudes receive little insolation and the stations in Southeast Alaska receive a fair amount. What surprised me was that December and January are the months most likely to see a day with a statewide diurnal range in excess on 110°F.


Thursday, December 26, 2013

Deep Freeze

The temperature at Fairbanks airport touched -40° this morning for the first time this winter.  This is very close to the long-term median date of December 28 for the first -40° reading in Fairbanks, but slightly earlier than the 1981-present median date of January 4.  The long-term median for latest -40° reading is February 10.  Note that -40° is never reached in slightly more than 10 percent of winters in Fairbanks (15 percent since 1981).

It's colder yet at many other interior Alaska stations, including -50 °F in Eagle and -58 °F in Chicken.

The chart below shows the annual number of days reaching -40 °F (total column height) and -50 °F (red columns) in Fairbanks since 1930.  The long-term decline is very noticeable, especially for -50 °F days which have become rare.  However, there was tremendous year-to-year variability prior to about 1975; some winters had few or no extreme cold days, while others had many.  Superficially, it appears that variability has decreased, but this could be an artifact of sampling a smaller portion of the climate distribution in recent decades.


Webcam photos from around Fairbanks show the clear skies and shallow ice fog that are typical in association with deep cold.


Wednesday, December 25, 2013

Climatology When Clock Strikes Midnight at the New Year

** Updated on January 1, 2014 **

What should residents of the Golden Heart City wear when out celebrating at midnight New Year's Eve? Well, when looking back at the climate record, I would suggest something between warm and very, very warm. Richard pointed me to the ISH hourly record database a few days ago so I pulled all the observations that were available for Fairbanks and selected the ones for midnight at the New Year. Since 1941, the average temperature at midnight was -9°F. The coldest temperature was a bone chilling -53°F to ring in 1969 and the warmest was just one year later when it was a rather balmy 30°F. Six of the 74 years recorded dense fog at midnight and is was snowing 13 times. On the chart, any amount of cloudiness was identified as 'cloudy'.


Monday, December 23, 2013

Fairbanks Snow

The weekend snow accumulation of 8.4" in Fairbanks has brought the season-to-date snow total to 32.9", which is slightly above the long-term mean and median for this date, but still slightly below the official 1981-2010 normal.  The two-day total is the greatest in more than a year, and is equal to the largest amount typically observed in an entire winter.  This is illustrated by the chart below, which shows the distribution of annual maximum 2-day snowfall totals since 1930 in Fairbanks.

If we look at this data in isolation, we might conclude that there is a 50% chance that this weekend's snowfall will turn out to be the largest (2-day) snowfall of the winter.  However, less than a full winter remains in which to get an even bigger snowfall; so given that the date is already December 23, we find that there is only a 31% chance of a bigger snowfall yet to come.  In other words, the chance is 69% that this weekend's snowfall will prove to be the largest 2-day total of the 2013-2014 winter.


Sunday, December 22, 2013

Fairbanks Temperature Anomalies

First of all, a big thanks to Brian and Richard for keeping DEEP COLD the blog, going. It's definitely become a collaborative endeavor.

Temperatures in Fairbanks have been much more variable lately than we've seen much of the past year. Here's an update (through Dec 20) of my usual standardized temperature departure graphics. Recall that standardizing is just a way of doing an "apples to apples" comparison for things like Interior Alaska temperatures were the potential variability differs greatly from winter to summer.

The top plot is the standardized anomaly of the daily mean temperature. The bottom plot is the 5-day running mean  temperature standardized anomaly. For more than a month now temperatures have been on a bit of a yo-yo, with only the mild weather early this month standing out in the 5-day running mean. Just eyeballing the daily plot, the only somewhat similar time to the current swings was mid-August to mid-September, though this is less evident when looking at the 5-day plot.

Saturday, December 21, 2013

Winter Pre- and Post-Solstice

With today being the winter solstice, I was curious to look at the relative partition of snowfall and accumulated cold in Fairbanks before and after the astronomical midpoint of winter.  Of course we know that the thermal midpoint of winter occurs well after the solstice, especially near the north and west coast of Alaska, but what fraction of winter's cold and snow occur before the solstice?  To address this, I looked at freezing degree days as a measure of accumulated cold, and total snowfall; see the charts below.


According to the long-term (1930-2012) average, it is typical for about 35% of the freezing degree days in Fairbanks to occur before the solstice; in other words, nearly two-thirds of the cold still lies ahead, on average.  In 1977-78 the degree days were almost exactly evenly divided before and after the solstice, but in every other year there has been more cold after the solstice.

As one might expect, there's more variability in the partition of snowfall totals, ranging from 12% of the seasonal total occurring before the solstice in 1953-54, to 81% in 1982-83.  Interestingly, it was not uncommon for more than half the seasonal total to fall before the solstice from 1970 to 1998, but the long-term average is 48% before the solstice.  The multi-decadal trends are interesting for both temperature and snowfall, with recent years seeing a shift towards cold and snow occurring preferentially in the second half of astronomical winter; this is more in line with the pattern prior to about 1970.

A quick look at other cities in Alaska shows notable variability in the partition of snow and cold; here's the 1930-2012 average of the fraction of cold and snow occurring prior to the solstice:

Freezing degree days
Fairbanks: 35 %
Anchorage: 34 %
Barrow: 28 %
Nome: 27 %

Snowfall
Fairbanks: 48 %
Anchorage: 41 %
Barrow: 60 %
Nome: 34 %

Friday, December 20, 2013

Christmas Day Climatology

** Update with 2013 information added to chart. **

Here is a chart showing the past climate of Fairbanks on Christmas Day. This is similar to the chart I posted on Thanksgiving except the daily snow depth is now shown instead of the daily snowfall. The Normal Max and Normal Min lines change each decade as the 30-year climate normal period shifts. The snow depth values are Missing between 1921 and 1928 but looking at the daily snowfall observations and the temperatures, those years certainly had a white Christmas. On the other hand, 1934 had a snow depth of 0" on Christmas Day. There was a historic Chinook event mid-month that melted the snow. However, an inch or so of snow fell in the 10 days prior to Christmas so I suspect there was a little snow around town.

The second chart shows some records around the state of Alaska on Christmas Day. Rick pointed out the -60°F max temperature in Deering in 1917 is probably not accurate. Therefore, I included the two second-place readings. The same is true for the snow depth in Annex Creek. Their depth reading moved around substantially during the month more than the daily observations would suggest.


Wednesday, December 18, 2013

Analog Seasonal Outlook

As promised a few days ago, I have dug up a number of past years in which Barrow experienced both wet and warm conditions, similar to this year, with a view to creating a new analog forecast for the upcoming months.  The idea here, as with past analog studies, is to explore whether similar past years tended to produce any notable departures from normal weather in the subsequent months; if so, then we have a statistical forecast for the outcome this year.  It turns out that the Barrow analog years do provide some interesting signals for the subsequent January through March.

Using historical data since 1930, I found 10 analog years in which the March through November average conditions in Barrow were both unusually warm and wet; specifically, I required both the mean temperature and total precipitation to be in the top 22 out of 84 years.  Note that March through November 2013 was the fourth warmest and second wettest such period in Barrow's history since 1930.  The analog years are 1950, 1951, 1989, 1997, 2003, 2004, 2009, 2010, 2011, and 2012; obviously we see the long-term trend at play here, with this year being the fifth consecutive year of relatively warm, wet conditions in comparison to the long-term average.

The charts below (click to enlarge) show the number of years (out of 10) in which the subsequent monthly mean temperature and total snowfall occurred in each of the three climatological terciles (below-normal, near-normal, above-normal), based on the 1981-2010 climatology, for Barrow, Fairbanks, and Anchorage.  For example, for Barrow in January, 4 of the analog years produced below-normal temperatures (lower tercile), 2 years produced near-normal temperatures (middle tercile), and 4 years produced above-normal temperatures (upper tercile).


The most striking feature of the analogs is that 7 out of 10 years produced significantly colder than average conditions in Fairbanks in January, and only one analog year (2013) produced a notably warm January.  The probabilities also appear to be shifted away from warm in February and March, though to a lesser extent.

For Barrow and Anchorage, the analog signals are less notable, but it is worth mentioning that warmth seems favored for March in Barrow, and above-normal snowfall seems somewhat likely for Anchorage in February.  The lack of near-normal temperatures in Barrow appears to be mainly a result of the long-term trend; recent years have been unusually warm, but most of the earlier years were unusually cold, relative to the 1981-2010 normals.

It's interesting to look at the broader picture to see what large-scale patterns were characteristic of the analog years.  The maps below show the percentage of years in which the monthly mean values were above or below the 1981-2010 mean for 500 mb height, sea-level pressure, and 2 m temperature.  Note that these data are all from the NCEP/NCAR global reanalysis and the temperature values should be taken with a large pinch of salt.

First, January: the analog years tend to have upper-level ridging over the Bering Sea and high pressure over northern Alaska; this clearly favors colder conditions at the surface over interior Alaska and northwestern Canada.


The analogs show a nearly complete reversal in the pattern for February, with unusually low pressure aloft and at the surface over western Alaska.  Above-normal temperatures are slightly favored in southern Alaska and western Canada, as the highest likelihood of unusual cold is in eastern Siberia.


Finally, for March: there isn't much of a signal for the broad circulation pattern.


To sum up, the history of similar past years based solely on the conditions in Barrow this year provides a hint as to what might transpire in January through March 2014.  While the uncertainty is great, and we can't have high confidence in this kind of forecast, the analogs suggest a cold January may be in store for Fairbanks.  In 9 out of the 10 analog years, the number of days in January with a daily minimum temperature of -20 °F or lower was at or above the 1981-2010 median of 13 days.  However, the January and February weather patterns seem likely to be quite different from each other, with more unsettled conditions in February perhaps leading to a snowy month for Anchorage.

Tuesday, December 17, 2013

Snow Temperature in Fairbanks

* Updated to include average min and max temperatures and an Anchorage chart for comparison.*

Over the previous few days, the forecast for Fairbanks had been calling for snow between 1 and 2 inches with temperatures in the teens below zero. The old adage that it is too cold to snow is not exactly accurate. However, it can be too cold to snow a whole lot. That is why Barrow has the lowest annual snowfall of all first-order stations in Alaska.

On Saturday (11/14/2013), Fairbanks received 1.7" of snow with a daily average temperature of 0°F. Looking at the chart below, that is only a few degrees colder than a typical 1"-2" snowfall day during the winter months. On Sunday (11/15/2013), Fairbanks received 0.9" of snow with a daily average temperature of -7°F. That is about 5° colder than a typical snow under 1". Some of the minimum temperature vs. snow amounts are remarkable. The 'Trace' amounts may consist of ice crystals in many instances. Still it is difficult to fathom receiving 1"-2" of snow with a daily average under -35°F!


Monday, December 16, 2013

Dark and Cold

Surface temperatures have cooled into the -40's at a number of northern interior locations in the past 24 hours or so.  Some of the colder observations so far are:  Fort Yukon SNOTEL (-50 °F), Bettles SNOTEL (-49 °F), Chalkyitsik RAWS (-47 °F), Arctic Village (-45 °F), Bettles ASOS (-42 °F), and just in the last hour, Eagle airport (-41 °F).

Yesterday's sub-minus 40° reading at Bettles was the first of the season there, and comes one day after the length of daylight (sunrise to sunset) dropped below 2 hours.  The day length will remain less than 2 hours until December 28.  During this 15-day window each year, Bettles sees -40 °F or lower slightly more often than not; so today's temperatures, despite being well below normal, are not particularly unusual.

Today's FAA webcam images from Bettles, taken a short while after solar noon, showed the half-light of a late December day; despite mostly clear skies, a few high clouds in the south prevented sunshine from reaching the village.


Friday, December 13, 2013

Unusual Wind

Thursday was one of the windiest days in recent decades in Fairbanks, and remarkably this occurred in the least windy month of the year, climatologically speaking.  The mean daily wind speed was 20.3 mph, which is higher than all but two other days in the 1984-present history of this weather variable.  The chart below shows the maximum daily mean wind speed and the 90th percentile of all daily mean values, categorized by month.  Ninety percent of days in December have daily mean wind speeds below 5.6 mph, and the previous highest value observed in December was 14.1 mph on December 4, 1991.


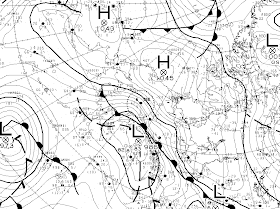
The culprit for this outcome was an intense synoptic-scale pressure gradient over Alaska, as seen in the 3 am AKST surface analysis from yesterday: a very strong anticyclone was located over the North Slope, while a strong low pressure system was affecting the Gulf of Alaska.  The unusual aspect of this is the intensity of the high pressure in the north.


Wednesday, December 11, 2013

Autumn Forecast Verification

Regular readers may recall that way back in August we discussed some long-range analog forecast indicators for September through November, based (only) on the warm, dry summer that occurred in interior Alaska.  It's always fun to go back and check long-range forecasts to see if there was any semblance to the actual outcome; so here we go.

Listed below are the main (though admittedly tentative) conclusions of the analog investigation, along with the corresponding outcome:

  • Dry September in Fairbanks: incorrect  1.74" vs 1.08" 1981-2010 median precipitation.  Three-quarters of an inch of rain fell on one day, September 11.
  • First 25 °F frost in Fairbanks earlier than normal: correct  Sep 20 vs Sep 26 1930-2012 median
  • First 0.5" or greater snowfall in Fairbanks earlier than normal: correct  Sep 18 vs Oct 6 normal
  • Wet September in Barrow: correct  1.29" vs 0.59" normal
  • Warm October in Barrow, Fairbanks, and Anchorage: all three correct, much warmer than normal
  • Warm November in Anchorage: correct but only barely, 21.9 °F vs 21.3 °F normal

The discussion also showed maps of the 500 mb height and sea-level pressure patterns that have historically been observed in September following warm, dry summers in Fairbanks.  Below is the observed September 500 mb height anomaly: this agreed very nicely with the forecast map, with one of the main features being low heights over the Chukchi Sea.

Finally, here's the observed sea-level pressure pattern from September; this doesn't show the same degree of correspondence with the analog forecast map, but nevertheless below-normal pressure occurred as expected over eastern Alaska and western Canada.
All in all, the forecast exercise was fairly successful and illustrates that simple statistical techniques can - if you're lucky - yield limited long-range predictability.  In the next week or so I'll put together another analog forecast based on the very wet, warm year that Barrow has observed.

Tuesday, December 10, 2013

Cold, or Cloudy?

When teaching principles of weather to a class full of college students (non-science majors), they are usually surprised to hear that in winter the coldest days are often sunny (or clear) and the warmest days are cloudy. That is counter intuitive to their summer experience. However, the basic principle of downward radiation of longwave energy from clouds is a universally accepted principle. When there is no offset from a reduction of solar energy (insolation), the net effect is for warmer temperatures.

In Interior Alaska, there is a variable length of time each winter with little to no insolation. For Fairbanks, the time period between November 29th and January 12th (45 days) experiences less than, 10 watts per square meter of insolation per day. This is a theoretical calculation based on the latitude and the astronomical position of the earth. The first figure shows the theoretical insolation for Anchorage (blue) and Fairbanks (red).

The GHCN database contains average daily percentage of cloud cover for most days between 1967 and 1997. This is enough time to build a climate normal of cloudiness. To determine the effect of cloud cover on temperature, I looked at the 45 days identified above with little insolation and then charted the average cloudiness for different temperature groupings. The second chart shows the relationship between temperature and cloudiness in Fairbanks on all days between Nov. 29 and Jan. 12. At first glance there appears to be a problem. The very coldest days (<= -40) have more clouds than days slightly less cold. My guess is that ice fog causes this confounding of the cloud cover vs. temperature relationship. Interestingly, some textbooks do not consider fog as a cloud type but that is a debate for academics to hash out.

As a non-Fairbanksan, I don't know what people prefer. Sunny and cold, or cloudy and not as cold?


Sunday, December 8, 2013

North Slope Rain

It's hard to believe that rain could ever occur in regions experiencing polar night, but this is what happened on Friday and Saturday at most locations along the Arctic coast of Alaska.  Rain with temperatures above freezing was reported from Cape Lisburne to Barter Island, including at Point Lay, Wainwright, Atqasuk, Nuiqsut, and Deadhorse.  Apparently only Barrow managed to remain all snow.

Is this unprecedented?  It would seem not; Barrow has had at least a few freezing rain or plain rain events in the depths of winter.  The most notable appears to have been January 27-29, 1963, when precipitation on the three days was 0.03", 0.03", and 0.16", with only a trace of snow.  High temperatures were 29, 34, and 35 °F respectively, and balloon soundings suggest that temperatures were continuously above freezing aloft for more than 60 hours.

So where did all the cold air go?  Down into the lower 48.  Yesterday's high temperature was higher at Deadhorse (39 °F) than in Corpus Christi, TX (38 °F); so we can say that it was just as warm on the Arctic coast as on the coast of the Gulf of Mexico.  The two surface observation charts below illustrate the situation at about 8 pm AKST last night (red numbers are temperature reports):