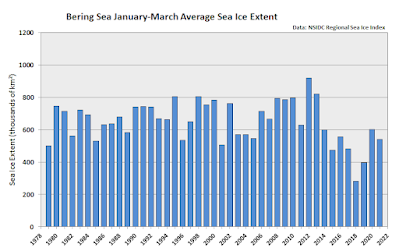
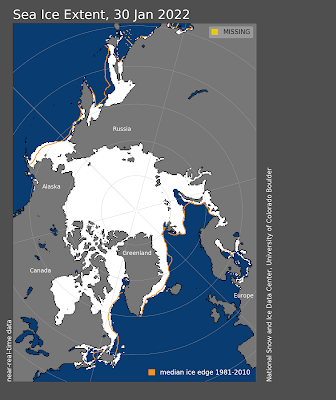
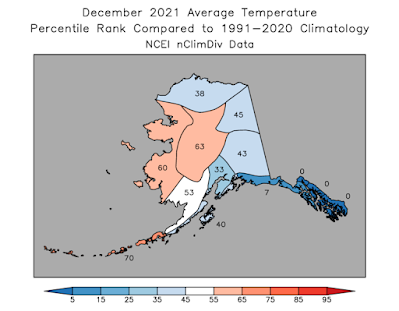
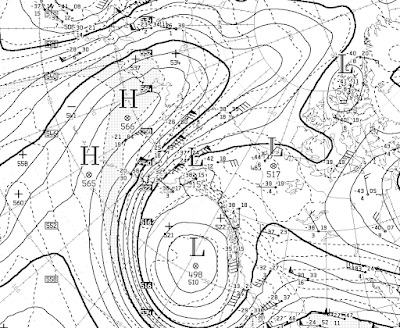
It's high time for an update on sea ice in Alaskan and Arctic waters. In the Bering Sea, the relatively cold weather of early winter produced a strong start to the ice season in November and early December, and further gains have been seen in January with temperatures closer to normal. As a consequence, Bering ice extent is considerably above normal for the time of year, although not to the level of the last strongly negative PDO winter of 2011-2012.
Objective Comments and Analysis - All Science, No Politics
Primary Author Richard James
2010-2013 Author Rick Thoman
Monday, January 31, 2022
Sea Ice Update
Sunday, January 23, 2022
Warmest and Wettest in Winter
Thursday, January 20, 2022
Follow-Up on Yakutat
A quick follow-up to my last post is in order after some helpful comments from Jim Green (who has an interesting blog post on snow loads here.) Jim has observed a large shortfall in reported precipitation at the Haines ASOS, and he proposes a similar deficiency in the data from Yakutat. I think this is a highly credible suggestion given Jim's information, as well as data from the Yakutat CRN site.
I'm not sure why I didn't check this before, but indeed the Yakutat CRN - which is located right next to the airport - reported much more precipitation in November and December than the ASOS instrument. See below (but the CRN has missing data since January 6).
From November 10 through January 5, the CRN reported over 3.5" (32%) more precipitation than the ASOS, and if we apply this ratio to my earlier estimates, we arrive at perhaps 150" of snow, instead of 100-120".
Jim also points out the following photo from January 11, the day Yakutat declared their emergency. The snow depth appears to be at least 60", which is consistent with well over 100" of total snowfall. And if Jim's snow density measurement applies here, then Yakutat's snow pack may have had at least 18" of liquid-equivalent stored in it; this suggests that perhaps even the CRN was reporting too little precipitation. Snow water storage of 18" translates into nearly 100 lbs of snow load per square foot.
Not gonna complain it is cold today.
— Eugene Wilkie (ReesusPatriot) (@ResusCGMedia) January 11, 2022
Glacier Bear Lodge
Yakutat, Alaska. pic.twitter.com/npJ2mYcIJo
As an aside, I compared November-December precipitation totals between the Yakutat CRN and ASOS, and in the 3 years with complete data, the CRN reported 12%, 33%, and 30% more than the ASOS. So it appears this is not a new problem with winter precipitation amounts, even in more typically rainy years.
Friday, January 14, 2022
What's Going On In Yakutat?
Weather continues to be in the headlines in Alaska, with the town of Yakutat declaring a "local disaster emergency" on Tuesday because of excessive snow loads that have caused significant damage. There's been similar trouble in Juneau, with at least two commercial building collapsing earlier this week, and the governor issued a disaster declaration yesterday.
The photos in the second news link above appear to show a snow depth of at least several feet in Yakutat, but I'm not aware of any actual measurements of the current snow pack or how much snow has fallen so far this winter. Regrettably, Yakutat's airport climate data hasn't included snowfall since the winter of 2017-2018, and there are no other observing platforms (e.g. Snotel) in the area. The daily climate data only include liquid-equivalent precipitation, and actually this has been far below normal for the time of year - see below. Yakutat is an extremely wet place in winter, but typically it's mostly rain.
But let's not allow the lack of snow measurements to get in the way of a bit of science. We do still have hourly ASOS reports from Yakutat, and these include weather type, such as "snow", "rain", "fog", etc, and also hourly liquid-equivalent precipitation. So I went back through the history to 1973 and calculated the fraction of the November 10 - January 10 precipitation that fell in hours when snow was reported as the weather type. Of course many hours have both snow and rain reported, so I excluded those hours. The November 10 - January 10 window corresponds roughly to the period when accumulating snow seems to have occurred in Yakutat so far this winter, judging from temperatures.
I then applied the "snow fraction" to the total precipitation from the daily climate data, resulting in an estimate for snow liquid equivalent each year. Comparing these estimates to the actual snow data that ended in 2017, we see a pretty good relationship (R=0.89) between measured snowfall and estimated snow liquid equivalent.
Remarkably, this year's snow liquid equivalent (estimated) is 10.4", which is the third highest since 1973 despite total precipitation being the lowest since 1990 for this two-month window! Using the simple linear regression, we can estimate about 100-120" in total snowfall.
While this is a lot of snow, it's unlikely to have been a record for total snowfall in the two-month window, let alone a full winter; Yakutat has seen well over 300" of snow in a winter before (most recently 2011-12). However, the key issue is of course how much melts in between fresh accumulations. Looking at thaw degree days (accumulation of daily mean temperatures above freezing) since November 10, the past two months have been so cold that there has been very little melting in Yakutat; total TDDs were the third lowest on record for the date window.
The following chart summarizes the situation: a lot of snow has fallen (judging from hourly data), and very little melting has occurred. The combination appears to be unprecedented in recent decades, as the only other years with a lot of snow also had much more meltout.
While this simple analysis provides quite a pleasing explanation for the recent difficulties in Yakutat, a couple of puzzling aspects remain. If we go back to earlier decades in the climate history, there are a number of years when similar or greater amounts of snow fell in a two-month window with just as little melting; for example, December 1971 - January 1972 saw 138" of snow (and over 18" of liquid equivalent) with very little meltout. January-February 1988 produced 118" of snow with cold conditions.
We also have the fact that the reported snow depth was as high as 96" in March 2012, and it's difficult to imagine that today's snow load is greater than it was at the end of that epic winter. But perhaps it is, with the very heavy snow and rain earlier this week pushing it over the edge. Without ground-truth data, we'll never know for sure.
Monday, January 10, 2022
December Anomalies
Here's an illustration of how unusual the December precipitation was at @DenaliNPS HQ. This shows the percent of number of months in early winter with total precipitation grouped by half inch increments. Dec 2021 really is in a class by itself. #akwx @Climatologist49 @FDNMkris pic.twitter.com/IRyavUGmP6
— Rick Thoman (@AlaskaWx) January 7, 2022
From ERA5 reanalysis courtesy @CopernicusECMWF, percent of December precip that fell as snow (left) vs 1991-2020 average (right). Much lower percentages than average central/western mainland, but much higher percent of total precip was snow in Southeast. #akwx @Climatologist49 pic.twitter.com/RQBOpLZRuB
— Rick Thoman (@AlaskaWx) January 9, 2022
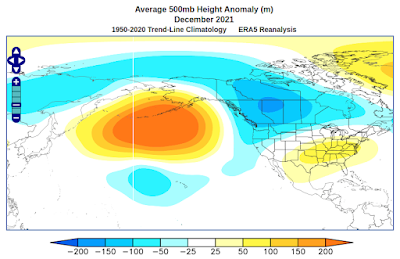
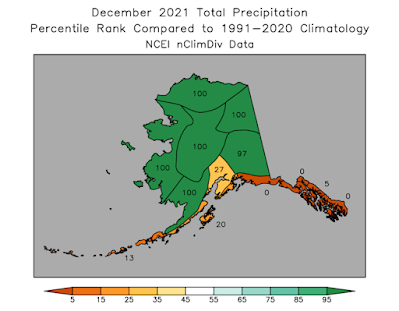
December precipitation was far above normal over much of Alaska & nearby areas in the Yukon & Chukotka — dramatic contrast to the Gulf of Alaska coast/Panhandle. Patterns like this result from unusual patterns aloft, here North Pacific record high pressure. #akwx @Climatologist49 pic.twitter.com/pCY3jF0jJS
— Rick Thoman (@AlaskaWx) January 8, 2022
Total rain/freezing rain (as opposed to precipitation that fell as snow) Dec 25-28, 2021 as seen in ERA5 courtesy @CopernicusECMWF. Huge area with high-end rainfall and close to unprecedented mid-winter amounts from Fairbanks southwest into @DenaliNPS. #akwx @Climatologist49 pic.twitter.com/81L46P7RKy
— Rick Thoman (@AlaskaWx) January 8, 2022
December was a wild, wacky and impactful #winter month weather-wise over much of Alaska. From unusual cold to unprecedented warmth, excessive snowfall to record dry. Plus severe blizzards, crippling freezing rain and damaging winds. #akwx #Arctic #akclimatehighlights @IARC_Alaska pic.twitter.com/Vz5ydMNVn7
— Rick Thoman (@AlaskaWx) January 1, 2022
Tuesday, January 4, 2022
Mat-Su Wind Storm
Saturday, January 1, 2022
Cold
It's a cold start to the new year in Fairbanks-land, with an air mass moving through that's worthy of this blog's name, i.e. deep cold. Temperatures are lower in the hills than at valley level, with nasty wind chills.
Here are noon temperatures around the area (click to enlarge):
The 3am sounding from Fairbanks reported an 850mb temperature of -28°C or -18°F, but it's closer to -25°F now.
After noting on Thursday the rather extreme cold in the forecast, I did a comparison between the latest GEFS 850mb temperature forecast and the minimum that has been observed in recent decades, based on ERA5 data (1950-present). It turns out that the predicted 850mb temperatures over the southeastern interior have not occurred since before 2000 (light blue shading in the figure below), and in a few spots not since before 1979 (medium blue shading).
Of course, the comparison may be hampered by systematic bias between the GEFS and ERA5 temperatures, especially over or near high terrain, so we'll have to wait a few days to get the self-consistent ERA5 analysis after the event.
Here's an animation through Tuesday morning.

