Following up on the climate of cloud cover in Alaska - in response to a reader's question - I created some maps to illustrate the relationship between the large-scale weather patterns and cloud cover. I'm relying on the gridded ERA5 reanalysis data for its ease of use, and I make no claims about accuracy, but it's considered a state-of-the-art system that should be suitable for this kind of broad-brush analysis.
With Alaska being a big place and having tremendously different cloud climates across the state, I extracted the ERA5 cloud cover data for the NOAA/NCEI climate divisions (shown below); this allows us to look at the different regions separately.
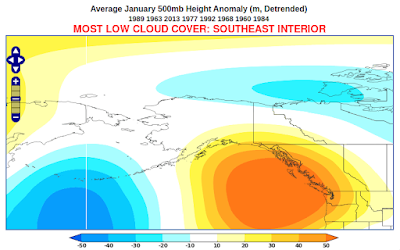
For example, here's the 500mb height pattern that tends to give the cloudiest conditions for the Southeast Interior region in January. This is simply a map of the average departure from normal of January 500mb height in the 8 years since 1950 that had the highest January cloud cover.
For those who are not familiar, the 500mb height is equivalent to the pressure at middle levels of the atmosphere, so relatively high heights represent a mid-level high pressure system (a "ridge"), whereas low heights correspond to a low pressure system (a "trough"). Alternatively we could look at sea-level pressure maps, but I find the 500mb height maps usually show more coherent patterns.
In this example, the map is telling us that a stronger-than-normal trough over the Aleutians and a stronger-than-normal ridge over British Columbia is a favorable combination for high cloudiness in the southeast interior of Alaska in January. With a tendency for counter-clockwise circulation around the trough, and clockwise around the ridge, this pattern tends to bring warm, moist, and therefore cloudy air up from the south into interior Alaska. The pattern also reflects a jet stream that is directed into Alaska from the southwest, importing lots of Pacific cloud.
The years with the least January cloud cover tend to have a flow pattern that is nearly opposite, with a trough over British Columbia and a ridge from the Aleutians northward into the Arctic. The associated circulation brings cold, dry, and therefore relatively cloudless air down from the Arctic into the southeast interior.
The cloud cover variations are not just about humidity, however. It's important to note that the circulation also generates patterns of rising or sinking air that generate or suppress cloud cover respectively. In the "least cloud cover" example above, the ridge produces sinking air to its east, which lowers the relative humidity of the air and suppresses cloud cover over eastern Alaska.
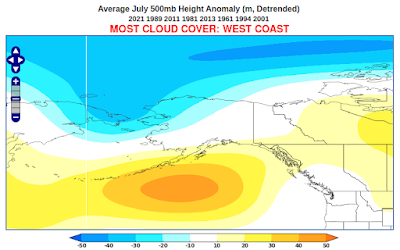
The map below shows the 500mb height pattern for above-normal cloud cover in July in the Southeast Interior division. It's interesting to see that the cloud-producing trough is much farther north than in the winter. In summer, the southeast interior sees its cloudiest weather with strong westerly flow and frequent rainy disturbances, whereas cloud in the winter is more about the orientation of the jet stream over the North Pacific.
As for low cloud cover in July, it's commonly associated with high pressure centered to the north, producing a tendency for dry, easterly flow from Canada into Alaska; and the ridge of high pressure itself suppresses cloud and rain. This would be not only a very sunny pattern, but a very dry one.
Let's look at some other regions. The results are quite similar for the West Coast climate division as for the Southeast Interior - see below. The main differences are that the winter high-cloud pattern tends to involve a trough extending farther north into the Chukchi Sea, and in summer high cloud cover is associated with a Chukchi Sea trough rather than a broad trough over northern Alaska.
How about the North Slope climate division? Not surprisingly, the winter circulation signals are shifted farther north again. But unlike in the regions farther south, low cloud cover in winter is associated with a ridge to the north rather than a ridge to the west. It's also interesting to note that the winter and summer low-cloud-cover patterns are similar to each other for the North Slope; and the summer "most cloudy" pattern is nearly the same as that for the Southeast Interior, although only 2 of the 8 cloudiest years respectively are the same.
And one more, results for the Central Panhandle:
The winter patterns are akin to those in the other regions, but summer cloud cover variations are more closely linked to the height pattern in the local vicinity - over and just to the west of the Panhandle - than for other regions. Clearly the spatial scale of the mid-atmosphere flow anomalies is smaller in association with summer cloud than for winter cloud, and while this is also true for the other regions, it seems most notable for the Panhandle.
Finally, it's worth remembering that these patterns are focused on the ERA5 total cloud cover, which includes cloud at any height above ground. The data set also includes cloud at low, medium, and high levels, and of course these are all influenced differently by the circulation anomalies.
Just as one example, here are the January patterns that typically produce the least cloud at low levels (below about 2km above ground) and high levels (above about 6km) respectively for the Southeast Interior. According to ERA5, the Bering Sea ridge that we noted before is more associated with reduced high cloud than reduced low cloud.
There are equally significant differences in the summer "least cloud" patterns for low versus high levels of the atmosphere:
But interestingly the cloudy-sky patterns are much more similar to each other for low and high clouds, in both summer and winter. I suppose that the cloudiest weeks and months tend to be cloudy at all levels of the atmosphere, owing to unusually disturbed weather, whereas it's quite possible to have low-level clear skies marred by high cloud, or vice versa. This is just for the Southeast Interior, however.
If anyone is interested in acquiring the ERA5 monthly cloud data, I'd be happy to pass it on. And if there are any suggestions for further analysis, feel free to leave them in the comments.


