Deep Cold started off in 2010 as a way that I could share Interior and northern Alaska weather and climate factiods and analyses with friends and colleagues without clogging up their email inboxes.
As anyone who has read the blog can plainly see, I never get into
second order attribution of events. I have done a few posts on climate variability,
mostly in regard to PDO, which, being nothing more than a way to
characterize North Pacific sea surface temperature anomaly patterns, is
an important factor in Alaska (south of the Brooks Range) decadal-scale climate.
Readership has always been tiny. The blog received enough comments to know that a few folks had found the blog useful. Typical page views were in the 15 to 45 range. This is so tiny that I wound up using the blog as a place to "store" graphics, typically plots of some data or another, so that I could get to them regardless of where I was at or what computer I was on, suspecting that they would be of minimal interest to anyone else.
As my personal circumstances changed, I had less time for posting, and after some thought, I invited a couple of folks to contribute to Deep Cold who are very knowledge about high latitude weather and climate and have insights and analytical skills complimentary to my own. As a result, the blog now has more frequent posts and more the content is "beefier". And the small readership seemed to agree.
So it was with great dismay that a well known political website picked up a short post on record low temperatures over the weekend. In three days this blog had nearly a quarter million page views, more
than five times the total in the previous three years combined.
More importantly, the record cold post was swamped with comments that had nothing to do with Alaska weather and climate. Personal attacks on politicians have nothing to do with Alaska weather and climate and are not welcome here, nor is this a blog about climate change. A as a result I turned off comments. There are a myriad of websites that cater to those. This is not one of them.
I'm interested in Alaska weather and climate and I'm interested in having a blog that addresses that. It would be nice if a few of the quarter million visitors stick around because they are interested in the same things, but this is not the place for political arguments. If you're interested in Alaska weather and climate for its own sake, then thanks for visiting Deep Cold.
Friday, September 6, 2013
Thursday, September 5, 2013
Temperature Parity for Alaska's Largest Cities
Looking at the 1981-2010 climate normals, September 5th (today) is the day when the normal daily temperature for Juneau is identical to the normal daily temperature for Anchorage. Those temperatures are slightly warmer than the normal temperature for Fairbanks. It turns out that August 17th/18th is the date when the three cities are closest together in terms of their normal daily temperature. Again, this is strictly an assessment of the NCDC climate normals.


If we go back and look at the actual temperatures for these three cities since 1945, the same basic pattern appears; i.e., May and August are relatively similar for all three cities.
The first chart below shows the percentage of days when each city had the warmest daily average temperature. As you would expect, Fairbanks leads the way during the summer months and Juneau during the winter months. The second chart looks at the percentage of days when each city had the coldest daily average temperature. This time, Fairbanks dominates the winter months but all three cities have relatively similar values in the early summer months. The table at the bottom shows an example of how the numbers were calculated. (Note: between 1945 and 2012, there were 14 days when all three cities had identical daily average temperatures)


Tuesday, September 3, 2013
Southwest Alaska Heavy Rainfall
** Updated with 3-day total for Aniak. **
A truly remarkable rain event has unfolded in Southwest Alaska over the last several days. Both McGrath and Aniak have received 2-day rainfalls with recurrence intervals of greater than 10-years. Aniak's total of 2.41" is their 8th largest 2-day precipitation value and McGrath's 2.12" is their 4th largest 2-day value. At Togiak, 3.35" was recorded during the same 2-day period – including an amazing 1.50" in three hours. Unfortunately there is no GHCN database for Togiak to determine where this falls in the historical record.


Below is the storm total precipitation radar image for 8/31/13 through 9/2/2013.

A truly remarkable rain event has unfolded in Southwest Alaska over the last several days. Both McGrath and Aniak have received 2-day rainfalls with recurrence intervals of greater than 10-years. Aniak's total of 2.41" is their 8th largest 2-day precipitation value and McGrath's 2.12" is their 4th largest 2-day value. At Togiak, 3.35" was recorded during the same 2-day period – including an amazing 1.50" in three hours. Unfortunately there is no GHCN database for Togiak to determine where this falls in the historical record.

** Update: With 1.01" on 9/3, the 3-day total at Aniak is now the third greatest on record and the second greatest non-repeating event (see below).

Below is the storm total precipitation radar image for 8/31/13 through 9/2/2013.

Monday, September 2, 2013
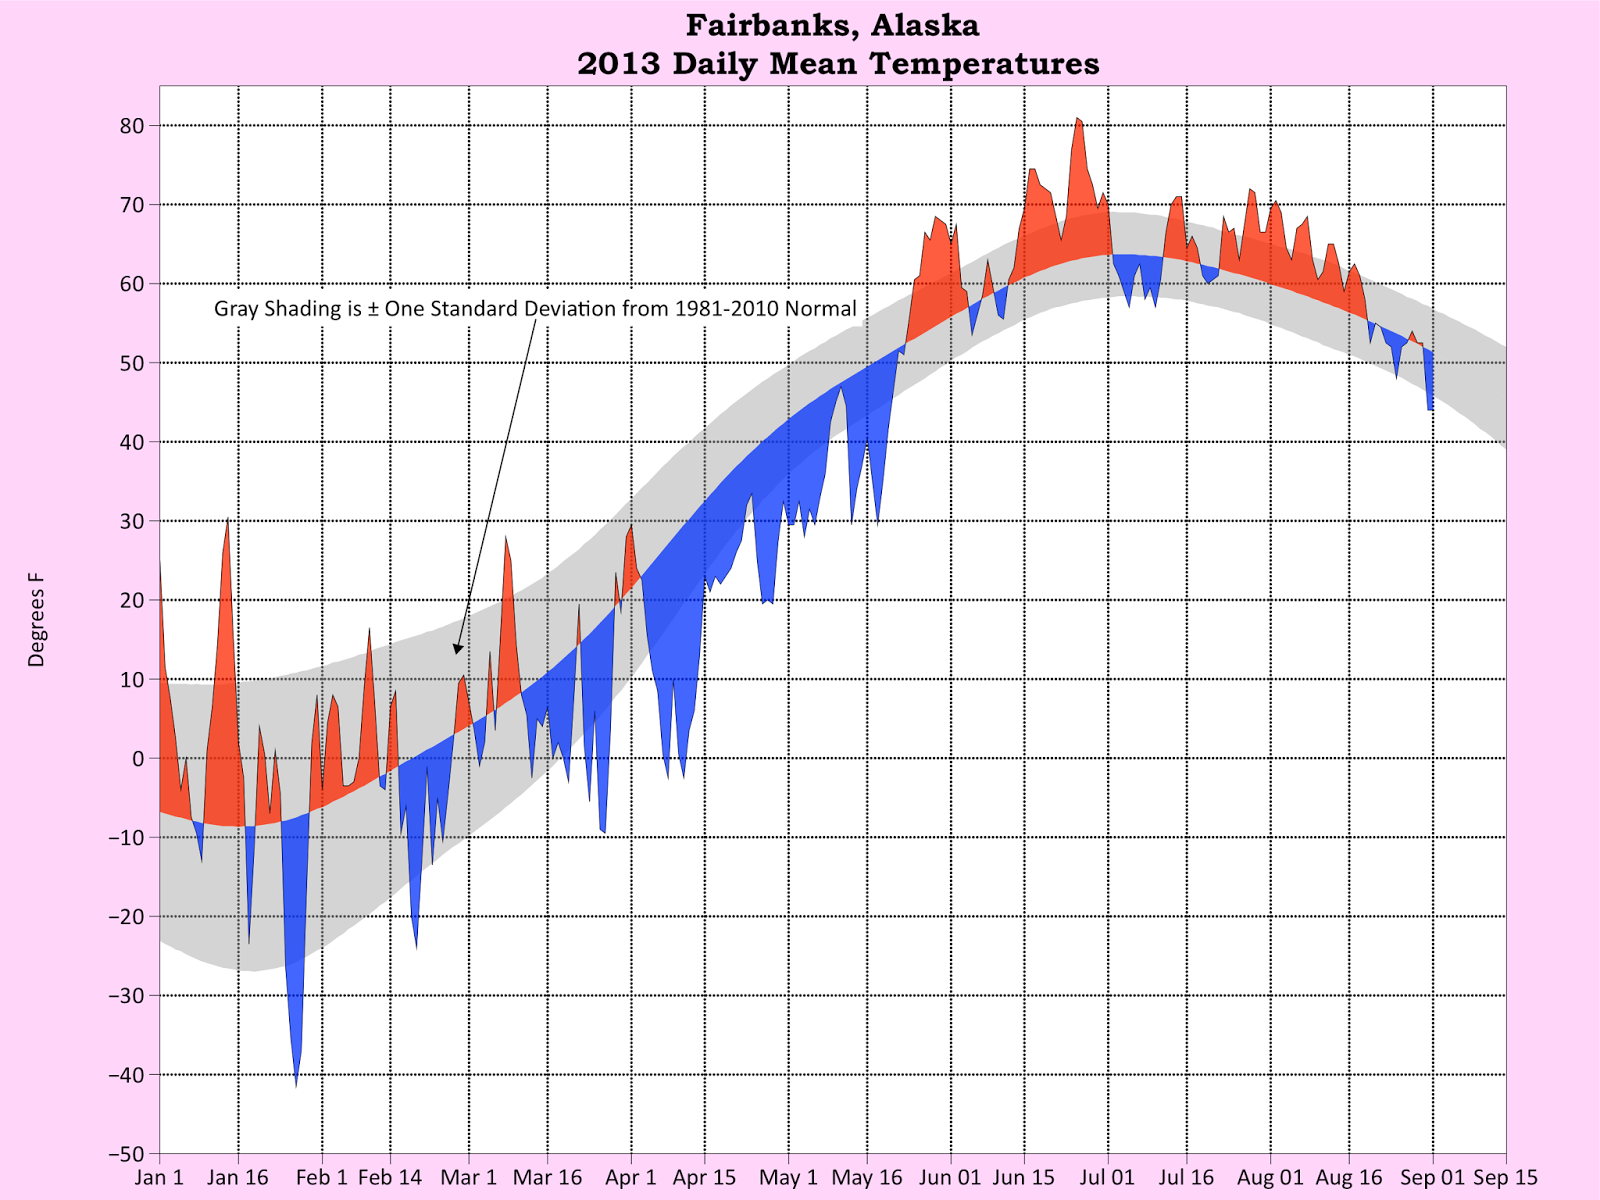
Fairbanks Temperatures Update
Here's update on Fairbanks temperatures, coming off our the mild August. The end of the hot summer, in retrospect August 18th, shows up nicely in this plot of mean daily temperatures.
 However, even though it's felt like a dramatic cool down, it's obviously been much more of a case of reversion to near normal after a hot three months.
Summer 2013 850mb Temperatures
A useful measure for estimating surface temperatures is to look at the temperature a little above the ground. The 850mb geopotential height temperature (approximately 5,000') is commonly used to extrapolate the temperature down to surface level. While many charts and tables will be generated to display the surface temperatures for 2013, I thought it would be interesting to look at the temperatures at 850mb and where they rank in comparison to other summers.
The first chart below shows the summer temperature anomaly from the NCEP/NCAR reanalysis. The bull's eye for greatest difference from normal is just north of Yakutat along the Yukon border.


Finally, here is a picture from the top of South Suicide Peak (5,005') near Anchorage on one of the very warm 850mb temperature days. The pressure level was 851mb and the temp was 18C (64.4F). It is not exactly a free-air temperature but it was very, very warm.


The next map show the actual upper air sounding temperatures for the months of June, July, and August at the 14 sounding locations for Alaska. The overall summer ranking is shown for each station. Only Kodiak recorded their warmest summer at the 850mb level. Every other station was in the top 10. Again, not really a surprise given the surface temperatures were in the top 10.

On June 18th, Anchorage set an all-time record for the warmest 850mb temperature with a reading of 18.4C. No other station set their all-time 850mb temperature record but several came close. The 17.4C in Bethel and 17.2 in McGrath (both on June 19th) were the second highest 850mb temps for each station.

Finally, here is a picture from the top of South Suicide Peak (5,005') near Anchorage on one of the very warm 850mb temperature days. The pressure level was 851mb and the temp was 18C (64.4F). It is not exactly a free-air temperature but it was very, very warm.

Saturday, August 31, 2013
Summer Temperature Summary (Fairbanks & Anchorage)
** Updated to answer reader Gary's question **
Climatological summer ends today in the northern hemisphere. Fairbanks ended the summer with their second warmest average temperature on record. They finished with average temperature of 63.5F. This is a full degree below the record summer of 2004. In fact, most 1st order stations in Alaska recorded their warmest summer in 2004 (forthcoming post). Here is the list of top 5 warmest summers for both Fairbanks and Anchorage:


Climatological summer ends today in the northern hemisphere. Fairbanks ended the summer with their second warmest average temperature on record. They finished with average temperature of 63.5F. This is a full degree below the record summer of 2004. In fact, most 1st order stations in Alaska recorded their warmest summer in 2004 (forthcoming post). Here is the list of top 5 warmest summers for both Fairbanks and Anchorage:
Fairbanks:
1) 64.5 (2004)
2) 63.5 (2013)
3) 62.6 (1975)
4) 62.3 (1988)
5) 62.3 (1990)
Normal: 59.7 (1981-2010)
Anchorage:
1) 60.5 (2004)
2) 60.2 (1977)
3) 59.4 (1936)
4) 59.2 (2013)
5) 58.9 (2001)
Normal: 57.0 (1981-2010)

As for precipitation, Anchorage recorded its 19th wettest summer since 1917 (5th wettest August) and Fairbanks recorded their 78th wettest summer since 1920 (17th driest).
---Updated Comment---
The warmest 92 day period of record in Fairbanks is 65.0F May 24-Aug 23, 2004. This year the warmest 92 day period was also May 24-Aug 23, with an average of 64.6F, which is second only to 2004.
For Anchorage, the warmest 92 day period of record is also in 2004, with an average temperature June 3-Sept 2 of 60.5. This year the warmest 92 days was May 27 through Aug 26th, with an average of 59.4F
------------------
Does this year's warm summer portend for a cold or warm winter in Fairbanks? Looking at the climate record since 1920, there is no predictive value in estimating what this coming winter's temperatures will be. The following scatterplot shows the summer temperature (y-axis) and the following winter's temperature (x-axis). For this exercise, I defined winter as November through March.

Record Cold in the Northern Interior
 |
| Photo Courtesy of the FAA |
A cold airmass and clear skies allowed for temperatures to plunge to record low levels in the northern Interior.
Most notably, Bettles recorded a low of 15ºF Saturday morning. This is by far the lowest temperature of record at Bettles in August. The previous record at the Bettles in August was 22ºF on August 30, 1969. At old Bettles, about four miles downriver from the current townsite, a low of 20ºF was measured on August 24, 1948.
Other low temperatures included 17ºF at both Chandalar DOT and Coldfoot DOT and a chilly 13F at the Norutak Lake RAWS west of Bettles. These are close to, but not at the record low temperature for the month of August in the state.
Barrow 500 mb Temperature
*** 9/2/13 Update: Long-term 850mb and 500mb temperature chart for August was added at the bottom. Note that while the 8/31 500mb temperature was extremely low, it is just one observation in a data series dating to 1948. The 850 mb, and 700 mb, and surface temperatures have all trended upward in Barrow since the upper air sounding program was established in Barrow in 1948. ***
The 500 mb temperature in Barrow yesterday was -37.5C at the 0Z upper air sounding. This is the second lowest August 500 mb temperature on record for that station (1948-2013). The table below shows the coldest August 500 mb temperatures on record for Barrow. The charts at the bottom shows the average annual August 500 mb (and 850 mb & surface) temperature for Barrow.


The 500 mb temperature in Barrow yesterday was -37.5C at the 0Z upper air sounding. This is the second lowest August 500 mb temperature on record for that station (1948-2013). The table below shows the coldest August 500 mb temperatures on record for Barrow. The charts at the bottom shows the average annual August 500 mb (and 850 mb & surface) temperature for Barrow.


Friday, August 30, 2013
First Snow Climatology
August 29th is the anniversary of the earliest snow on record for Fairbanks. On 8/29/1922, 3.0" of snow was recorded. This is the only instance of an August snow event. The second earliest snow occurred on September 2nd, 1980, when 1.6" fell. The normal first measurable snow falls on September 29th. The latest first snow on record was back in 1918 when no snow was measured until October 31st. A close second place was 1969 when the first snow waited until October 29th. Snowfall records began in Fairbanks in 1914. The normal first snowfall is September 30th. As for snowpack, that typically sets in about two weeks after the first snowfall (October 15th). The earliest winter snowpack was established on September 13th in 1992 and the latest was on November 11th in 1962. (Note: the date of onset was identified by the first date when the snow depth existed for at least 21 consecutive days.)


Thursday, August 29, 2013
Precipitation Percentages
As the rain continues to fall in Anchorage, it seems like a good time to take stock of the amount of rain falling withing discrete intervals. Not surprisingly, when looking at the historical record, small precipitation values are more common than large values. For Fairbanks, 31% of days that have measurable precipitation have a total of either 0.01" or 0.02" (note: this includes melted snow). In 2013, 24% of "wet" days (through 8/28) ended with a grand total of 0.01" or 0.02". Those numbers are pretty close to one another. What really stands out is the large percentage of high precipitation days for Anchorage and the low number of days for Fairbanks. Fairbanks has had 1 day with 0.26" to 0.50" and 3 days with over 0.50". Anchorage has had 18 days with 0.26" to 0.50" and 4 days with over 0.50".

The first chart only looked at the count of days represented in each category. The second chart looks at the percentage of the annual precipitation that fell in each of 6 different categories (note: the categories are slightly different between the two charts). Since Fairbanks is far behind in annual precipitation so far in 2013, the three days with over 0.50" of precipitation represent 1/3 of the annual total. Other than those three wet days, the annual deficit is very noticeable in the 0.21" to 0.30", 0.31" to 0.50", and the over 1.00" categories. On the other side of the ledger, Anchorage is running behind in terms of total precipitation in the smaller categories but more than makes up for it in the wetter categories.


The first chart only looked at the count of days represented in each category. The second chart looks at the percentage of the annual precipitation that fell in each of 6 different categories (note: the categories are slightly different between the two charts). Since Fairbanks is far behind in annual precipitation so far in 2013, the three days with over 0.50" of precipitation represent 1/3 of the annual total. Other than those three wet days, the annual deficit is very noticeable in the 0.21" to 0.30", 0.31" to 0.50", and the over 1.00" categories. On the other side of the ledger, Anchorage is running behind in terms of total precipitation in the smaller categories but more than makes up for it in the wetter categories.

Tuesday, August 27, 2013
Solar Angle or Length of Day?
In response to my last post about diminishing solar insolation, readers Gary and Mike suggested that the rapid late summer decline in available solar radiation has more to do with the decreasing angle of the sun above the horizon than the decreasing length of day. It is an interesting question as to which of these effects is more significant in reducing the available solar energy as the season advances. Is the pronounced loss of solar insolation at this time of year mainly caused by the sun being lower in the sky and thus "weaker", or is the shortening of the day mainly responsible?

The first thing to notice is that the solar angle is clearly the only factor at play in the high Arctic (say above 80 °N), where the first sunset of autumn is only now approaching. With the sun continuously above the horizon until now, length of day is not an issue; the rapid decline in solar insolation is ALL caused by lower sun angle. This fact also suggests that solar angle may be the most significant part of the equation at other less extreme northern latitudes, such as Fairbanks.
To take a closer look at the problem, I used the theoretical minute-by-minute solar insolation calculation to determine the loss of incoming radiation caused only by the shortening of the day. This is simply the amount of radiation received on June 21 during sunlight hours that no longer exist on subsequent dates. For example, on August 1 in Fairbanks the length of day is over 3 hours shorter than on June 21, so we can say that the shortening of the day caused the loss of the radiation in those 3+ hours. The chart below shows the accumulation of this loss with the red markers. The green markers show the total percentage loss of insolation since the solstice (note the 63% value on September 22 matches the results in my prior post). Finally, the blue markers show the difference, which we can call the loss from decreasing solar angle.

Based on these results, the answer is clear: decreasing solar elevation angle is a much bigger contributor to the total late summer decline in solar insolation. The shortening of the day becomes a significant factor as the autumn advances, but the elevation angle is the dominant player. Kudos to Gary and Mike for intuitively recognizing this, and for helping to clarify my thinking.
Monday, August 26, 2013
Fall Freeze Dates
Today is the 238th days of 2013. The typical date for the first freeze in Fairbanks is right around the corner. Since 1920, the average first freeze is on the 247th day of the year. During the 1981-2010 climate normal period, the average first freeze is on the 252nd day of the year. I use day of the year instead of a calendar date to account for Leap Years. Since the first freeze is frequently an anomalous event is the Fall, it is useful to look at the day of the 2nd, 3rd, 4th, and so on freezes. The first chart below shows the Julian Day for the 1st through 10th freezes in Fairbanks between 1920 and 2012. There is usually a 6-day gap between the 1st and 2nd freeze and a 10-day gap between the 1st and 3rd freeze. The second chart shows the same information for Anchorage. Winter, if you define it by freezing temperatures, clearly arrives in Fairbanks a full two weeks earlier than in Anchorage.


Loss of Solar Insolation
Rick's post on Sunday highlighted the hard freeze that occurred Sunday morning at certain locations near Fairbanks and in the Upper Yukon valley (notably, 16 °F at the Beaver Creek RAWS). For those who are less familiar with Alaska climate, it is often surprising how rapidly temperatures begin to drop off in August, even while lower latitude locations are still baking in the heat of high summer.

The chart below partially explains why northern continental locations cool off so quickly. The chart shows the percent drop in daily incoming solar radiation ("insolation") compared to the annual maximum at the summer solstice, for latitudes between 30°N and the North Pole. Note that these are theoretical numbers assuming a clear sky (no clouds), no refraction, and no reduction in solar radiation from other factors like dust or haze. I've plotted the data for two dates in the autumn: August 25 (blue line) and September 22 (the autumn equinox, red line).
By August 25, the maximum possible daily solar radiation has dropped by more than 35 percent in Fairbanks compared to late June, largely because of the shortened day. In Barrow, at over 71 °N, more than 45 percent of the sun's daily energy is lost (although of course it's rarely sunny in Barrow at this time of year). By contrast, in southern regions of the lower 48, the daily radiation has dropped only 10-15 percent by late August, which is barely perceptible to most people: the sun maintains nearly all of its summer strength.
Looking ahead to the autumn equinox, when day and night are of equal length across the globe, Fairbanks will have lost over 60 percent of its peak daily insolation, and the high Arctic will approach the long night of winter.

Sunday, August 25, 2013
Precipitation Rankings
After some particularly heavy rainfall events at Keystone Ridge were relayed to me this week, I decided to look at the top 10 precipitation events for some of the major stations in Alaska (and Keystone Ridge). For each primary station, the period of record in 1953 to 2012. This period was chosen due to the consistency of the climate record at all stations. For Keystone Ridge, the period of record used in the analysis is 1996-2012. Here is an example on how to read the table. In Bethel, the 5th wettest day in each year between 1953 and 2013 saw an average of 0.51" of rain or melted snow; in Juneau, the 8th wettest day for each of those years saw an average of 1.00" of rain or melted snow; and so on. The 1.25" that fell on Keystone Ridge on August 19th is greater than the mean annual greatest event. For Anchorage, the 1.23" that fell on August 11th is also greater than the mean annual greatest event. Note that these are all single calendar day events and not 24-hour events.


A slightly different technique is to look at precipitation percentiles. If the top 10% of precipitation events are compared to the bottom 90% of events, a modest relationship between climate regime and precipitation concentration is evident. Stations in Southeast Alaska receive under 40% of their annual precipitation from the wettest 10% of days. The percentage increases with both latitude and longitude. I expected the pattern to be much more pronounced than it actually was. A study looking at Canadian heavy precipitation events had more dramatic geographical and temporal patterns. That study was the inspiration for this analysis. (Note: this table uses top 10% instead of top 10 events because the total number of events varies dramatically across the state.)


Finally, here is a temporal chart of the proportion of precipitation that falls during the heaviest 10% of events for the three largest cities in Alaska. A temporal pattern is difficult to ascertain.

Final note: When looking at data for all stations, the volume of missing data (and missing years) made a comprehensive analysis nearly impossible. Perhaps that would be a good grant-funded project.
Frost on the Pumpkin
 |
| Courtesy of Alaska Climate Research Center |
Some low temperatures include:
Goldstream Creek: 23F
Woodsmoke: 26F (near North Pole)
Eielson AFB: 27F
Two Rivers: 28F
UAF West Ridge: 29F
Fort Wainwright: 32F
Fairbanks Airport: 34F
In the hills temperatures mostly remained above freezing, and a breeze most of the night kept frost from forming at ground level, at least here at Keystone Ridge:
Fox CRN: 33F
Caribou Peak: 33F
Wickersham Dome: 34F
Cleary Summit: 34F
Keystone Ridge 36F
Nenana Hills: 38F
A few low temperatures in the teens were observed in the Upper Yukon Valley, including 19F at Chena Hot Springs and 16F at the Beaver Creek RAWS (west of Birch Creek village).
Wet Week in Fairbanks
In the past week, Fairbanks airport received 1.54" of rain, the highest weekly precipitation total since late July 2010. The long-term history tells us that Fairbanks sees a week this wet (or wetter) about once every other year, on average.

The year-to-date precipitation chart below shows that approximately half of the summer precipitation deficit has been made up with the recent change to wet weather.

Saturday, August 24, 2013
A Little Below Normal in Fairbanks
Here's an update on daily temperature anomalies in Fairbanks. Although it's cooled off quite a bit in the past week, as the plot below shows it's only cooled to close to normal: every day between July 22 and August 20th had a daily mean temperature at or above normal.
 The 5-day running mean standardized anomaly plot really highlights just how unusually warm it's been and how "normal" it is now:
 There is a frost advisory in effect for Saturday night and Sunday morning for low-lying areas, but again this is perfectly typical for the last week of August.


Friday, August 23, 2013
Implications of a Warm Dry Summer
The very warm, dry summer that occurred this year in interior Alaska raises the question of whether similar tendencies are likely to persist in the months ahead - in other words, is warmer and drier than normal weather likely to continue on average?


One way to explore this question is to look at previous years in which the summer was warm and dry, and then examine what happened in the subsequent months. This is a kind of analog technique in which we explore the historical data to see if there might be any predictability based on the observed anomalies. There are at least two possible reasons why we might hope for success: it's possible that whatever caused the summer warmth might continue to act as a consistent forcing through the next few months; or perhaps the sea surface temperature patterns that have emerged over the summer near Alaska might help nudge the autumn climate in one direction or another.
I chose to base the investigation (at least initially) on Fairbanks temperature and precipitation between June 1 and August 15, which this year were the 2nd highest and 4th lowest on record, respectively (since 1930). I picked out all years since 1930 which had June 1 - August 15 temperature in the top 25% of all years AND June 1 - August 15 precipitation in the bottom 25% of all years; this provides 11 "analog years". The summer was significantly warmer and drier than normal in all these years.
I then pulled out the temperature and precipitation data from the subsequent months in these years and classified each month as "below normal", "near normal", or "above normal", based on an equal division of the data in the 1951-2010 period. The chart below shows the results for September, for Barrow, Fairbanks, and Anchorage; the colors indicate the number of years out of 11 that fell into each category. So for example, Fairbanks September temperature was above normal in 3 of the 11 years, near normal in 3 of 11, and below normal in the remaining 5 years. More significantly, September precipitation was below normal in 8 of the 11 years, suggesting that there is a good chance that September will be dry overall in Fairbanks (but see a cautionary note at the bottom).
The other major signal that emerges for September is at Barrow, where 7 of the 11 years were wetter than normal, and none of the 11 were drier than normal; thus Barrow seems quite likely to be wet.

The corresponding charts for October and November are shown below. Interestingly, all three locations show a preference for above normal temperatures in October (especially Barrow), and in November the warm signal becomes relatively strong for Anchorage.


Another way of looking at the patterns in the analog years is to examine some maps. The first map below shows the frequency of above normal 500 mb height in September; note that here I am simply comparing to the 1951-2010 mean rather than the three-way terciles (i.e. the map has no near-normal category). There seems to be a fairly clear-cut signal for low heights in the Chukchi Sea, and the second map below shows a tendency for low pressure along the North Slope; this would explain the high chance of a wet September in Barrow. It's not entirely clear why Fairbanks would be dry, unless perhaps the favored higher pressure over eastern Siberia means that the flow is more likely to be northwesterly (drier) rather than southwesterly (wetter) over interior Alaska.


The next three maps show the analog temperature pattern for September through November. These are based on the NCEP global reanalysis, and so the quality is probably "questionable" over Alaska; but the general trends should be approximately correct. In agreement with the charts above, we see a slight warm signal for the North Slope in September, more so for October, and then a rather notable warm signal for most of southern Alaska in November.


So to answer the original question: based solely on the history of past warm/dry summers, it seems likely that unusually dry weather will re-emerge in September in Fairbanks, but there's no indication that September will be unusually warm. In fact, there is a slight signal that early autumn will be cooler than average. For example, in Fairbanks 8 of the 11 analog years first reached 25 °F earlier than usual, and 7 of the 11 years saw the first half-inch or greater snowfall earlier than usual. In October and November, the summer analog suggests warmer than average temperatures as the most likely outcome, especially for southern Alaska in November. One caveat here is that a negative PDO (Pacific Decadal Oscillation) phase, as we're currently seeing, would favor a cold November in the south, so that raises the level of uncertainty for the November outcome.
** Note: forecasts for many weeks or months in advance are rife with uncertainty, and analog indications like these usually give only a hint of where the probabilities may favor one side of the climate distribution or the other. We have to bear in mind that random chance alone can produce patterns and apparent signals in the data, so some of what we see here may be a statistical fluke. To be precise, when we randomly select any 11 years and categorize the data into terciles, there is about a 37% chance that 6 or more of the years will fall into one of the categories, leaving 5 or fewer years in the other two categories. The chance of 7 or more years in one category is about 12%, and the chance of 8 or more is 2.6%. So when we see 6 of 11 years in the warm category for Fairbanks in October, there is only a 63% chance that this is a "real" signal, not random chance.
Thursday, August 22, 2013
Light Frost
It's a frosty morning at northern interior locations; the new FAA webcam at Allakaket (see below) shows mist and what looks like frost.
Bettles and Eagle both dipped below freezing for the first time this autumn; this is very close to the median date for Eagle, and just a few days earlier than normal for Bettles.

Bettles and Eagle both dipped below freezing for the first time this autumn; this is very close to the median date for Eagle, and just a few days earlier than normal for Bettles.

Wednesday, August 21, 2013
Autumnal Air
Snow fell in the Brooks Range yesterday as cooler air worked its way down from the Arctic, and temperatures this morning are close to freezing at a number of interior locations farther north than Fairbanks.
At Barrow, the mean temperature yesterday was 32 °F, the first time this has happened since late June; 55 consecutive days had a mean temperature above freezing. The chart below shows the annual (maximum) number of consecutive days with mean temperature above freezing in Barrow for each year since 1930. This year's maximum of 55 days is lower than in some recent years, when the mean temperature did not dip to freezing until mid or even late September, but is higher than the long-term median.

At Barrow, the mean temperature yesterday was 32 °F, the first time this has happened since late June; 55 consecutive days had a mean temperature above freezing. The chart below shows the annual (maximum) number of consecutive days with mean temperature above freezing in Barrow for each year since 1930. This year's maximum of 55 days is lower than in some recent years, when the mean temperature did not dip to freezing until mid or even late September, but is higher than the long-term median.

Subscribe to:
Posts (Atom)