Thursday, May 15, 2014

Last Freeze in Fairbanks

Today, May 15th, is the average date for the last freeze at the Fairbanks International Airport using data from 1981 to 2013. If we look at the entire station history for the Airport, the average last date is May 16th. The low today in Fairbanks was above freezing and the 7-day forecast calls for above freezing low temperatures on every day. Therefore, it is entirely possible that the 31°F reading from yesterday (May 14th) will go down as the last freeze for the 2013-2014 winter. While this is almost average, it turns out that the number of sub-freezing days this winter was far less than average. In fact, only 211 days recorded temperatures below freezing. The 210 days in the winter of 1982-1983 is the only season since 1948-1949 with fewer freezing days. Figure 1 shows the annual last freeze date and the total number of freezing days.


Figure 1. Last freeze and number of freezes at the Fairbanks International Airport (1948-2014). The 2014 days is through May 15th.

A better metric for measuring freezing conditions, and energy usage, is freezing degree days (FDD). Much like heating degree days and cooling degree days, freezing degree days measure the accumulated degrees below freezing over the course of the season. Figure 2 shows the annual number of freezing degree days for the Fairbanks International Airport.


Figure 2. Annual freezing degree days (FDD) at the Fairbanks International Airport (1948-2014). The 2014 days is through May 15th.

Finally, the date for the final freeze at the Fairbanks International Airport is not especially representative of the area. In fact, with the exception of Eielson Field, every station around Fairbanks has a later last freeze of the season. Figure 3 shows the date of the average last freeze around Fairbanks and Figure 4 is a map of Alaska showing the average last freeze date.


Figure 3. Average date of last freeze in the greater Fairbanks area. All stations in the GHCN (v3) database with at least 10 complete years of temperature data since 1981 were used.

Figure 4. Average date of last freeze across Alaska. All stations in the GHCN (v3) database with at least 10 complete years of temperature data since 1981 were used.

Wednesday, May 14, 2014

Still Wintry in Nome

Spring in Nome is always slow to arrive, and the weather in Nome has been characteristically miserable lately.  Measurable snow has fallen on five days this month, for a total of 2.3 inches, and temperatures have been hovering near freezing most days.  This is only a little unusual: snow is usually observed in Nome in May, and at least an inch falls in about half of all years.  Last year there were 11 days of snowfall in May with a record-high total of 10.8 inches.

Somewhat more unusual is the recent magnitude of the temperature difference between Nome and Fairbanks; while Nome has been cooler than normal, Fairbanks has been warmer than normal, and the difference has been particularly pronounced for daily maximum temperatures.  The chart below shows the difference in maximum temperatures since January 1 compared to the climatological normal difference, which rises dramatically in spring as the interior warms up relative to the coast.  At the end of April the climatological difference peaks at nearly 20 °F; this year since May 1 the mean difference has been 27 °F, which is surprisingly a record for the month-to-date.


The mean temperature anomaly chart for Nome shows that unusual warmth has dominated most of the year so far, with the recent cool conditions being a relatively insignificant anomaly.


Saturday, May 10, 2014

Fairbanks vs Keystone Ridge Precipitation - Part II

The previous post on this topic illustrated some differences in precipitation climatology between the sheltered Fairbanks airport and the Keystone Ridge weather station; we saw that precipitation is both more frequent and more abundant in total on the ridge throughout the year.  This is to be expected given the elevation difference.  However, I also posed the question of whether the precipitation excess on the ridge is mainly caused by more frequent precipitation events or by heavier precipitation when it falls.  To look at this, we first need to calculate the mean precipitation per event, i.e. the mean daily precipitation excluding zero precipitation days.  This is shown in the chart below; we see that precipitation events are heavier on average at Keystone Ridge throughout the year, but the difference is very small in late winter and early spring, and interestingly also in mid- to late-July.


Using the mean precipitation per event, we can then examine some hypothetical situations to uncover the relative importance of frequency versus intensity.  For example, we can look at what would happen if the airport received precipitation as heavy as on the ridge, but with unchanged frequency.  Alternatively, we can look at the hypothetical outcome if the frequency at the airport were as high as the frequency on the hill, but with unchanged amounts per event.  The results of these two thought experiments are shown in the following chart.  The thin blue and red lines show the actual climatology for the two locations (as shown in the previous post).  The green line shows the result when we boost only the frequency at the airport, while the purple line shows what happens when we boost only the amount per event.

In general, we see that both the frequency difference and the intensity difference make a significant contribution to the overall difference in precipitation totals between the two locations.  However, there are some interesting variations in summer.  In mid- to late-July, the excess wetness at Keystone Ridge is dominated by increased frequency rather than increased intensity; however, on both sides of this period, and especially in August, the increased frequency is less important than the higher amounts falling on the ridge.  It is quite possible that some of these differences are due to sampling variability in the relatively short period of record; further investigation would be needed to examine the role of random sampling variations.

Finally, a ratio of the hypothetical precipitation excess from the two separate influences is shown in the chart below; higher values indicate times in the year when Keystone Ridge is wetter mostly because of heavier precipitation events, whereas low values show times in the year when the frequency difference dominates the total precipitation difference.


Thursday, May 8, 2014

Fairbanks vs Keystone Ridge Precipitation

Precipitation has been scarce for some time now in Fairbanks-land, but a couple of weeks ago the Keystone Ridge observer reported rain, snow, and snow pellet showers that brought a total of 0.15" of precipitation over two days.  Meanwhile the Fairbanks airport reported only a trace of precipitation; so this led me to wonder how the differences in precipitation between the two locations tend to change through the year.

First we can look at the mean monthly precipitation for the common period of record, 1997-2013; see the chart below.  Not surprisingly, Keystone Ridge picks up more precipitation in every month, with an annual excess of 51% (15.8" vs 10.5") compared to the airport.  However, the magnitude of the monthly differences is much larger in the warm and relatively wet season, both in absolute and percentage terms; almost three-quarters of the excess at Keystone Ridge occurs in May through September.  June and August are the months with the largest absolute difference in mean precipitation amount, but the largest percentage difference is in May, when Keystone Ridge typically receives more than twice as much precipitation as the airport.

The smoothed daily climatology of precipitation amounts is shown in the next chart, below.  An interesting feature here is the August peak in precipitation amounts for Keystone Ridge; the data from the airport do not show the same late-summer peak.  This difference is also suggested by the monthly chart above: precipitation peaks in July at the airport, but August is just as wet on the ridge (although with a pronounced drop-off by late month).

Thirdly, we can consider the mean frequency of measurable precipitation - see the chart below.  The frequency is also higher at Keystone Ridge throughout the year, but the relative differences in summer are not as great as for the total precipitation amounts.

Given these comparisons, we see that precipitation is both heavier and more frequent on Keystone Ridge throughout the year.  But which factor is more important for the annual precipitation totals?  Is the precipitation excess at Keystone Ridge caused mainly by more frequent precipitation events or by heavier precipitation when it falls - and how does this change through the year?  I'll look at this in a subsequent post.

Wednesday, May 7, 2014

Low Temperature Categories

This is a companion post to yesterday's discussion about High Temperature Categories.

Over the course of a year is Fairbanks more likely to have a low temperature in the 20°s, 30°s, or 40°s? Fairbanks actually has more days with low temperatures in the 40°s than any other 10° category.

To be included in this analysis a station was required to have at least 10 complete year's of data since 1981. In Alaska, Airport stations (USW) and Cooperative stations (USC) were evaluated. In the Lower 48, only Airport stations were looked at. A total of 88 stations in Alaska met the selection criteria.

Only 2 stations had more days with high temperatures in the 50°s than any other category – Anchorage's Merrill Field and Lake Hood. The lowest category is 'Below -19.' I suppose it would have been better to create 10° categories all the way down to the -70°s but that would have made for an awful lot of empty categories. Therefore, places on the North Slope that peaked in the Below -19 category would have a different peak category with the continuation of the groupings (see Collville Village in Figure 1).

Figure 1 shows a sample of low temperature distributions for five stations across Alaska. Figures 2 and 3 are maps that show the spatial distribution of the peak categories. Without question, 30°s and 40°s rule the State. As noted in the earlier paragraph, they should probably cover an even larger area than they do in Figure 2.


Figure 1. Table of tow temperature distributions for several stations is Alaska. Each station has a peak value in a different category.

Figure 2. Map showing the distribution of most frequent 10°F low temperature categories in Alaska. Note: No stations had peak values in the -10°s, -0°s, +0°s, or the 10°s but the interpolation algorithm assumes those categories exist.


Figure 3. Map showing the distribution of most frequent 10°F low temperature categories in the U.S..

Tuesday, May 6, 2014

High Temperature Categories

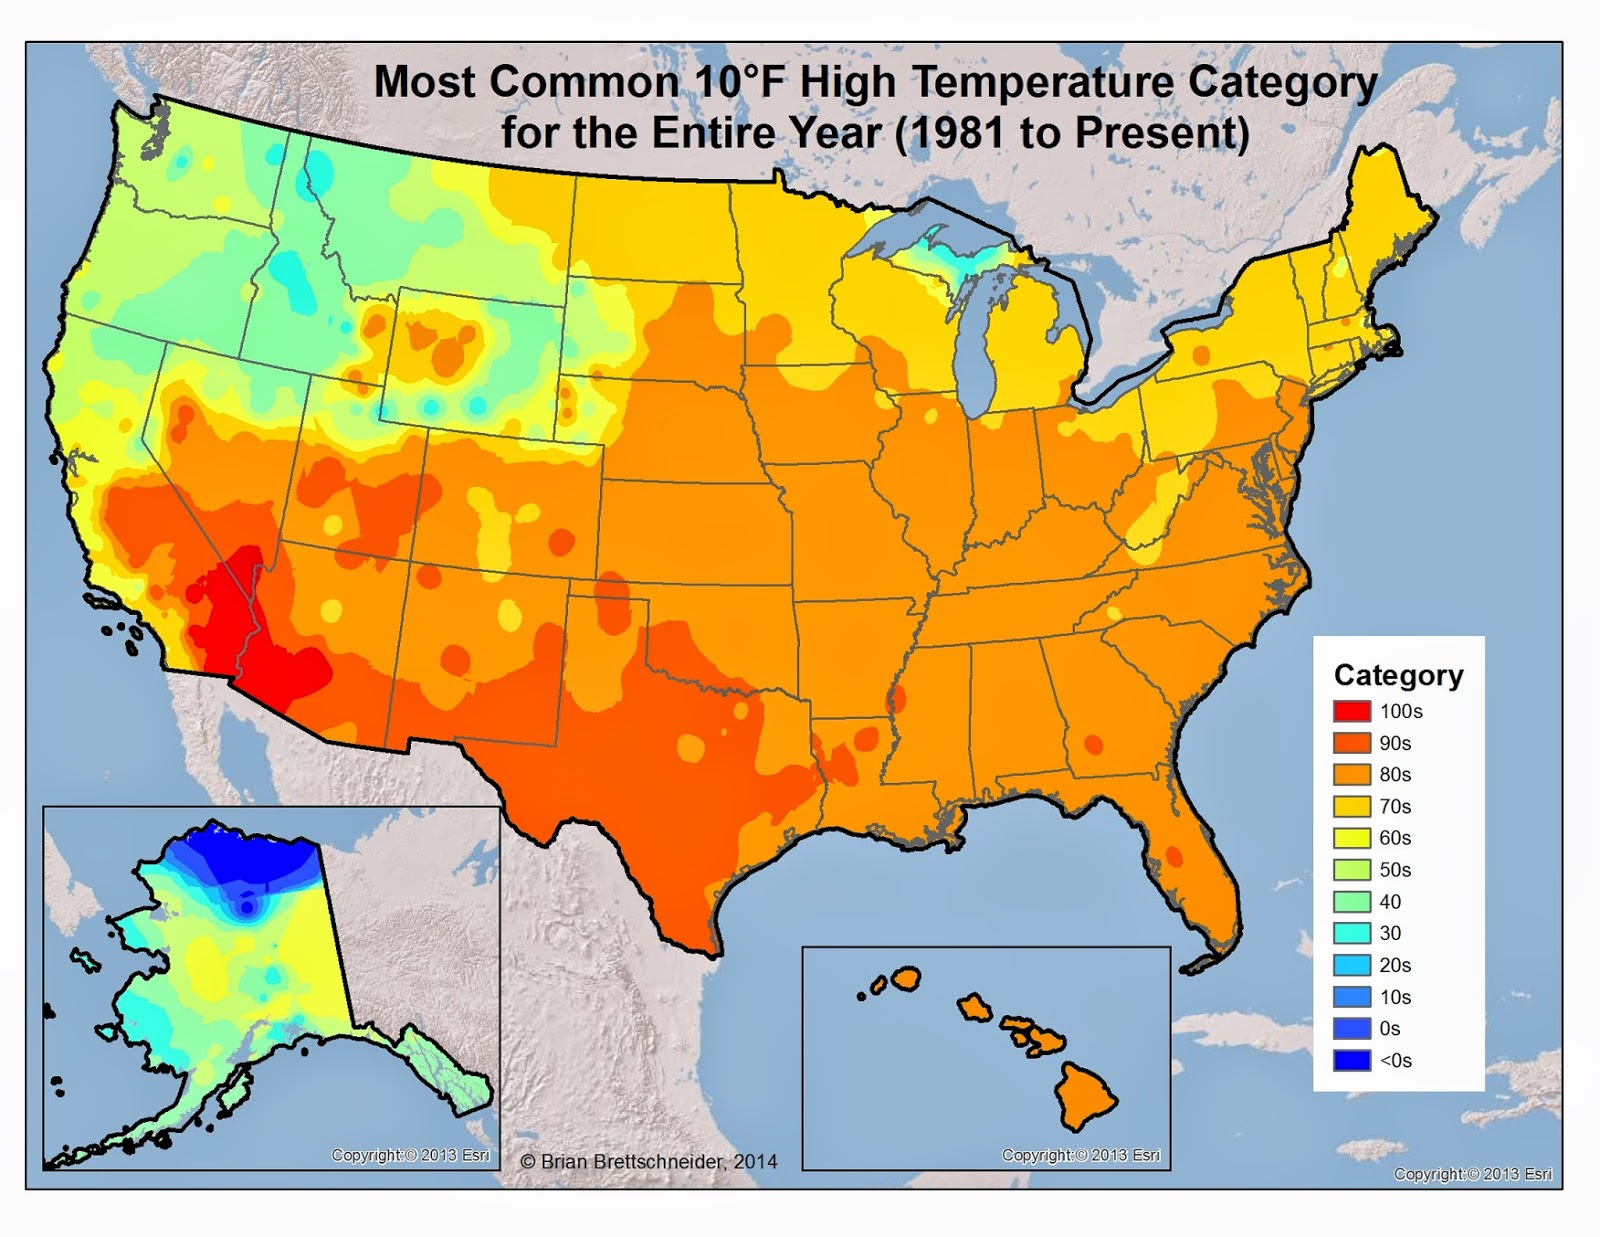
Over the course of a year is Fairbanks more likely to have a high temperature in the 30°s, 40°s, or 50°s? You might be surprised to hear that the answer is none of the above. Fairbanks actually has more days with high temperatures in the 60°s than any other 10° category. To be included in this analysis a station was required to have at least 10 complete year's of data since 1981. In Alaska, Airport stations (USW) and Cooperative stations (USC) were evaluated. In the Lower 48, only Airport stations were looked at.

Only 3 stations had more days with high temperatures below zero than any other category. No stations had a peak of days with high temperatures in the 0°s or 10°s. Only 1 station (in the entire country!) had more days with high temperatures in the 20°s than any other category. That station was Keystone Ridge, Alaska. Figure 1 shows a sample of high temperature distributions for six stations across Alaska. Figures 2 and 3 are maps that show the spatial distribution of the peak categories. 

I calculated the same information and made similar tables and maps for low temperature categories. Those will be the subject of another post.


Figure 1. Table of high temperature distributions for several stations is Alaska. Each station has a peak value in a different category.

Figure 2. Map showing the distribution of most frequent 10°F high temperature categories in Alaska. Note: No stations had peak values in the +0°s or to 10°s but the interpolation algorithm assumes those categories exist. Indeed, they must.

 Figure 3. Map showing the distribution of most frequent 10°F high temperature categories in the U.S..


Saturday, May 3, 2014

First 70°F Day in Fairbanks

Yesterday was the first 70°F day of the year in Fairbanks (and Anchorage). This is the 8th earliest occurrence of the first 70°F day for Fairbanks (and the second earliest for Anchorage). The earliest occurrence for Fairbanks was April 27, 2005. Figure 1 shows the date of the first 70°F day for Fairbanks since 1920. There is a gentle trend toward earlier dates. So what does it mean for the rest of the summer? Well, the short answer is: not much. Figure 2 shows the total number of 70°F days versus the date of the first occurrence and Figure 3 shows the date of the first occurrence versus the average June/July high temperature. It is plain to see that there is a low correlation. There are slightly more 70°F days in years that it gets off to an early start but that is a little misleading. If you break out the Top 10 years with the earliest 70°F occurrences (average date is May 2), the June/July average high temperature was 71.1°F. If you look at the Bottom 10 years with the earliest 70°F occurrences (average date is June 6), the June/July average high temperature was 71.3°F.

So will it be a warm summer? Perhaps. But not because of when the first "warm" day occurred.

Figure 1. Date of the first 70°F day of the year in Fairbanks (1920-2014).

Figure 2. Scatter plot showing the (lack of) correlation between the first 70°F day of the year in Fairbanks and the total number of 70°F days for the season.

Figure 3. Scatter plot showing the (lack of) correlation between the first 70°F day of the year in Fairbanks and the average high temperature in June and July.

Friday, May 2, 2014

Record High Pressure Aloft for May

The intense high pressure ridge currently residing over Alaska is by some measures the strongest on record for the month of May.  Yesterday afternoon's balloon sounding at Fairbanks observed the height of the 500 mb surface at 5750 m above sea-level, compared to a previous monthly record of 5744 m on May 30, 1964.  This is equivalent to saying that the pressure was the highest on record for May in the middle troposphere.  The observed heights also broke the monthly records closer to the ground, at 700, 850, and 925 mb, but the surface pressure was 1 mb shy of a record.

This morning's sounding reported an even higher 500 mb height, 5760 m.  The 4 am AKDT 500 mb analysis from Environment Canada is shown below.


Wednesday, April 30, 2014

Decadal Temperature Trends

The second half of April 2014 in Fairbanks will end as one of the warmest on record, although the full month will be only a little above normal because of the cold spell earlier in the month.  Unusual warmth in spring is very consistent with the trend in the past decade or so in Fairbanks, at least compared to decades prior to the strong 1987 El Niño.  For example, the April-May mean temperature in Fairbanks has been above the 1951-1980 average in 22 of 27 years since 1987; and ten straight years from 2003 to 2012 were warmer than that older normal.  Last year was of course a dramatic exception to the rule.

The charts below show a comparison between long-term mean temperatures by month, by season, and for the annual means; the green columns show the differences between the 1981-2010 mean and the 1951-1980 mean, while the blue columns show the difference between 2004-2013 and the 1951-1980 mean.  Looking at Fairbanks first, the most recent 10 years were warmer than the 1951-1980 mean in all four seasons, with the largest warming in spring (April-May).  The winter season warmed the most in the 1981-2010 period, but the negative PDO phase has brought cooling more recently in winter.  Curiously, Novembers have been cold of late, but Decembers have been very warm.


The situation at Barrow is remarkable, of course, with every month and season except March being warmest for the 2004-2013 period.  The recent warming has been most dramatic in October and November.


Charts for Anchorage, Nome, and Cold Bay are included below.  I added Cold Bay because of the extraordinary warmth there in the past several months, as highlighted by Brian yesterday.  Each of these locations has seen slight cooling in winter and spring (and for the annual mean) in the most recent 10 years compared to 1981-2010, but each location has warmed in autumn.


Tuesday, April 29, 2014

Temperatures Since October 1st

As Rick noted the other day, there has been a wide divide in the daily temperature anomalies across the State. Since October 1st, almost all of Alaska has ranged between above normal to way above normal. Figure 1 shows the average daily temperature anomaly between October 1st, 2013 and March 31st, 2013. Western Alaska in particular has been quite warm. This is in stark contrast to the Lower 48. Figure 2 shows the temperature anomaly for the same time period for the entire U.S. (Note: the color scale for Alaska is different).

Figure 1. October through April temperature anomaly for Alaska.


Figure 2. October through April temperature anomaly for the entire U.S.


As noted above, Alaska was quite warm compared to the rest of the country. Figure 3 shows the list of largest temperature anomalies in the U.S. from October through March. Only one non-Alaska station made the list.


Figure 3. Table showing the stations with the largest positive temperature anomaly in the U.S. Note: Cooperative stations were evaluated for Alaska but not for the Lower 48.

Another way to look at the distribution of temperatures is to break them down by climatological thirds. By definition, a tercile is a grouping where the expected value is 1/3. The upper tercile for temperatures is the group that you expect the anomalously warmest 1/3 of your days to fall into. The lower tercile is the 1/3 of days you expect the anomalously coldest 1/3 of your days to fall into. The middle tercile is the 1/3 of days that hover around the daily normal. If temperatures are normally distributed, over long time periods you would expect that 33% of days would fall within each tercile. Figure 4 shows the tercile breakdown for 10 geographically diverse stations across Alaska from October 1st to April 18th (200 days). Amazingly, Cold Bay has been in the upper tercile over 70% of the time!


Figure 4. Tercile breakdown for 10 stations in Alaska.

Finally, if we just look at the percentage of days either above or below normal, we can get a sense of the temperature trend regularity without the magnitude. Figure 5 shows the percentage of days that were above normal between October 1st and March 31st in Alaska. Figure 6 shows the corollary data (below normal percentage) for the entire U.S.


Figure 6. Percentage of days from October through April in Alaska that were above normal. 

Figure 7. Percentage of days from October through April in the entire U.S. that were below normal. 

***** Update Section ***


Figure 8. ESRL reanalysis of October through March temperature anomalies in the Northern Hemisphere. Units are in degrees Celsius.


Monday, April 28, 2014

Fairbanks Cloud Cover vs Temperature

Reader Eric suggested that the relationship between cloud cover and temperature in Fairbanks would be nicely revealed using scatter plots; he is right, of course, and the results are below.  The winter positive correlation between cloud cover and temperature is significant from November to March (and strongest in November), while the summer inverse correlation shows up quite strongly in June through August (and is strongest in June).

Note the different horizontal axis scale in the plot for summer; monthly mean cloud cover is nearly always considerably more than 50 percent in summer.


Sunday, April 27, 2014

Around Alaska in 2014: Temperature Departures

For fun, here's a scatter plot of daily standardized temperature departures (1981-2010 normals) so far for 2014 for Fairbanks, Nome, Anchorage and Juneau. The color scheme here is by terciles, so ±0.43 standard deviations is the cutoff between for the "near normal" category. If you look at this full screen, you can see that many of the lower tercile (blue) departures were at Juneau, while Nome has had a lot of upper tercile (red) departures.


Thursday, April 24, 2014

Sunny Spring

Fairbanks has enjoyed predominantly dry and relatively sunny weather since late winter, and temperatures have been mostly above normal except for the brief cold snap earlier in April.  Measurable precipitation since March 1 has occurred on only 5 days, compared to a long-term median of 8 days in this typically dry time of year.

I recently downloaded the history of hourly cloud cover observations from Fairbanks, and these reveal that more than half of the days since March 1 have been mostly clear; I defined this based on a daily mean cloud cover amount of less than 50%.  The long-term normal (1950-2013) is for about 35% of days to be mostly clear in this period, so in 2014 there has been a 50% excess of clear days; but this is not close to a record.  Between March 20 and April 2 there were 14 straight days with mostly clear skies, but this too is less than the springtime record of 19 such consecutive days in 1983.

The chart below shows mean daily cloud cover compared to normal so far in 2014.  The normal values are derived from the NCDC 1981-2010 normals for each category of cloudiness (clear, few, scattered, etc).  The updated temperature chart is also included below, and the seasonal change in correlation between cloudiness and temperature is evident.  In winter, clear skies are strongly associated with cold conditions, but as the sun strengthens and days lengthen, clear skies increasingly bring warmth while clouds begin to suppress temperatures.


Wednesday, April 23, 2014

Interior Alaska and 2013 Daily Anomalies

As we have discussed several time in the last few months, 2013 was a very anomalous year for much of Alaska. Even though the annual temperature deviations were not too extreme in most cases, there were many, many days with large temperature deviations. One common method of measuring dispersion is to look at the distribution from an expected mean. Assuming temperatures are normally distributed, which they pretty much are, we would expect that 95% (95.4% to be precise) of days would be within 2 standard deviations of the daily mean. In other words, we would expect that 4.6% of days would be more than +2 standard deviations or less than -2 standard deviations from the daily normal.

In 2013, this was true for the vast majority of the U.S. To analyze this, I paired stations in the GHCN v.3 database with 1981-2010 daily normal values published by NCDC. For the Lower 48, I only used primary stations (n=866) and for Alaska I used both primary and Cooperative stations (n=103). In each case there had to be no more than 25% of days with missing or flagged data.

On the maps, anything shaded in blue indicates that less than 4.6% of days were more than 2 standard deviations from the daily mean. Yellow, orange, and red colors show areas that exceeded the expected rate of days that were more than +2 standard deviations or less than -2 standard deviations from the daily normal.Only a few areas in the Intermountain West and much of Alaska had significantly more than 5% of days greater than 2 standard deviations from the daily mean.

The 'Winner' for primary (USW) stations in the entire U.S. was Anchorage's Merrill Field with a value of 10.1%. The Delta 6N Cooperative station in Alaska actually had a value of 11.9%. Figure 3 shows the stations with the largest percentage of +/- 2 standard deviation days.


Figure 1. Percentage of days in Alaska more than +2 standard deviations or less than -2 standard deviations from the daily normal.


Figure 2. Percentage of days in the U.S. more than +2 standard deviations or less than -2 standard deviations from the daily normal.


Figure 3. List of stations ranked my the highest number of percentage of days more than +2 standard deviation or less than -2 standard deviations from the daily normal.

Sunday, April 20, 2014

The May 1964 -1°F Low Temperature

The most difficult daily temperature record to beat in Fairbanks is the -1°F on May 9th, 1964. Using the 1981-2010 normals, a value of -1°F on May 9th is 6.33 standard deviations below the daily normal low temperature. This is also the latest sub-zero reading on record for Fairbanks. Figure 1 shows the 5 most difficult daily low temperature records to beat for Fairbanks.


Figure 1. The five most difficult daily low temperature records to break in Fairbanks using 1981-2010 normals.

In looking at the hourly observations for Fairbanks for the time period of May 6th through May 11th, a sharp cold front clearly passes through Fairbanks around 6 p.m. on May 7th, 1964. The temperature dropped precipitously and the air pressure rose over 20 mb in 12 hours. Figure 2 shows the air and pressure readings during this time period. On 5 of the 6 days, the official low temperature deviated from the hourly observations by no more than 1°F. However, on May 9th, the lowest hourly temperature reading was 5°F at both the 5 a.m. and 6 a.m. observations. Readings of 6°F were measured at 2 a.m., 3 a.m., 4 a.m., and 7 a.m. To achieve a low temperature of -1°F, the temperature must have dropped and rebounded by at least 6°F between hourly observations. This situation occurs occasionally during the dark winter months but a mechanism to explain this phenomenon in the month of May in lacking. Not shown on the chart is a consistent wind from the north between 7 and 12 mph during the time period with temperatures between 5°F and 6°F.

Figure 2. Hourly air temperature and pressure measured at the Fairbanks International Airport between May 6th and May 11th, 1964.

Looking at the temperatures regionally, I pulled all the station data for Alaska during the May 8th to 10th, 1964, time period to find the lowest temperature. A three-day period is used to negate the effect of observation time effects shifting an observation to the following day. Figure 3 shows the lowest temperature during this time period.

Figure 3. Lowest temperature between May 8th and 10th, 1964.

Other that the Fairbanks International Airport reading of -1°F, no other station around town was colder than +2°F. The only other station with hourly observations was Eielson Field. Their low temperature on May 9, 1964 was 4°F and their lowest hourly observation was also 4°F. Given the correlation between the hourly readings and the official daily minimum on all days except May 9th at Fairbanks International Airport, it seems unlikely that any sort of sloshing of airmass occurred which could account for intra-hourly reading anomalies.

It is worth emphasizing how uncommonly cold this airmass was for May. The values shown in Figure 3 would be uncommon for early April, much less early May.  The 850 mb temperature at Fairbanks was -25.6°C on 5/9/64 at 12Z. No other May has seen an 850 mb temp below -20°C.

So, is the -1°F a valid reading? In my opinion, it is a questionable reading that requires further investigation.

Figure 4. Excerpt from the Fairbanks Daily Newsminer from May 9, 1964.


Friday, April 18, 2014

Sudden Onset of Thawing

After a slightly delayed start, the thawing season has suddenly gotten under way in the interior, and in only a few days the snow depth at Fairbanks airport has dropped in half (from 20" on Sunday to 10" today).  The year-to-date accumulation of thawing degree days, defined as the excess of the daily mean temperature above 32 °F, will be above normal in Fairbanks after today.  The chart below shows the annual thawing degree day accumulation through April 17; I think there is a strong connection here between earlier onset of thawing and El Nino conditions in the preceding months.


It is of some interest to note that this year looks like being one of the unusual ones in which freezing conditions in Fairbanks (mean daily temperature below 32 °F) give way to thawing conditions (mean daily temperature above 32 °F), with no period of back and forth.  This occurs in about 10 percent of years and last happened in 2007.  For comparison, a sudden transition in the opposite direction in the autumn happens in about 15 percent of years - a little more often, because the autumn cooling is more rapid than the spring warming.

Wednesday, April 16, 2014

Winter Low Temperatures Around Fairbanks

Once or twice a year I make a map of the temperatures around Anchorage showing the number of 70°F days in the summer and the number of 0°F days in the winter. This time I decided to see how Fairbanks did this winter for achieving certain temperature thresholds.

I downloaded all observation data for the ASOS, RAWS, and CWOP stations around Fairbanks from the Mesowest site since November 1st. For those stations that are also part of the GHCN network, I downloaded the official daily summaries as well. The Mesowest site only receives temperatures every 15-60 minutes so many instances of minimum temperature thresholds may have been missed between observations. For example, if we only looked at the hourly readings for the Fairbanks International Airport, we would think that 11 days were -30°F or colder. However, the daily summary for Fairbanks indicates that 14 days were -30°F or colder. For the Ft. Wainwright RAWS station, the Mesowest data and the daily summary data matched very nicely. That is due to the much more frequent rate of observations sent to the Mesowest site. The same is true of the CRN site (Fairbanks 11 NE).

For the Anchorage map, I added a shading to indicate likely values between points. However, I decided not to do the same for Fairbanks due to the fact that very small elevation changes have a dramatic effect on the total numbers displayed on the maps. Those elevation differences are too subtle to represent effectively at this time.

Here are the maps for the number of days where a temperature of -10°F, -20°F, -30°F, and -40°F, were recorded. Once again, for the GHCN sites, I used the official daily summary. For the other sites, I used the lowest daily observation that was sent to the Mesowest site. The last image is the map of sub 0°F days in Anchorage.

Goldstream Valley (D1454), Ester 5 NE, Fort Wainwright, North Pole, and Eielson seem to be the most consistently cold.