Showing posts with label Clouds. Show all posts

Tuesday, January 24, 2023

Cloud Cover Trends

Continuing with the topic of cloud cover in Alaska, reader Gary asked about the 1976/77 Pacific climate regime change, noting that Hartmann and Wendler (hereafter "HW") showed an increase in average cloudiness for Alaska, particularly in winter.  The results in that study were derived from ground-level observations at 19 climate measuring sites across the state, and with data used only through 2001, this was mostly pre-ASOS and therefore presumably quite reliable (i.e. manual human observations).

Here's the key table from the study, showing the percent change in mean cloudiness from 1951-75 to 1977-2001.


It's worth doing the same calculation with ERA5 data, to see if the reanalysis captures broadly similar changes.  We would hope so, because I've been relying on the ERA5 reanalysis data for its depiction of Alaska's cloud climate.

Here are the results for a few of the NOAA/NCEI climate divisions; I didn't attempt to reproduce HW's six climate regions, which are larger than the 13 NCEI climate divisions.


There is considerable similarity in the results for winter, with ERA5 also showing a large increase in cloud cover, and particularly so for south-central and western Alaska.  However, for the rest of the year, the more modest changes do not align well between ERA5 and the station data, and in particular ERA5 shows an increase in summer cloud cover (except the North Slope) versus HW's decrease.  ERA5 also suggests more of an increase in autumn cloudiness.

Can we identify the 1976 regime shift in the ERA5 time series?  Looking at the statewide average for DJF, the answer is actually no - we see very high cloud cover in the winter of 1976-77, but then it dropped back down for several more years.  However, ERA5 does seem to show a regime shift in 1984-85.


The West Coast division has the most statistically significant 1950-2022 trend in DJF cloud cover, and the mid-80s regime change seems quite striking here:


Interestingly, HW identified the sudden 1976 increase in Alaska's temperatures and the simultaneous PDO phase shift from negative to positive, but they didn't document a sudden change in cloud cover - they just looked at the pre/post 1976 differences.  According to the ERA5 data, there is more going on with cloud cover than just the PDO phase change.

A possible explanation for the discrepancy between ERA5 and the HW results is the (perhaps likely) possibility that ERA5 "total cloud cover" doesn't correspond closely to what human observers report from the ground.  Also, there are considerable differences in the trends for ERA5 "low cloud" (below about 2km above ground) versus "high cloud" (above about 6km); for example, the North Slope has a decrease in summer low cloud but an increase in summer high cloud.

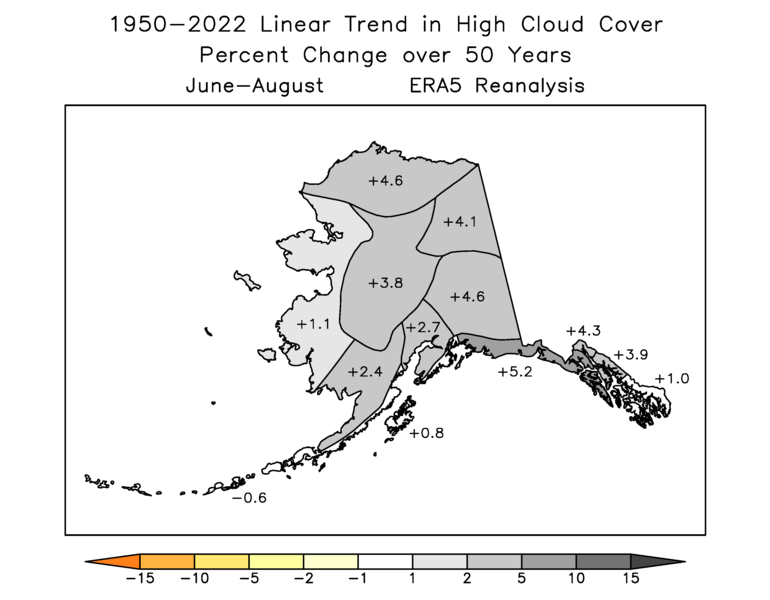

Most of the state has less of an increase in "low cloud" cover, so perhaps the human observations correspond more to the low-level clouds in the model.

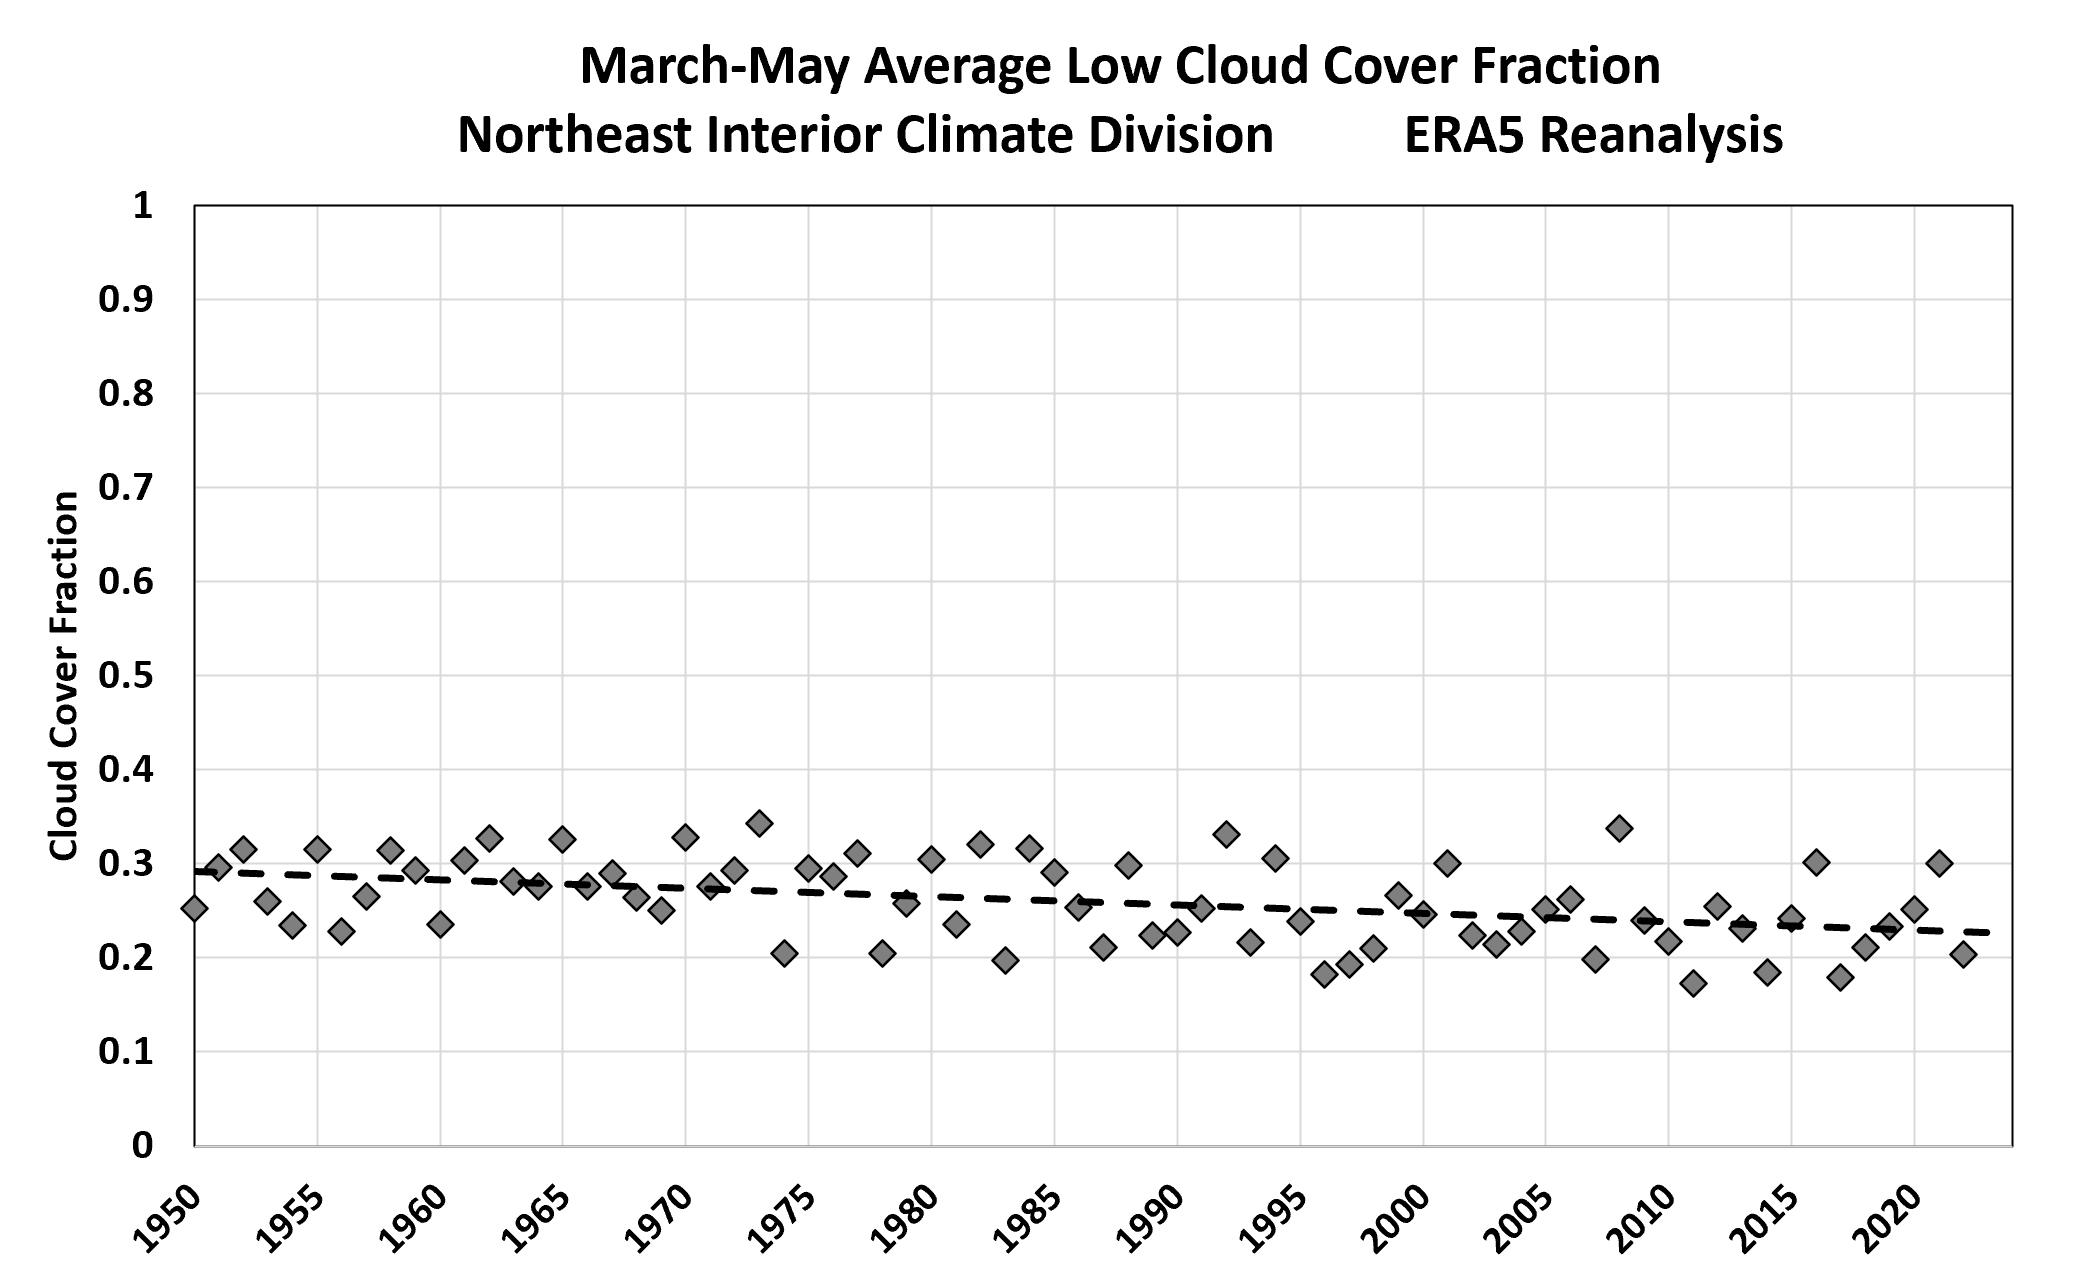
The difference in low versus high cloud trends is really striking for spring, with a big decrease in low cloud for the interior according to ERA5:

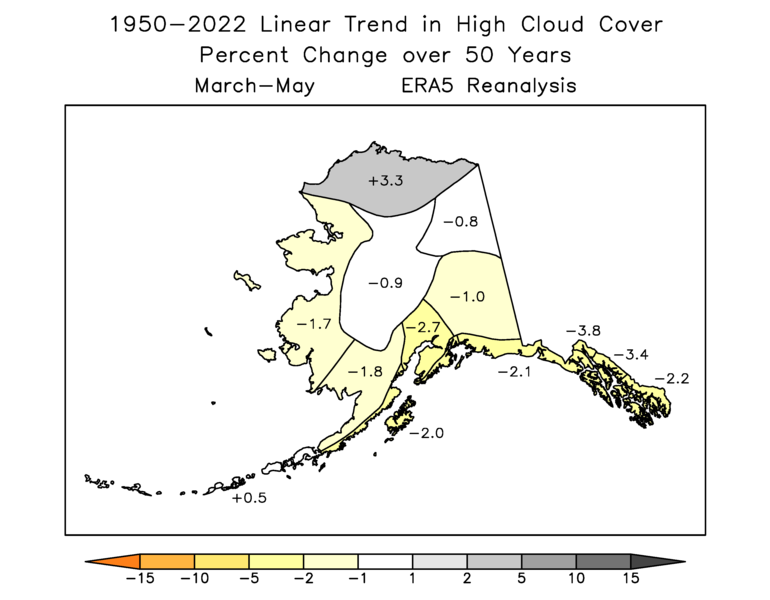
It seems possible that this is related to earlier snowpack meltout in the spring, perhaps because low clouds are easier to disperse over bare ground (more solar absorption at the ground and stronger daytime warming in the boundary layer).

On an annual basis, both HW and ERA5 point to a modest increase in cloud cover, driven largely by the winter changes, and concentrated in south-central and western Alaska.


Here are the "total cloud cover" trend maps for the four seasons.


Sunday, January 8, 2023

More on Cloud Cover Climate

Following up on the climate of cloud cover in Alaska - in response to a reader's question - I created some maps to illustrate the relationship between the large-scale weather patterns and cloud cover.  I'm relying on the gridded ERA5 reanalysis data for its ease of use, and I make no claims about accuracy, but it's considered a state-of-the-art system that should be suitable for this kind of broad-brush analysis.

With Alaska being a big place and having tremendously different cloud climates across the state, I extracted the ERA5 cloud cover data for the NOAA/NCEI climate divisions (shown below); this allows us to look at the different regions separately.


For example, here's the 500mb height pattern that tends to give the cloudiest conditions for the Southeast Interior region in January.  This is simply a map of the average departure from normal of January 500mb height in the 8 years since 1950 that had the highest January cloud cover.


For those who are not familiar, the 500mb height is equivalent to the pressure at middle levels of the atmosphere, so relatively high heights represent a mid-level high pressure system (a "ridge"), whereas low heights correspond to a low pressure system (a "trough").  Alternatively we could look at sea-level pressure maps, but I find the 500mb height maps usually show more coherent patterns.

In this example, the map is telling us that a stronger-than-normal trough over the Aleutians and a stronger-than-normal ridge over British Columbia is a favorable combination for high cloudiness in the southeast interior of Alaska in January.  With a tendency for counter-clockwise circulation around the trough, and clockwise around the ridge, this pattern tends to bring warm, moist, and therefore cloudy air up from the south into interior Alaska.  The pattern also reflects a jet stream that is directed into Alaska from the southwest, importing lots of Pacific cloud.

The years with the least January cloud cover tend to have a flow pattern that is nearly opposite, with a trough over British Columbia and a ridge from the Aleutians northward into the Arctic.  The associated circulation brings cold, dry, and therefore relatively cloudless air down from the Arctic into the southeast interior.


The cloud cover variations are not just about humidity, however.  It's important to note that the circulation also generates patterns of rising or sinking air that generate or suppress cloud cover respectively.  In the "least cloud cover" example above, the ridge produces sinking air to its east, which lowers the relative humidity of the air and suppresses cloud cover over eastern Alaska.

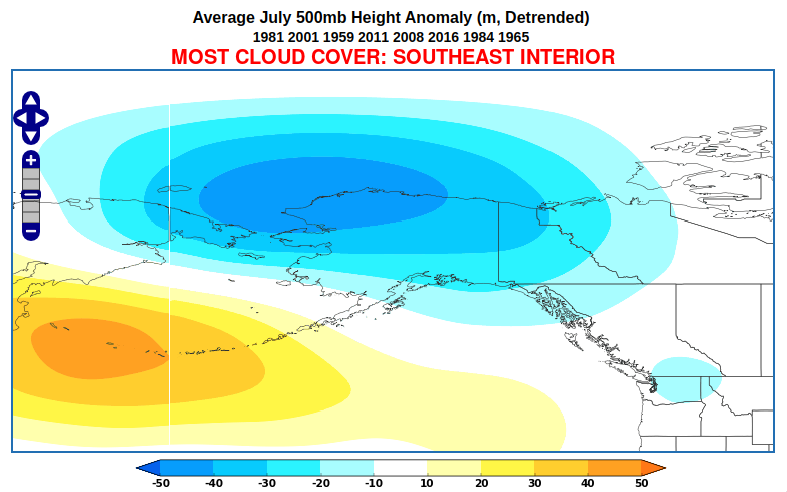
The map below shows the 500mb height pattern for above-normal cloud cover in July in the Southeast Interior division.  It's interesting to see that the cloud-producing trough is much farther north than in the winter.  In summer, the southeast interior sees its cloudiest weather with strong westerly flow and frequent rainy disturbances, whereas cloud in the winter is more about the orientation of the jet stream over the North Pacific.


As for low cloud cover in July, it's commonly associated with high pressure centered to the north, producing a tendency for dry, easterly flow from Canada into Alaska; and the ridge of high pressure itself suppresses cloud and rain.  This would be not only a very sunny pattern, but a very dry one.


Let's look at some other regions.  The results are quite similar for the West Coast climate division as for the Southeast Interior - see below.  The main differences are that the winter high-cloud pattern tends to involve a trough extending farther north into the Chukchi Sea, and in summer high cloud cover is associated with a Chukchi Sea trough rather than a broad trough over northern Alaska.


How about the North Slope climate division?  Not surprisingly, the winter circulation signals are shifted farther north again.  But unlike in the regions farther south, low cloud cover in winter is associated with a ridge to the north rather than a ridge to the west.  It's also interesting to note that the winter and summer low-cloud-cover patterns are similar to each other for the North Slope; and the summer "most cloudy" pattern is nearly the same as that for the Southeast Interior, although only 2 of the 8 cloudiest years respectively are the same.


And one more, results for the Central Panhandle:


The winter patterns are akin to those in the other regions, but summer cloud cover variations are more closely linked to the height pattern in the local vicinity - over and just to the west of the Panhandle - than for other regions.  Clearly the spatial scale of the mid-atmosphere flow anomalies is smaller in association with summer cloud than for winter cloud, and while this is also true for the other regions, it seems most notable for the Panhandle.

Finally, it's worth remembering that these patterns are focused on the ERA5 total cloud cover, which includes cloud at any height above ground.  The data set also includes cloud at low, medium, and high levels, and of course these are all influenced differently by the circulation anomalies.

Just as one example, here are the January patterns that typically produce the least cloud at low levels (below about 2km above ground) and high levels (above about 6km) respectively for the Southeast Interior.  According to ERA5, the Bering Sea ridge that we noted before is more associated with reduced high cloud than reduced low cloud.


There are equally significant differences in the summer "least cloud" patterns for low versus high levels of the atmosphere:


But interestingly the cloudy-sky patterns are much more similar to each other for low and high clouds, in both summer and winter.  I suppose that the cloudiest weeks and months tend to be cloudy at all levels of the atmosphere, owing to unusually disturbed weather, whereas it's quite possible to have low-level clear skies marred by high cloud, or vice versa.  This is just for the Southeast Interior, however.


If anyone is interested in acquiring the ERA5 monthly cloud data, I'd be happy to pass it on.  And if there are any suggestions for further analysis, feel free to leave them in the comments.

Saturday, December 31, 2022

Cloud Cover Climate

A few weeks ago, a reader asked if I could add some discussion and analysis about cloud cover in Alaska, and its relationship to high and low pressure systems.  I decided to look at this using ERA5 reanalysis data, because it's easily accessible and should have reasonably good quality, being constrained by satellite measurements.

The first thing to glance at is the climatological normal for cloud cover, at least according to the model.  Here's the ERA5 estimate of the annual mean percentage of sky that's covered by cloud at any height above ground (click to enlarge):


Not surprisingly, the cloudiest regions are the Aleutians and southwestern Alaska, Southeast Alaska, and the northern North Slope.  It also makes sense that the northern interior is the least cloudy part of the state, as it's relatively far removed from the storm-frequented Aleutian region and is also sheltered from Arctic storminess.  I'm not sure I would have guessed, though, that northwestern Alaska to the south of the Brooks Range has as little cloud as the much more continental zone in interior northeastern Alaska.

The seasonal breakdown is striking - see maps below for January, April, July, and October.  Much could be said on this, but I'll just note the relatively high proportion of clear skies across the interior in winter (good for aurora-gazing!); and obviously late winter and early spring have the clearest skies for most, being also the driest time of year for all of the state except the maritime south (where early summer is drier).  Also - summer is relatively (some would say dreadfully) cloudy for most of southern Alaska.


A wider view of the high-latitude Northern Hemisphere shows that interior Alaska has some of the clearest skies of any sub-Arctic location in January.  With long hours of darkness, this makes Fairbanks a top international destination for aurora seekers.  In contrast, notice how very cloudy western (and indeed most of) Russia is.


For completeness, here are the other months, and the annual average, for the high-latitude hemisphere.


Russia does much better than Alaska for sunshine in summer, and in fact it has a dramatically more pronounced seasonal cycle of cloudiness.  This is completely new to me, and I'll have to think about why this is.

I'll pick up this thread in another post, looking at the relationship between pressure patterns and cloud cover for different parts of Alaska.

Happy New Year to all!