I've been rather too busy to focus on new blog material lately, but after posting about O'Brien Creek a couple of weeks ago, I started thinking about another wintertime cold spot that Rick mentioned some time ago. I can't find his comment now, but I clearly recall him stating that Allakaket is "much colder" than Bettles in winter; so I figured it would be worth posting another set of comparison plots. The two villages are about 40 miles apart on the Koyukuk River, with an elevation difference of 240 feet (Bettles being higher).
Allakaket was an active climate reporting station in the early 20th century and historical data exists with varying degrees of completeness up until 1982; but sadly there's nothing in the GHCN database since then. Bettles started reporting in 1951, so in theory we have 30 years of overlap between the two sites, although Allakaket has many periods of missing data. Using only the days with both maximum and minimum temperature reported at both sites, I calculated the monthly mean temperatures for the period of overlap, and the results show that Allakaket was indeed much colder - see the chart below.
It's remarkable to see that average daily minimum temperatures were more than 10°F colder at Allakaket from December through March, and daily maximum temperatures were 7°F colder in January. The average January minimum of -29.7°F at Allakaket is lower than the modern average at either Chicken or O'Brien Creek, although here we are looking at the colder climate of several decades ago.
Looking at all winters with at least 90% complete and overlapping data, we can see that Allakaket was colder than Bettles every time, for both maximum and minimum temperature. In the winter of 1976-77, Allakaket's low temperatures were 16°F colder on average.
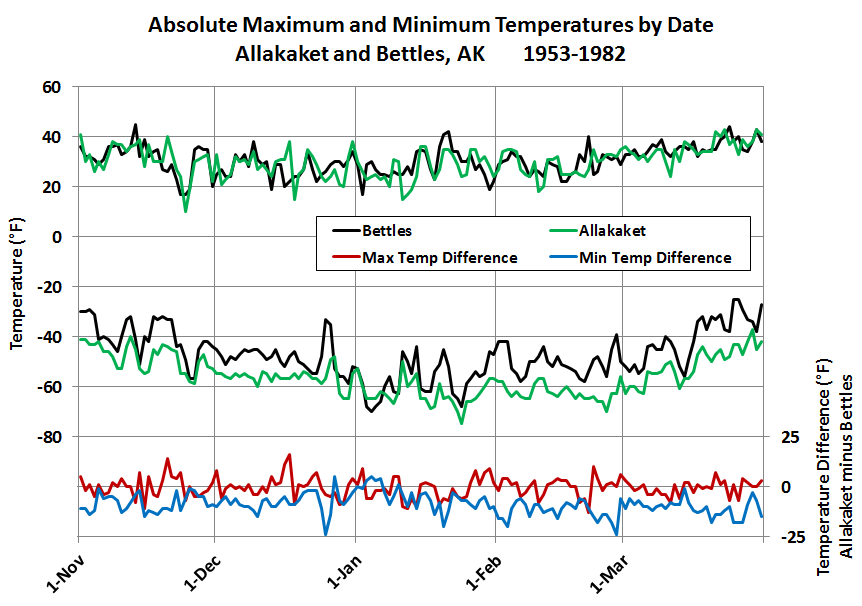
The absolute maximum and minimum temperatures for each date during winter within the overlapping period show a pronounced difference in the potential for extreme cold (see below); but the warm extremes are about the same, showing that Allakaket is just as capable of warming up when temperatures get far above normal.
Finally, scatterplots of the 3100 overlapping days show the joint distribution for daily maximum and minimum temperatures. Notice the much higher number of days that dropped below -60°F in Allakaket compared to Bettles. It's too bad that there is no weather observer in Allakaket these days, because it would be fascinating to see if these differences persist in the modern day, or if they were partly an artifact of a colder climate in earlier decades, with perhaps more clear skies and calm winds to help reinforce inversion conditions lower down the Koyukuk River valley.
Objective Comments and Analysis - All Science, No Politics
Primary Author Richard James
2010-2013 Author Rick Thoman
Wednesday, January 13, 2016
Friday, January 8, 2016
1871 Whaling Conditions
In the past couple of days there have been some stories in the media about NOAA's expedition last year to locate the remains of the whaling fleet that was lost in unusual ice conditions near Wainwright in September 1871. Here's a brief write-up from NOAA:
http://www.noaanews.noaa.gov/stories2016/010616-remains-of-lost-1800s-whaling-fleet-discovered-off-alaskas-arctic-coast.html
I thought it would be interesting to see if the 20th Century Reanalysis (which actually extends back to 1851) shows any hint of unusual weather conditions that could have created unusual pack ice close to the Chukchi Sea coast that September. A Wikipedia article claims that "a stationary high, parked over northeast Siberia, reversed the normal wind pattern and pushed the pack ice toward the Alaskan coast"; I haven't yet examined other sources to see if there is good evidence for this, but it stands to reason that something like this probably happened.
The series of maps below shows the 20th Century Reanalysis sea-level pressure anomaly (departure from normal) for 4 consecutive weeks beginning with August 18-24, 1871. The reanalysis shows lower than normal pressure in the Bering Sea, and a tendency for high pressure over Alaska - especially in the first week - but there is no evidence of a pressure pattern that would tend to drive ice into the coast near Wainwright.
The maps below show the 1000mb vector wind anomaly, which is the vector wind's departure from normal. Again there is no evidence of unusual winds directed towards the Alaskan coast, and in fact the 1st and 4th weeks show the very reverse. Unfortunately all this means is that the 20th Century Reanalysis doesn't appear to explain how the ice conditions became so severe; the reanalysis could be wrong, or there might be another explanation for the ice. Given the presumably very sparse observational data back in 1871, it seems difficult to imagine that the reanalysis could have any real accuracy for this part of the world back then; but it was worth a look, I think.
http://www.noaanews.noaa.gov/stories2016/010616-remains-of-lost-1800s-whaling-fleet-discovered-off-alaskas-arctic-coast.html
I thought it would be interesting to see if the 20th Century Reanalysis (which actually extends back to 1851) shows any hint of unusual weather conditions that could have created unusual pack ice close to the Chukchi Sea coast that September. A Wikipedia article claims that "a stationary high, parked over northeast Siberia, reversed the normal wind pattern and pushed the pack ice toward the Alaskan coast"; I haven't yet examined other sources to see if there is good evidence for this, but it stands to reason that something like this probably happened.
The series of maps below shows the 20th Century Reanalysis sea-level pressure anomaly (departure from normal) for 4 consecutive weeks beginning with August 18-24, 1871. The reanalysis shows lower than normal pressure in the Bering Sea, and a tendency for high pressure over Alaska - especially in the first week - but there is no evidence of a pressure pattern that would tend to drive ice into the coast near Wainwright.
The maps below show the 1000mb vector wind anomaly, which is the vector wind's departure from normal. Again there is no evidence of unusual winds directed towards the Alaskan coast, and in fact the 1st and 4th weeks show the very reverse. Unfortunately all this means is that the 20th Century Reanalysis doesn't appear to explain how the ice conditions became so severe; the reanalysis could be wrong, or there might be another explanation for the ice. Given the presumably very sparse observational data back in 1871, it seems difficult to imagine that the reanalysis could have any real accuracy for this part of the world back then; but it was worth a look, I think.
Wednesday, January 6, 2016
Brooks Range Thaw
Deep southerly flow aloft continues to transport very warm air northward across Alaska, although the proximity of the upper-level ridge has allowed valley-level locations in the central and eastern interior to cool off recently. Western areas are having no such luck; for example, Kotzebue has had 8 straight days with a high temperature at or above 32°F (including today). This is an all-time record (1930-present) for the winter months of December through February (the previous record was 6 days on several occasions). McGrath is at 9 days and counting with a high temperature of 35°F or higher, which is also an all-time record.
Here's this morning's 500 mb analysis, courtesy of Environment Canada; it's clear that the air now affecting Alaska was located far to the south not many days ago.
Temperatures above freezing have been reported at many mid-elevation locations on both sides of the Brooks Range in the past day or so. For example, the Ivotuk CRN site at 1900' elevation remained mostly above freezing for a lengthy period yesterday, as shown in the following chart.
The nearby Howard Pass RAWS (2062'), notorious for its frequently severe wind chill, was also above freezing at times yesterday:
Farther to the east, Toolik Lake (2493') also experienced a thaw in the early hours of yesterday.
Other high temperatures include 35°F at the Imnaviat Creek SNOTEL (3050'), 38°F at the Sagwon SNOTEL (1000') on the North Slope, and 34°F at the Coldfoot SNOTEL (1040') on the south side of the Brooks Range.
Even Umiat, at low elevation on the banks of the Colville River, rose to 32°F yesterday evening. This is not unprecedented, but certainly very unusual.
Here's this morning's 500 mb analysis, courtesy of Environment Canada; it's clear that the air now affecting Alaska was located far to the south not many days ago.
Temperatures above freezing have been reported at many mid-elevation locations on both sides of the Brooks Range in the past day or so. For example, the Ivotuk CRN site at 1900' elevation remained mostly above freezing for a lengthy period yesterday, as shown in the following chart.
The nearby Howard Pass RAWS (2062'), notorious for its frequently severe wind chill, was also above freezing at times yesterday:
Farther to the east, Toolik Lake (2493') also experienced a thaw in the early hours of yesterday.
Other high temperatures include 35°F at the Imnaviat Creek SNOTEL (3050'), 38°F at the Sagwon SNOTEL (1000') on the North Slope, and 34°F at the Coldfoot SNOTEL (1040') on the south side of the Brooks Range.
Even Umiat, at low elevation on the banks of the Colville River, rose to 32°F yesterday evening. This is not unprecedented, but certainly very unusual.
Friday, January 1, 2016
Chinook Winds
A wave of warmth has inundated Alaska in the last few days, and chinook winds have amplified the warming in much of the interior. On Wednesday temperatures rose above freezing at locations spanning the state from west to east, including Nome, Kotzebue, Bettles, Fairbanks, and Eagle. There have only been 10 previous days since 1952 (the common period of record) when all these stations made it above freezing on the same day in December through February; 6 of these 10 days have occurred since 2009.
The only portion of the interior that has stayed well below freezing is the far southeast, where the proximity of the upper ridge prevented winds from mixing down the warmth aloft; Northway has not exceeded 14°F.
Fairbanks airport reached 45°F on Wednesday, as the southerly chinook winds managed to break through the surface-based inversion for just a brief time in the afternoon; the temperature rose from 34°F at 1pm to 45°F at 2pm, and then dropped back to 30°F at 3pm and to 15°F by mid-evening as the stagnant colder air rolled back in. A more extended period of gusty warm winds yesterday afternoon took the temperature back up to 40°F with a bit of mixed rain and snow.
Wednesday's fluctuations in temperature and wind speed in Fairbanks are evident in the half-hourly observations from UAF's Smith Lake site, see below. The second temperature spike, with the larger wind speed spike, is the one that produced the high temperature at the airport, but at Smith Lake the temperature jump occurred between 12 and 12:30 (presumably AKST), i.e. at least 30 minutes earlier than at the airport. The elevation difference between the two sites is only about 100 feet, but this might explain the delay in warming at the airport as the wind burst took time to mix down.
The relative humidity plot from Smith Lake shows the low humidity of the chinook air - see below. The humidity fluctuations nicely highlight the contrast between the two air masses, one of them cold, humid, dense, and stagnant, and the other warm, dry, less dense, and moving quickly northward. The density contrast between two such air masses is so great that they might be thought of as immiscible, like oil and water: they simply do not mix. The warm air tends to slide over the cold air, and in the Fairbanks area the chinook flow doesn't often make it to the valley floor unless the pressure gradient is large or winds become unusually strong.
Similar charts from the Poker Flat Research Range, about 30 miles north of Fairbanks at ~700' elevation on the Chatanika River, show that temperatures were above freezing for two lengthy periods on Wednesday - see below. The early afternoon spike in wind speed was also observed at this location (note that the time axis appears to be UTC), but the temperature rise was more gradual as there was less stagnant, stable cold air to displace at the higher elevation.
The only portion of the interior that has stayed well below freezing is the far southeast, where the proximity of the upper ridge prevented winds from mixing down the warmth aloft; Northway has not exceeded 14°F.
Fairbanks airport reached 45°F on Wednesday, as the southerly chinook winds managed to break through the surface-based inversion for just a brief time in the afternoon; the temperature rose from 34°F at 1pm to 45°F at 2pm, and then dropped back to 30°F at 3pm and to 15°F by mid-evening as the stagnant colder air rolled back in. A more extended period of gusty warm winds yesterday afternoon took the temperature back up to 40°F with a bit of mixed rain and snow.
Wednesday's fluctuations in temperature and wind speed in Fairbanks are evident in the half-hourly observations from UAF's Smith Lake site, see below. The second temperature spike, with the larger wind speed spike, is the one that produced the high temperature at the airport, but at Smith Lake the temperature jump occurred between 12 and 12:30 (presumably AKST), i.e. at least 30 minutes earlier than at the airport. The elevation difference between the two sites is only about 100 feet, but this might explain the delay in warming at the airport as the wind burst took time to mix down.
The relative humidity plot from Smith Lake shows the low humidity of the chinook air - see below. The humidity fluctuations nicely highlight the contrast between the two air masses, one of them cold, humid, dense, and stagnant, and the other warm, dry, less dense, and moving quickly northward. The density contrast between two such air masses is so great that they might be thought of as immiscible, like oil and water: they simply do not mix. The warm air tends to slide over the cold air, and in the Fairbanks area the chinook flow doesn't often make it to the valley floor unless the pressure gradient is large or winds become unusually strong.
Similar charts from the Poker Flat Research Range, about 30 miles north of Fairbanks at ~700' elevation on the Chatanika River, show that temperatures were above freezing for two lengthy periods on Wednesday - see below. The early afternoon spike in wind speed was also observed at this location (note that the time axis appears to be UTC), but the temperature rise was more gradual as there was less stagnant, stable cold air to displace at the higher elevation.
Tuesday, December 29, 2015
Winter at O'Brien Creek
Back in 2012, before I took over as lead author on this blog, Rick Thoman penned a very nice essay about candidate locations for the coldest place in Alaska. I've long been interested in his comment there that a short-lived co-operative observing site at O'Brien Creek in the Fortymile Country tended to be colder in winter than the famously cold settlement of Chicken. After all this time I've taken a close look at the data, and I can confirm that indeed O'Brien Creek was (and presumably still is) slightly colder than Chicken in winter. This would give it the coldest observed winter climate in interior Alaska.
The O'Brien Creek co-operative observers (Larry and June Taylor, to whom we owe a debt of gratitude!) recorded the weather at their place of residence from May 2001 through August 2010, giving us 9 winters of mostly complete climate data. There are some missing days or periods here and there, but overall the November-March data is 94% complete for this period; this is about the same as for Chicken.
Looking at all dates for which data is available from both O'Brien Creek and Chicken, we find that the November-March mean temperature was 0.5°F colder at O'Brien Creek; so overall it is a very small difference, and not statistically significant. However, the differences are larger in late winter and are strongly significant for both February and March. The chart below shows the mean daily maximum and minimum temperatures by month for the overlapping period of record; we see that differences are very small in November through January, but O'Brien Creek is colder in February and has lower minimum temperatures in March.
The November-March mean temperatures for each winter with mostly complete data are shown below, with the top pair of lines showing mean maximum temperatures and the middle lines showing mean minimum temperatures. The bottom pair of lines shows the differences between the two locations, with the scale on the right axis. The winter of 2005-2006 produced relatively warmer daily maximum temperatures at O'Brien Creek, but in most of the other winters O'Brien Creek was slightly colder. February mean temperatures were colder at O'Brien Creek in all but one winter, and in February 2007 the difference was a substantial 6.7°F. The 2006-2007 November-March mean daily minimum temperature of -30.6°F is remarkably cold and ranks up (down) there with the likes of Umiat, Arctic Village, and Allakaket for historic cold.
It's interesting to look at the absolute minimum and maximum temperatures observed at the two locations during the period of overlapping data; see below. As before, the green and black lines show the comparison for maximum and minimum temperatures, and the red and blue lines show the differences. For November through January there are no obvious systematic differences, but from mid-February through March the extremes become relatively colder at O'Brien Creek for both maximum and minimum temperature. So for example O'Brien Creek recorded -61°F on March 3, 2007, and -51°F on March 15, 2009, whereas the latest dates for -60°F and -50°F at Chicken are February 24 and March 4, respectively - and that's using the entire period of record at Chicken, which is now almost 20 years.
The tendency for cold late winter conditions at O'Brien Creek seems very likely to be a direct result of the steep nearby topography, which maintains long hours of shadow over the valley until well into spring. The topographic map below shows the situation, with terrain rising up steeply in most directions, and the photo below (courtesy of Rick Thoman) further illustrates the nature of the surroundings. The deep valley may also help shelter the valley floor from prevailing wind patterns, creating more frequent calm conditions.
The topographic map for Chicken (below, on a somewhat expanded scale) shows much less terrain variation in the vicinity of the station, and therefore it seems likely that both solar and wind-induced warming would have more of an effect on Chicken in late winter. As cold as Chicken is, then, it is not ideally situated for cold, as the deeper valleys of the Fortymile Country are capable of producing even colder winters on average.
Looking at all dates for which data is available from both O'Brien Creek and Chicken, we find that the November-March mean temperature was 0.5°F colder at O'Brien Creek; so overall it is a very small difference, and not statistically significant. However, the differences are larger in late winter and are strongly significant for both February and March. The chart below shows the mean daily maximum and minimum temperatures by month for the overlapping period of record; we see that differences are very small in November through January, but O'Brien Creek is colder in February and has lower minimum temperatures in March.
The November-March mean temperatures for each winter with mostly complete data are shown below, with the top pair of lines showing mean maximum temperatures and the middle lines showing mean minimum temperatures. The bottom pair of lines shows the differences between the two locations, with the scale on the right axis. The winter of 2005-2006 produced relatively warmer daily maximum temperatures at O'Brien Creek, but in most of the other winters O'Brien Creek was slightly colder. February mean temperatures were colder at O'Brien Creek in all but one winter, and in February 2007 the difference was a substantial 6.7°F. The 2006-2007 November-March mean daily minimum temperature of -30.6°F is remarkably cold and ranks up (down) there with the likes of Umiat, Arctic Village, and Allakaket for historic cold.
It's interesting to look at the absolute minimum and maximum temperatures observed at the two locations during the period of overlapping data; see below. As before, the green and black lines show the comparison for maximum and minimum temperatures, and the red and blue lines show the differences. For November through January there are no obvious systematic differences, but from mid-February through March the extremes become relatively colder at O'Brien Creek for both maximum and minimum temperature. So for example O'Brien Creek recorded -61°F on March 3, 2007, and -51°F on March 15, 2009, whereas the latest dates for -60°F and -50°F at Chicken are February 24 and March 4, respectively - and that's using the entire period of record at Chicken, which is now almost 20 years.
The tendency for cold late winter conditions at O'Brien Creek seems very likely to be a direct result of the steep nearby topography, which maintains long hours of shadow over the valley until well into spring. The topographic map below shows the situation, with terrain rising up steeply in most directions, and the photo below (courtesy of Rick Thoman) further illustrates the nature of the surroundings. The deep valley may also help shelter the valley floor from prevailing wind patterns, creating more frequent calm conditions.
The topographic map for Chicken (below, on a somewhat expanded scale) shows much less terrain variation in the vicinity of the station, and therefore it seems likely that both solar and wind-induced warming would have more of an effect on Chicken in late winter. As cold as Chicken is, then, it is not ideally situated for cold, as the deeper valleys of the Fortymile Country are capable of producing even colder winters on average.
Friday, December 25, 2015
50 Below Reached
The negative half-century mark (-50°F) was measured for the first time this winter in Alaska today (to my knowledge); the "lucky" spot was the Kanuti Lake RAWS (elevation 524') in the Kanuti National Wildlife Refuge. Kanuti Lake is about 40 miles southeast of Allakaket. The hourly observations, shown below, did not actually hit -50°F, but after rounding to the nearest degree the minimum temperature would be reported as -50°F (and a slightly lower reading presumably occurred at an intermediate time). Note the extreme rise in temperature between 10am and 11am AKST this morning, when the first stirring of a breeze apparently mixed out the (no doubt very shallow) surface-based inversion.
As far as I'm aware, the last time -50°F or lower was observed in Alaska was early last February. The Sag River/Pump #3 site came close on December 4, with -49°F, and Kanuti Lake was almost as cold (-48°F) on December 10. -50°F or colder is observed every winter somewhere in Alaska, although in some winters that is about as cold as it gets.
Here's a nice webcam photo from Arctic Village yesterday at solar noon, with the sun about 1° below the horizontal and some light ice fog evident near the ground. The airport reported -45°F at the time.
As far as I'm aware, the last time -50°F or lower was observed in Alaska was early last February. The Sag River/Pump #3 site came close on December 4, with -49°F, and Kanuti Lake was almost as cold (-48°F) on December 10. -50°F or colder is observed every winter somewhere in Alaska, although in some winters that is about as cold as it gets.
Here's a nice webcam photo from Arctic Village yesterday at solar noon, with the sun about 1° below the horizontal and some light ice fog evident near the ground. The airport reported -45°F at the time.
Wednesday, December 23, 2015
Strong Polar Vortex
It's been almost two years now since media discussion in the U.S. latched onto the idea of the "polar vortex" as a means of explaining the unusual cold that affected parts of the lower 48, while Alaska was - as usual - experiencing the opposite temperature anomalies. Google's search history shows the spike in interest in the term "polar vortex" in early January 2014.
From a scientific perspective, the discussion in 2014 was misplaced, as the real polar vortex is a phenomenon in the stratosphere that most certainly did not migrate southward into the upper Midwest; it seems the term was used to refer loosely to the southward displacement of cold air that often resides over northern Canada in winter in association with a cyclonic circulation in the troposphere.
The behavior of the real stratospheric polar vortex is actually much more interesting this winter, as the vortex is currently very intense - more so than ever previously observed at this time of year in the era of balloon observations back to 1948. Using an index of 10mb westerly wind speed from 50°N to 80°N, the average strength of the circulation since November 1 is more than 10% higher than in any previous year during this period (see the chart below). The polar vortex is a wintertime phenomenon, and according to the long-term normal, the 10mb wind speed in this latitude band usually peaks at just over 30 m/s in early January. However, this year the average since November 1 is over 39 m/s, and the wind speed reached 45 m/s on December 5, which was the earliest on record for such a strong circulation. (As an aside, the apparent long-term upward trend in the chart is more than a little interesting, although the data from the early years might be questionable, as 10mb observations were pretty thin back then.)
What does this mean for weather patterns down here at the surface? The strength of the stratospheric polar vortex is correlated with the Arctic Oscillation, which is a measure of the pressure gradient between middle and high latitudes, and of course this makes sense: we would expect a strong cyclonic circulation aloft to occur in tandem with a strong westerly flow at low levels. The magnitude of the correlation is not particularly strong, but nevertheless this year's tropospheric conditions bear out the relationship, as the AO has been significantly positive on average since the beginning of November. The 500mb height anomaly since November 1 (see below) shows lower than normal heights (pressure) from far eastern Russia to Greenland and the northern North Atlantic area. Unusual ridging over eastern North America and Europe has brought extremely unusual warmth, with many locations undoubtedly seeing their warmest December on record.
The map below shows the characteristic 500mb height pattern during 10 previous years in which the polar vortex was unusually strong in November and December. The locations of the ridges over eastern North America and Europe are quite similar to what has occurred this year, which suggests that the recent weather anomalies are probably closely connected to the polar vortex strength. In this sense, then, the media could be justified in blaming the excessive warmth on the polar vortex this winter; but I doubt they'll pick up that story.
The relationship between Alaska's weather and the polar vortex strength is not as clear, and more investigation might be worthwhile. However, I'll point out that low pressure in the Arctic basin, and a positive AO phase, are somewhat favorable for enhanced snowfall in Fairbanks, because lower pressure to the north favors a more westerly flow regime. The chart below shows that November-January snowfall is rarely low when the AO is significantly positive, and conversely a strongly negative AO greatly increases the odds of below-normal snowfall. With this in mind, I think we can place part of the blame for interior Alaska's snowy November on the strongly positive AO phase, although the details of the snowy weather were more closely tied to the pressure pattern in the North Pacific-Bering Sea-Alaska sector, and this is only partly related to the larger-scale AO phenomenon. With December so far being almost snowless in Fairbanks and Bettles, the AO phase is obviously only a small part of the story.
From a scientific perspective, the discussion in 2014 was misplaced, as the real polar vortex is a phenomenon in the stratosphere that most certainly did not migrate southward into the upper Midwest; it seems the term was used to refer loosely to the southward displacement of cold air that often resides over northern Canada in winter in association with a cyclonic circulation in the troposphere.
The behavior of the real stratospheric polar vortex is actually much more interesting this winter, as the vortex is currently very intense - more so than ever previously observed at this time of year in the era of balloon observations back to 1948. Using an index of 10mb westerly wind speed from 50°N to 80°N, the average strength of the circulation since November 1 is more than 10% higher than in any previous year during this period (see the chart below). The polar vortex is a wintertime phenomenon, and according to the long-term normal, the 10mb wind speed in this latitude band usually peaks at just over 30 m/s in early January. However, this year the average since November 1 is over 39 m/s, and the wind speed reached 45 m/s on December 5, which was the earliest on record for such a strong circulation. (As an aside, the apparent long-term upward trend in the chart is more than a little interesting, although the data from the early years might be questionable, as 10mb observations were pretty thin back then.)
What does this mean for weather patterns down here at the surface? The strength of the stratospheric polar vortex is correlated with the Arctic Oscillation, which is a measure of the pressure gradient between middle and high latitudes, and of course this makes sense: we would expect a strong cyclonic circulation aloft to occur in tandem with a strong westerly flow at low levels. The magnitude of the correlation is not particularly strong, but nevertheless this year's tropospheric conditions bear out the relationship, as the AO has been significantly positive on average since the beginning of November. The 500mb height anomaly since November 1 (see below) shows lower than normal heights (pressure) from far eastern Russia to Greenland and the northern North Atlantic area. Unusual ridging over eastern North America and Europe has brought extremely unusual warmth, with many locations undoubtedly seeing their warmest December on record.
The map below shows the characteristic 500mb height pattern during 10 previous years in which the polar vortex was unusually strong in November and December. The locations of the ridges over eastern North America and Europe are quite similar to what has occurred this year, which suggests that the recent weather anomalies are probably closely connected to the polar vortex strength. In this sense, then, the media could be justified in blaming the excessive warmth on the polar vortex this winter; but I doubt they'll pick up that story.
The relationship between Alaska's weather and the polar vortex strength is not as clear, and more investigation might be worthwhile. However, I'll point out that low pressure in the Arctic basin, and a positive AO phase, are somewhat favorable for enhanced snowfall in Fairbanks, because lower pressure to the north favors a more westerly flow regime. The chart below shows that November-January snowfall is rarely low when the AO is significantly positive, and conversely a strongly negative AO greatly increases the odds of below-normal snowfall. With this in mind, I think we can place part of the blame for interior Alaska's snowy November on the strongly positive AO phase, although the details of the snowy weather were more closely tied to the pressure pattern in the North Pacific-Bering Sea-Alaska sector, and this is only partly related to the larger-scale AO phenomenon. With December so far being almost snowless in Fairbanks and Bettles, the AO phase is obviously only a small part of the story.
Saturday, December 19, 2015
Winter Temperature Variance
I'll present this more or less without comment, as I'm feeling a bit under the weather this weekend (no pun intended); but I thought it would be interesting to examine the long-term changes in variance of temperature during winter in Fairbanks. As we've noted before, there were some remarkable extremes in the 1930s; so has there been a long-term decrease in temperature variance?
The answer is yes. The chart below shows the November-March standard deviation of daily, weekly, and 30-day mean temperature anomalies, with the anomalies calculated relative to contemporary normals (which have warmed substantially over time). The variance has decreased at a similar percentage rate for each time scale from daily through 30-day mean temperatures. We can conclude that the modern winter climate of Fairbanks has somewhat less variability of temperature than in earlier decades prior to about 1980.
What does the decreasing variance look like in practice? The charts below show daily temperature anomalies for 1950-51, which had daily and 30-day variance very close to the 1930-1959 averages, and for 1993-94, which was very similar to the 1985-2014 average. The decrease in variance is about 10% on both time scales, which is small but arguably just about perceptible on the charts.
The winter with the highest combined daily and 30-day variance was 1980, and that with the lowest was 1987 (interestingly the latter coming at the end of a strong El Niño episode).
The answer is yes. The chart below shows the November-March standard deviation of daily, weekly, and 30-day mean temperature anomalies, with the anomalies calculated relative to contemporary normals (which have warmed substantially over time). The variance has decreased at a similar percentage rate for each time scale from daily through 30-day mean temperatures. We can conclude that the modern winter climate of Fairbanks has somewhat less variability of temperature than in earlier decades prior to about 1980.
What does the decreasing variance look like in practice? The charts below show daily temperature anomalies for 1950-51, which had daily and 30-day variance very close to the 1930-1959 averages, and for 1993-94, which was very similar to the 1985-2014 average. The decrease in variance is about 10% on both time scales, which is small but arguably just about perceptible on the charts.
The winter with the highest combined daily and 30-day variance was 1980, and that with the lowest was 1987 (interestingly the latter coming at the end of a strong El Niño episode).
Tuesday, December 15, 2015
December 1934 Chinook
A few weeks ago reader Mike suggested that we take a look at the great chinook event of December 1934, which brought record-breaking warmth to interior Alaska and led to the only "brown" Christmas in Fairbanks history. The magnitude of the warm anomaly was so extreme that nothing really comparable has happened in the 8 decades since.
To set the stage, Fairbanks had experienced a dry early summer (4th driest June on record) but a rather wet August, followed by a mild and very dry autumn (2nd driest October-November on record). By November the Pacific Decadal Oscillation (PDO) phase was significantly positive, as cool ocean temperatures dominated the central North Pacific and waters were relatively warmer along the North American coast (see figures below). However, temperatures in the tropical Pacific were near normal, with neither El Niño nor La Niña conditions in play. The Atlantic Multidecadal Oscillation (AMO) was in a long-term positive phase, but Atlantic waters were not particularly warm overall in late 1934, and the 1934 Atlantic hurricane season had been inactive compared to surrounding years. In the lower 48 the summer of 1934 was extremely hot and dry as the Dust Bowl drought intensified.
The synoptic conditions that led to the December chinook and heat wave are illustrated in the figures below, which are taken from the 20th Century Reanalysis. The left column shows maps of daily mean 500mb height from December 1-10, and the right column shows the corresponding maps for sea-level pressure. As we would expect, the event involved an intense trough over the Bering Sea and an enormous ridge over southeast Alaska and western Canada, with an extremely strong and persistent pressure gradient between the two features leading to southerly flow from the sub-tropics into far northern latitudes. While the magnitude of the anomalies was huge, the persistence of the setup was perhaps even more astonishing.
The highest temperatures observed during the period December 1-10 are shown in the map below. The interior Alaska "winner" was Nenana, with 61°F on December 8. Fairbanks reached 58°F on the 5th, but even more remarkably exceeded 50°F for 5 consecutive days from the 4th through the 8th. These are the only December days in Fairbanks history to have reached 50°F, and only a couple of other days have exceeded 50°F from November through February (November 25, 1936 and January 16, 2009). The highest temperature observed statewide was 64°F at Sitka Magnetic Observatory on the 8th.
Overnight minimum temperatures were also extremely high for the time of year, with Fairbanks recording its only instance of a 40°F daily minimum temperature between October 21 and April 18. The ability of temperatures to stay so high throughout the long hours of December night was aided by the elimination of snow cover with the first 50°F day on the 4th, and the snow cover was then reported at zero from the 5th through the 11th. The rapid loss of snow cover was in turn helped by the lack of earlier snow pack resulting from the dry autumn; there was only 1 inch on the ground on November 28, and a few inches that fell just prior to the chinook quickly melted out. Snow cover was not regained permanently until December 26, so Fairbanks missed out on a white Christmas for the only time in its history.
The magnitude of the warm anomaly can also be appreciated by comparing the observed temperatures to the 1981-2010 normals. The December 5, 1934 daily mean temperature of 49°F was 51.6°F above the 1981-2010 normal, which is the largest warm anomaly of any day in Fairbanks history. Of course the modern climate is warmer than that of the early 20th century - the difference is about 5°F in December - so actually the anomaly was more like 55°F in comparison to the earlier normal. I would guess that the list of places in the world that have ever been 55°F above normal is fairly short.
For the week ending December 9, 1934, the weekly mean temperature was 41.4°F above the 1981-2010 normal; the next warmest week was in January 1981 (37.8°F above normal).
Reader Mike speculated that such an anomalous event might occur about once every 200 years. If we assume the true peak daily anomaly was +55°F, and if we assume the variance is unchanged over time, then the December 5 anomaly was a little less than +4 standard deviations. In a Gaussian distribution, a +4 SD anomaly would occur once every 31574 days on average, or once every 86 years; so the chance of this happening in any one winter (November-March) might be about 1 in 200. Good guess, Mike! The only additional comment I would make is that this is just a rough estimate, because the temperature variance is unlikely to be stable over time; it is subject to long-term trends and also probably depends on multi-decadal or longer timescale behavior of major climate phenomena like the PDO or ENSO. As I suggested here, it seems that the climate regime of the 1930s may have favored high-amplitude circulation anomalies near Alaska, and of course it may not be a coincidence that the Dust Bowl occurred in the same decade.
To set the stage, Fairbanks had experienced a dry early summer (4th driest June on record) but a rather wet August, followed by a mild and very dry autumn (2nd driest October-November on record). By November the Pacific Decadal Oscillation (PDO) phase was significantly positive, as cool ocean temperatures dominated the central North Pacific and waters were relatively warmer along the North American coast (see figures below). However, temperatures in the tropical Pacific were near normal, with neither El Niño nor La Niña conditions in play. The Atlantic Multidecadal Oscillation (AMO) was in a long-term positive phase, but Atlantic waters were not particularly warm overall in late 1934, and the 1934 Atlantic hurricane season had been inactive compared to surrounding years. In the lower 48 the summer of 1934 was extremely hot and dry as the Dust Bowl drought intensified.
The synoptic conditions that led to the December chinook and heat wave are illustrated in the figures below, which are taken from the 20th Century Reanalysis. The left column shows maps of daily mean 500mb height from December 1-10, and the right column shows the corresponding maps for sea-level pressure. As we would expect, the event involved an intense trough over the Bering Sea and an enormous ridge over southeast Alaska and western Canada, with an extremely strong and persistent pressure gradient between the two features leading to southerly flow from the sub-tropics into far northern latitudes. While the magnitude of the anomalies was huge, the persistence of the setup was perhaps even more astonishing.
|
| |
The highest temperatures observed during the period December 1-10 are shown in the map below. The interior Alaska "winner" was Nenana, with 61°F on December 8. Fairbanks reached 58°F on the 5th, but even more remarkably exceeded 50°F for 5 consecutive days from the 4th through the 8th. These are the only December days in Fairbanks history to have reached 50°F, and only a couple of other days have exceeded 50°F from November through February (November 25, 1936 and January 16, 2009). The highest temperature observed statewide was 64°F at Sitka Magnetic Observatory on the 8th.
Overnight minimum temperatures were also extremely high for the time of year, with Fairbanks recording its only instance of a 40°F daily minimum temperature between October 21 and April 18. The ability of temperatures to stay so high throughout the long hours of December night was aided by the elimination of snow cover with the first 50°F day on the 4th, and the snow cover was then reported at zero from the 5th through the 11th. The rapid loss of snow cover was in turn helped by the lack of earlier snow pack resulting from the dry autumn; there was only 1 inch on the ground on November 28, and a few inches that fell just prior to the chinook quickly melted out. Snow cover was not regained permanently until December 26, so Fairbanks missed out on a white Christmas for the only time in its history.
The magnitude of the warm anomaly can also be appreciated by comparing the observed temperatures to the 1981-2010 normals. The December 5, 1934 daily mean temperature of 49°F was 51.6°F above the 1981-2010 normal, which is the largest warm anomaly of any day in Fairbanks history. Of course the modern climate is warmer than that of the early 20th century - the difference is about 5°F in December - so actually the anomaly was more like 55°F in comparison to the earlier normal. I would guess that the list of places in the world that have ever been 55°F above normal is fairly short.
For the week ending December 9, 1934, the weekly mean temperature was 41.4°F above the 1981-2010 normal; the next warmest week was in January 1981 (37.8°F above normal).
Reader Mike speculated that such an anomalous event might occur about once every 200 years. If we assume the true peak daily anomaly was +55°F, and if we assume the variance is unchanged over time, then the December 5 anomaly was a little less than +4 standard deviations. In a Gaussian distribution, a +4 SD anomaly would occur once every 31574 days on average, or once every 86 years; so the chance of this happening in any one winter (November-March) might be about 1 in 200. Good guess, Mike! The only additional comment I would make is that this is just a rough estimate, because the temperature variance is unlikely to be stable over time; it is subject to long-term trends and also probably depends on multi-decadal or longer timescale behavior of major climate phenomena like the PDO or ENSO. As I suggested here, it seems that the climate regime of the 1930s may have favored high-amplitude circulation anomalies near Alaska, and of course it may not be a coincidence that the Dust Bowl occurred in the same decade.
Subscribe to:
Posts (Atom)