Showing posts with label Stratosphere. Show all posts

Wednesday, November 26, 2025

Stratospheric Disruption

Meteorologists around the Northern Hemisphere have been excitedly watching events high up in the stratosphere recently, as the circulation aloft has become very unusual for the time of year.

Normally at this point on the calendar there is a robust vortex of cold air circulating high above the Arctic, but in recent days this vortex has been pushed well off its axis by a big ridge over the Canadian side of the Arctic.  The anomaly is ongoing; here's a forecast pressure map for Friday at the 10mb level, or about 100,000 feet above sea level.


The average 10mb westerly wind at 60°N is hovering around zero, which is approximately the weakest it's ever been at this time of year; more typical values are 20-40 m/s (45-90 mph).  The green line in the chart below shows the recent evolution of this closely-watched "U10/60" index, and the red line shows a forecast.


What does this have to do with Alaska, you may ask?  Well, the high pressure anomaly aloft also extends down through the lower stratosphere and the troposphere, so it's connected to the surface-level weather pattern over Alaska.  Here are maps for Friday at 100mb (about 50,000 feet) and 500mb (18,000 feet):


As of this morning, the 500mb ridge is centered over the Chukchi Sea, bringing relatively clear skies and cool northeasterly flow to northern and western Alaska:


Forecasters like to watch the stratospheric winds because they tend to foreshadow circulation patterns at lower levels, sometimes giving valuable information weeks in advance of important pattern changes.  In other words, what happens in the stratosphere doesn't stay in the stratosphere.

For instance, here's an analysis of 500mb heights 10-40 days following previous dates this century when the 10mb 60°N westerly wind dropped to zero in winter.  Above-normal heights near Greenland in the map below signify a negative Arctic Oscillation, a well-known effect of such "sudden stratospheric warming" events.


Closer to home in Alaska, there tends to be a trough over northern Alaska and a ridge over the Gulf of Alaska, and that is usually a mild setup for southern Alaska:


More strikingly, there is a strong wet signal for western Alaska: liquid-equivalent precipitation is commonly above normal in the month or so after these major stratospheric disruptions.


It will be interesting to see if the historical pattern plays out this time around.  CPC does show a strong wet signal in the 6-10 day period, but focused on the eastern interior at this time:



Wednesday, April 5, 2023

Winter Lives

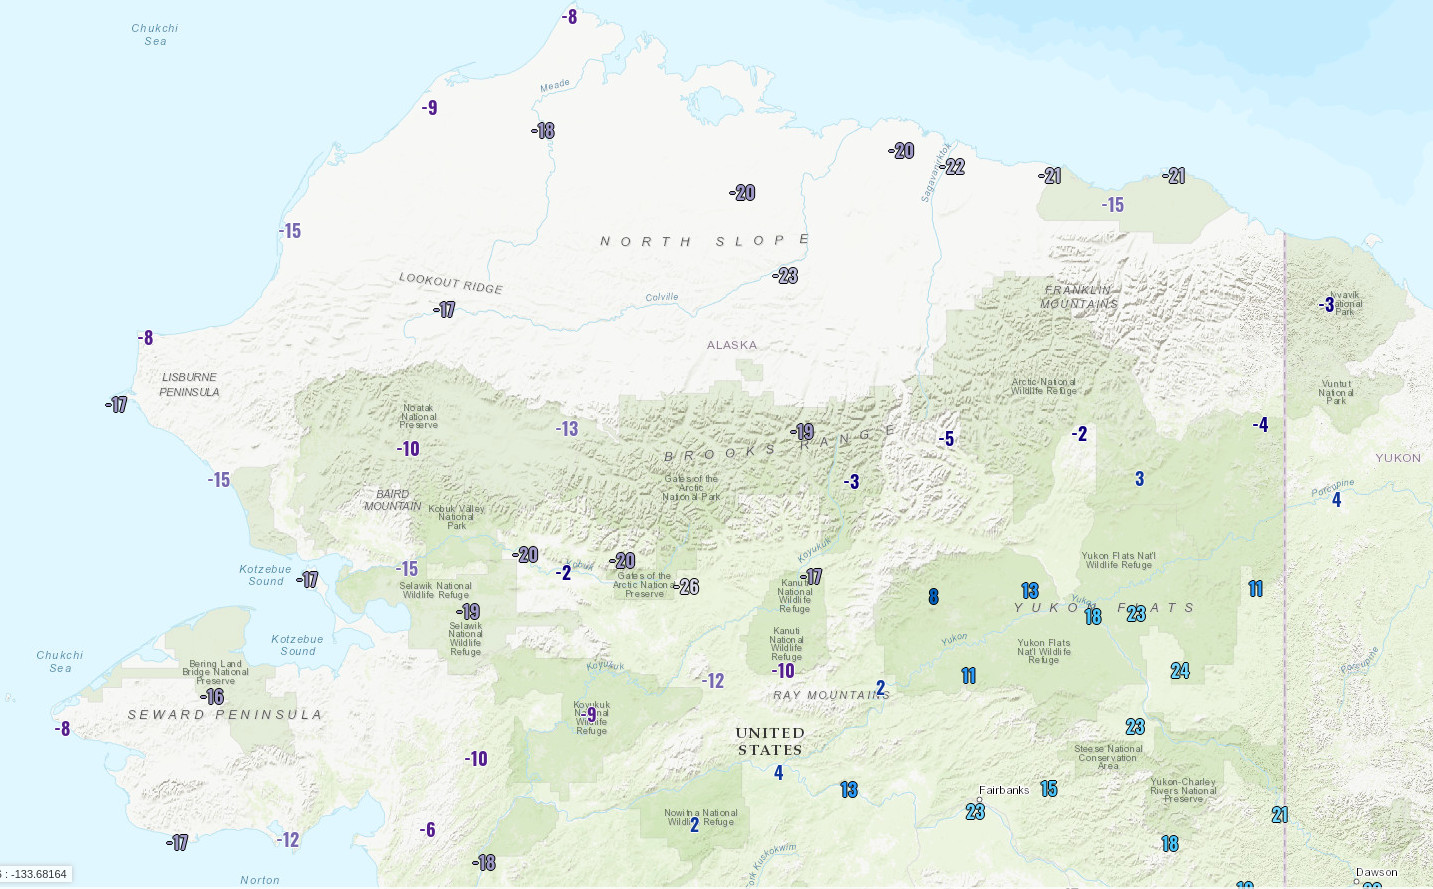
Winter is lingering in northwestern Alaska and the North Slope, where a cold air mass has been reinforced in the past couple of days by an upper-level low developing just to the north of Alaska.  Temperatures were in the teens and 20s below zero Fahrenheit this morning across a wide area, and the wind chill dropped to near 50 below at Deadhorse (for example).  Pretty chilly for a location with nearly 15 hours of daylight.

Here are minimum temperatures since midnight:


It's interesting to see a notable cold signal for much of Alaska in the CPC's latest 6-10 and 8-14 day outlooks:


I'll be curious to see if Alaska can manage a cold April overall, because I've long held a hypothesis that a disruption to the stratospheric "polar vortex" in January or February can sometimes (not always) produce a cold pattern for Alaska at this time of year.

The spectacularly cold spring of 2013 is the poster child for this idea: there was a major "sudden stratospheric warming" (SSW) in early January, and the effects definitely lingered for months in the boreal high-latitude circulation.  2006 and 2009 were also notably cold for Alaska in March-April, following January stratospheric warming events.  More recently, 2021 was cold, but less so, and 2018 and 2019 were warmer than normal, especially in March; all of these years had SSW events.

We had a major SSW this winter on February 16, so let's see how the next few weeks play out.  Late breakup, anyone?  There are still a few hours left today to make a guess on breakup at Nenana...

Wednesday, February 7, 2018

Warmth to Return

The southern and eastern interior of Alaska has seen a decent spell of cold weather in the past couple of weeks, but it's on the way out now, and unseasonable warmth looks likely to return in the near future.  The chart below puts the recent cold in perspective relative to the anomalous warmth earlier in the winter; notice how few days have been more than 1 standard deviation below normal, compared to the many days of 1SD or more above normal.

As chilly as the recent spell may have seemed, the departure from normal for the past 2 weeks is "only" 14°F, which is quite modest for interior Alaska; the 2 weeks ending December 19 were over 23°F above normal.


The impending shift back to warmth is partly related to a very dramatic weather event that is unfolding in the stratosphere: a "sudden stratospheric warming" (SSW).  In these events, which occur a few times a decade, there is a weakening and disruption of the winter-time vortex of westerly winds that usually prevails in the stratosphere above the Arctic.

In some SSW events the vortex is merely weakened and displaced away from the pole, but in the more dramatic cases the vortex splits or breaks down completely and the flow reverses to easterly around the pole for a time.  The upcoming SSW will be of the latter variety; the two maps below, courtesy of tropicaltidbits.com, show the change over the course of a week beginning last Sunday.  The second map shows that the vortex will split into two daughter vortices by this Sunday, with high pressure and anticyclonic flow in the middle.


These events are followed very closely in the long-range forecast community, because the disruption of the vortex usually works its way down to the troposphere and leads to a weakening of the westerly flow closer to the surface in the subsequent weeks.  This in turn often allows blocking high pressure to set up and cold air to spill south into the mid-latitudes, and in particular Europe and western Asia have a strong tendency to be cold in the weeks following a SSW.  Conversely, the blocking pattern tends to favor unusual warmth in southern and interior Alaska as low pressure sets up over the Bering Sea.

Of course the SSW isn't the only driver of the current circulation pattern, but the latest long-range forecasts are certainly quite consistent with the expected SSW impacts.  Here are the latest MSLP and temperature forecasts for the North Pacific sector over the next 6 weeks from NOAA's CFSv2 model; the maps show the ensemble mean forecast anomaly of MSLP (left) and temperature (right) relative to a 2000-2016 normal.  Based on this forecast, it wouldn't be a surprise to see some record breaking warmth in Alaska in the next several weeks.

Week 1


Week 2


Week 3


Week 4


Week 5


Week 6


Sunday, May 22, 2016

Stratospheric Connection

A couple of weeks ago Rick Thoman pointed out that Barrow had their windiest April on record, by a large margin - see the chart below.  According to the GHCN data, the average wind speed was above 20 mph on 15 days, which is a record for any month.  Interestingly the all-time windiest calendar month in Barrow (1984-present, GHCN) was just 2 months earlier, in February of this year.


The map below shows why it was so windy in April on the North Slope (graphic courtesy of Brian Brettschneider).  The sea-level pressure was the highest on record for April over the Beaufort Sea, and yet the SLP was below normal over nearly all of Alaska, and well below normal over the west and southwest.  Consequently the pressure gradient across the North Slope was intense.


The record high pressure north of Alaska in April is intriguing, because it occurred in the wake of a remarkably strong stratospheric warming event back in March.  It is well-known that sudden stratospheric warming events create high pressure anomalies that propagate down to the troposphere over the course of several weeks, and so I suggest that there was a chain of causality between the upper-level warming event and the April high pressure.

The following figure illustrates the downward propagation of the flow disturbance in the recent event; this is a time-height cross-section of geopotential height anomaly over the Arctic (a height anomaly is equivalent to a pressure anomaly).  Beginning in early March, a pronounced positive height anomaly emerged high in the stratosphere, reflecting the complete breakdown of the polar vortex that occurred in the dramatic "sudden warming" event.  Note that earlier in the winter the stratospheric vortex was extremely strong (i.e. lower than normal heights), as we noted in December.


It's pretty clear from the figure that the height anomaly propagated down from the stratosphere to the troposphere and eventually to the surface between mid-March and late April.  Again, this is a typical course of events after a sudden stratospheric warming.  As an aside, this provides an unusually extended and useful window of predictability for high-latitude weather patterns in the troposphere.

The map below shows the standardized height anomaly at 850mb during the first 3 weeks of April, when the wind was particularly strong in Barrow.  The high pressure was centered about 500 miles north of Prudhoe Bay and produced a strong easterly flow along the Arctic coast of Alaska.

As we look at pressure levels higher up in the troposphere and stratosphere, the high pressure anomaly becomes more expansive and - by the time we get to 100mb - very intense.


Finally, it's revealing to look at the evolution of 850mb anomalies over consecutive 10-day periods from late March to early May - see the maps below.  In the last 10 days of March there was no high pressure evident in the Arctic at 850mb, although the stratospheric anomalies were already very intense at that time.  High pressure then emerged north of Alaska in early April and intensified and expanded in mid-April; and by late April high pressure was very widespread north of the Arctic Circle, and the Arctic Oscillation was strongly negative. 


In summary, a quick look at the reanalysis data suggests that the Beaufort Sea high pressure in early-mid April was the first manifestation of a "surge" of high pressure anomalies originating high in the stratosphere about a month earlier.  The lower-tropospheric anomaly subsequently expanded throughout the Arctic and set up a notable blocking pattern over the North Atlantic, which led to some remarkably cold conditions in Europe in late April - and I can attest to that, having seen snow fall on multiple days while in England and Wales at that time.  From the North Slope of Alaska to Europe it was a most unusual month, and I think it's clear that the stratospheric disruption was at least partially to blame.

Saturday, February 6, 2016

January Arctic Warmth

A blog post by Weather Underground's Bob Henson caught my eye on Thursday, as he discussed the extraordinary warmth that occurred in the Arctic basin during January.  To put this in context, I calculated the 60-90°N area-average mean temperature at 925mb (about 2200' elevation) for each January since 1950, according to the NCEP/NCAR reanalysis; the results are shown below.  The temperatures last month set a new record for January warmth in the reanalysis era, by a large margin.


It's interesting to see that a similar kind of outlier (for the time) occurred in January 1977, which is the winter that we've recently discussed as being very warm in Fairbanks.  January 1977 occurred just after the "great Pacific climate shift" and the onset of what turned out to be an enduring positive phase of the PDO.  One wonders if this means that the next decade or two will see a continuation of the positive PDO phase that we've observed in the past 2 years: have we just passed through another major Pacific climate shift?  From an Alaska-centric viewpoint, have we shifted into a new normal of winter warmth, as happened in the decades following 1976?  Let's hope not.

Looking at daily 925 mb temperatures since the beginning of 2015, the Arctic (and sub-Arctic) area has seen persistently above-normal temperatures, but since late December the area-average temperatures have been near or above previous record levels for the time of year.


On the chart below I've added the daily temperatures for the past two very strong El Niño events, 1997-98 and 1982-83, and we can see that neither of those winters produced unusually warm conditions over the Arctic, at least through January.  This suggests that we shouldn't pin the blame for the recent warmth on El Niño.  It has more to do with the transition to a strongly negative Arctic Oscillation at the beginning of January, which allowed cold air to spill south into the mid-latitudes and, conversely, warm air to invade the Arctic from the south.  I believe there is also a close connection to the stratospheric polar vortex, which was extremely intense in November and December, but began to undergo a weakening trend in January.


The following maps show the January temperature's departure from normal beginning at the surface, moving up through the troposphere (up to 300mb) and into the stratosphere.  There is a dramatic transition from extremely warm conditions in the lower-to-mid troposphere to unusually cold conditions in the stratosphere; note that I've doubled the range of the scale on the last two maps to accommodate the magnitude of the cold anomaly aloft.  The cold in the stratosphere was associated with the strength of the polar vortex, which remained much greater than normal in January.