Saturday, October 31, 2015

Snowfall Variability

Some weeks ago reader Tracy asked whether mean annual snowfall has increased over time in the interior.  I've been remiss in not addressing this more quickly.  Looking first at Fairbanks (see below), the annual (July to June) snowfall totals are of course enormously variable, which makes it difficult to say whether the data reflect an overall long-term trend.  However, it's clear that snowfall has been on the low side in the past couple of decades, with few winters having more than 60" of snow, and the 10-year running mean has dropped back substantially from where it was in the 1990s.  It seems safe to say that the long-term trend towards earlier first snow and earlier arrival of the winter snowpack is not associated with an overall increase in winter snowfall.


If we break the annual snowfall totals into early winter (October-December) and mid-late winter (January-March), we see that the snowfall decrease in recent years is somewhat more pronounced in the first half of winter (see below); or perhaps we should say that the snowy winters of about 1965-1995 were mainly caused by increased snowfall in early winter.  The early winter snowfall since about 1995 has been commensurate with the climate of the 1930s, 40s, and 50s.  It's curious to note here that the Atlantic Multidecadal Oscillation (AMO) changed from positive to negative in the mid-1960s and then switched back to positive in 1995 - could this be more than a coincidence?  This will be a topic for future investigation.


Compared to the early winter snowfall, the January-March snow totals have less decadal and multi-decadal variability, although the annual variance is about the same.  Another way of looking at this is that January-March snowfall seems to vary almost randomly from year to year, whereas consecutive October-December snowfall totals have a small autocorrelation and thus a tendency to remain on one side or the other of normal.  Obviously we are in a "low early winter snow" regime at present.  Admittedly we don't have a long enough history to say if these conclusions are robust, but it's an interesting aspect of the data that we do have.

Time doesn't permit a detailed examination of other interior locations, but a quick look at McGrath and Bettles indicates some notable differences from Fairbanks.  McGrath has seen some very low snow years recently, but other winters have been snowy; the variance has become higher, as we saw here.  In Bettles there has been less of a decrease in recent years and the 60+ year trend is up.  Note that both Bettles and McGrath have less interannual variability in snow totals than Fairbanks; the standard deviation of annual amounts is 32-33% of the mean in Bettles and McGrath, but it's 41% in Fairbanks (for 1951-2014, the period of overlapping data).


Wednesday, October 28, 2015

The Inevitable Arrives

Winter is now right on the doorstep in Fairbanks, as October's remarkable stretch of stable, mild temperatures is about to come to an end.  Accumulating snow appears likely tomorrow and at various times in the next week, and temperatures will drop sharply by the weekend.  The only unusual aspect of this is that it hasn't happened already; the normal low temperature will be down to +3°F by Sunday.

Fairbanks airport has not yet seen a single day with a high temperature at or below 32°F, and this breaks the 1930-present record for latest first occurrence of such a day (previous record October 27, 1938).  Of course it very nearly happened several weeks ago, when the high was 33°F for 3 consecutive days (Sep 29 - Oct 1).  Also I don't believe there are any other stations in the Fairbanks area that remain without a sub-freezing day; Fairbanks airport has been an island of warmth.

The chart below shows how unusual the warmth has been lately, with daily mean temperatures remaining more than 1 standard deviation above normal for 13 consecutive days (including today).  Reader Mike noted that there was actually no downward slope to temperatures for a several week period ending October 23; this was true for up to a 30-day period ending on that date.  It is unusual to have such a long period of stagnant temperatures at this time of year, but not extremely so; there have been a number of other years with similar occurrences, such as in 1938 when the temperature showed no decline for a 40-day period ending October 26.


A more unusual aspect of recent temperatures has been the sheer lack of variation; it has not been cold, but neither has it been extremely warm, and lately each day has been much the same as the previous one.  The lack of variance is actually unprecedented for the time of year, as the chart below demonstrates; in other words, the 30-day running variance is lower than ever observed before on this date.  Remarkably, it was lower recently than at any point during summer, which is usually when temperatures are least variable.


Looking at the long-term history of variance at this time of year reveals no obvious trend over the full climate record (see below; the dashed line shows the long-term median).  But it's interesting to note that low variance has been more common since the mid-2000s, and the last 3 years have all been notable in this regard.  Of course this goes along with a tendency for cold in late September and relative warmth in October.


Finally, for future reference, here are a few webcam photos from today to document the state of freeze-up at a few locations:


Monday, October 26, 2015

Dalton Highway Precipitation

Many readers will recall that the Sagavanirktok River underwent severe flooding last spring, causing a lengthy closure of northern stretches of the Dalton Highway.  A recent media report described efforts to raise portions of the highway during the past several months, using more than a million tons of gravel, in the hope that future flooding may prove less damaging.  On this blog I suggested that high precipitation in the previous year (2014) was partly responsible for the massive overflow flooding, and so I thought it would be interesting to look at how this year's precipitation compared to 2014.

The chart below shows an update of the chart I showed before, consisting of annual (water year, October through September) precipitation totals at 3 SNOTEL sites along the Dalton Highway.  The Sagwon site is located about halfway between Imnaviat and Prudhoe Bay, as seen in the map below.  It's clear that the year ending September 30, 2015 was slightly less wet than the previous year, and was not particularly unusual at either Imnaviat Creek or Prudhoe Bay.  However, it was wetter than normal again at Sagwon, and the 3-year running mean precipitation is higher than at any previous time.


The accumulation of precipitation through the warm season at Sagwon was quite similar this year to last year; there was a notable wet spell around the beginning of June, and then a substantial rainfall surplus accrued by the end of summer (see below).


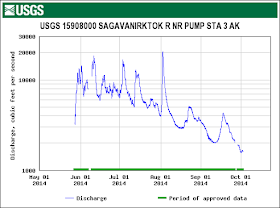
It's interesting to compare the 2014 and 2015 streamflow measurements from the Sag River streamflow gage near Pump Station #3 (see below, 2014 on top, 2015 below).  After the initial high discharge in late spring 2015, this year's flow was substantially lower, with no peaks above 10000 cfs during the summer months.  The August rains produced a notable flow spike, but then the flow dropped back to near 1000 cfs in late September when the station stopped reporting.  The 3rd chart below, which zooms in on August and September this year, and includes a long-term normal, indicates that the flow was close to normal by the end of the season.  However, the rapid flow reduction in mid to late September probably also reflects the unusually cold conditions that occurred then; it seems likely that groundwater levels remain above average.


In conclusion, it appears that wet conditions continued in summer 2015 along the mid-Sag River, leading to above-normal river discharge in the latter part of the season.  Although the anomalies were less extreme than in 2014, it seems quite possible that prevailing high groundwater levels may lead to more flooding problems next year.


Saturday, October 24, 2015

Beaufort Sea Freeze-Up

Just a quick note to report that yesterday's NWS sea ice analysis showed sea ice of more than 50% concentration extending from the Alaska coastline to the Arctic pack for the first time this season.  The rate of freeze-up appears to be similar to the average of recent years; the last time the ocean surface was more or less completely frozen up east of Point Barrow by this date was in 2001.


The NWS ice stage analysis indicates that multi-year ice is now confined to regions north of 74°N (except north of Canada), and this is a change from August, when there was old ice at 72°N to the north of Prudhoe Bay (as we discussed here).
Barrow has been trending steadily warmer relative to normal this month, which is not in the least surprising on account of the warming influence of nearby open water.


Friday, October 23, 2015

Warming Permafrost

A pair of articles related to North Slope environmental conditions caught my eye recently, one concerning warming permafrost and the other regarding Dalton Highway construction in response to flooding last spring.  I'll say a few words about the former today and look at the latter in a subsequent post.

In the first article, Vladimir Romanovsky of UAF is quoted as expressing astonishment at rapid rates of warming in permafrost near the Arctic coast, particularly in the last decade.  I'm not familiar with the literature of permafrost studies, so I haven't found published results illustrating the recent trends, but I did find some informative figures at the permafrost database site.  Looking at the "west dock" measurement location at Prudhoe Bay, the following figure shows a striking trend of long-term warming through 2010, and if the professor was accurately quoted, then I'm sure the trend has continued or even accelerated in the past 5 years.
The following chart only extends through 2007, but it shows a similar pattern of significant warming.


A third chart from the database site focuses on temperatures close to the surface, and in this case there is no obvious trend.


I verified the lack of a warming trend in the near-surface temperatures by downloading the daily measurements at 0.85m depth - see below.  The summer peak in temperature at this particular location showed only a very small increase over the decade ending in 2012 (the most recent available).


If we look at air temperature measured near Prudhoe Bay (see below), we see that 2014 and 2015 year-to-date have brought some of the warmest conditions on record, and this may have produced the acceleration in sub-surface warming that the professor seems to be alluding to.  Note that the 1998 spike in temperatures appears to have been responsible for the rapid warming observed between 1998 and 1999 in the first chart above, so it's quite possible that a similar thing has happened again lately.  I'll see if I can obtain some more recent borehole data to document the latest changes.


A note on the chart above: I've combined the climate data from the old Prudhoe Bay observing site (through May 1999) with data from the Deadhorse airport just a few miles to the south (since June 1999).  Deadhorse is a bit colder, being located farther from the moderating influence of the ocean, so the warming trend would actually be a bit steeper if we had observations from the same location over the entire history.  Nevertheless, the temperature drop from 1998 to 1999 was definitely real, as a very similar drop was also observed at Barrow.

Wednesday, October 21, 2015

Lack of Cold

The absence of cold in Fairbanks this month is becoming unusual, with 19°F being the lowest temperature observed so far at the airport.  It was almost as cold last month prior to the first big snow.  In some years it is far colder by this date in October, with the median lowest temperature as of October 21 being +6°F.  In over a quarter of years (although only once since 2000) it has dropped below 0°F by this date.  In 1935, Fairbanks recorded a remarkable -27°F on October 25.

The range of possibilities for winter-to-date lowest temperature led me to wonder how this distribution varies over time, so of course I created a chart to address the issue - see below.  The range between lowest season-to-date minimum and highest season-to-date minimum expands rapidly in October, as some years see an early arrival of winter, but other years see an extension of autumn.  Two years ago the lack of cold was even more unusual in October, with the first sub-20°F reading not showing up until October 26.  That was of course also the most snowless October on record.  Recall how dramatically the temperatures dropped off in November 2013, however.


The thin black line on the chart shows the standard deviation of the 85-year distribution for each day.  We see that the variance stays high from late October through early December; however, it drops off a bit in middle and late winter, because even relatively warm winters usually see some kind of cold spell.

On a related note, Fairbanks has yet to see a high temperature at or below freezing, which is also becoming very unusual.  The latest date for a high temperature of 32°F or below is October 27, 1938.  Based on the NWS forecast, there's a chance this record could be broken, although tomorrow may preclude this as it seems likely to be rather cloudy and therefore a bit cooler in the afternoon.

Monday, October 19, 2015

Freezing Rain

Rain has been reported on each of the last 4 days in Fairbanks, with an occasional bit of snow mixed in.  Temperatures were hovering near freezing this morning, leading to icy conditions and provoking a winter storm warning from the National Weather Service.

As one might expect, freezing rain or rain at temperatures close to freezing is rather common at this time of year in Fairbanks, although it requires an unusually warm airmass aloft.  This morning's sounding from Fairbanks (shown below) revealed above-freezing temperatures from about 2000-4500 feet elevation, but sub-freezing conditions existed closer to the ground.  This means that rain falling out of the warm cloud layer aloft was chilled to or below freezing before reaching the ground, and so ice formed readily on ground-level surfaces in locations where the air was at or below freezing.


The history of hourly observations since 1950 (see chart below) shows that October has the highest frequency of freezing or near-freezing rain, with the phenomenon occurring in nearly 40% of all years.  The frequency peaks in mid-October, so today's event is right on schedule for this kind of thing.


The chart below shows that the distribution of October cold rain events has been fairly even through the years, although today's event is the first since 2006.  It seems freezing rain has taken a preference for deep winter in recent years.


Saturday, October 17, 2015

Yukon River at Eagle Ice Running

Richard noted in the previous post that ice was running down the Yukon River in Eagle. Is this typical? What drives the formation if ice in interior rivers?

Let’s deal with the questions in reverse order. Obviously you need below frezing temperatures for ice to form. But, it is not as simple as that. The drivers of river water temperature are very complicated. First, the top layer of water on a river needs to be at or slightly above freezing. This is largely driven by basin-wide characteristics of flow, air temperature, and the shortwave/longwave energy budget. The water flowing past Eagle mostly came from the Canadian Yukon Territory. There are nearly 1,100 river miles of the Yukon above Eagle and a basin area of 122,000 square miles. High flows mean greater stream velocities which delays freezup. High air temperatures also delay freezup. Especially cold temperatures early in the season have to overcome the still (relatively) strong solar radiation. All in all it is a complicated process. A nice summary of the processes is found in this document from UAF ( http://www.arlis.org/docs/vol2/hydropower/SUS102.pdf ). The document is more concerned with water temperature though.

For rivers like the Yukon, ice formation is initially dominated by the frazil ice process. Frazil ice is formed when supercooled water freezes on a condensation nuclei within the moving water. This generally happens when the low temperatures is in the lower 20s. As more and more frazil ice forms in the main channel, it clumps together – finally clumping enough to accumulate at river bends and to ultimately run across the width or the river.

The Cooperative observers in Eagle kindly made a notation of the first run of ice they saw for 22 different years between 1916 and 1960. During those years, the average first run date was October 18th. We should caution that a little bit of ice one year may be noted while another year required more substantial ice to warrant a notation. We will never know what the subjective criteria was. For this analysis, we assume they were consistent. Figures 1 and 2 show an example of notations made by the observer.


Figure 1. October 1920 Cooperative observer form for Eagle, Alaska.


 Figure 2. October 1947 Cooperative observer form for Eagle, Alaska.

Since frazil ice forms locally (i.e., doesn’t form in one spot and float for miles downstream), we expect that the formation is highly correlated to water temperature and air temperature. Unfortunately there are no good data sets for water temperature. Figure 3 shows the water temperature at Eagle in 2010. It’s the only data set that I found.


Figure 3. Water temperature for Yukon River at Eagle, Alaska. (from http://yukonriverpanel.com/salmon/wp-content/uploads/2011/04/ure-25n-10-yukon-temp-monitoring-on-yukon-trib.pdf )

Since we are then left with air temperature as the best proxy for ice formation, let’s see how well it correlates to freezing degree days. Figure 4 shows the ice run date for the 22 years that data is available (line) and the accumulated freezing degree days (bars). There really is very little correlation. Some years saw ice form with as little as 5-6 days of temperatures in the 20s. Other years saw 4-5 days in a row with temperatures dropping below zero before ice began forming. Figure 5 shows the relationship between accumulated freezing degree days (FDDs) and the date of ice running. Not much there.


Figure 4. First ice running date and accumulated freezing degree days for 22 years at Eagle as lines and bars.


Figure 5. First ice running date and accumulated freezing degree days for 22 years at Eagle as scatter plot.

Again, so much goes into the formation of ice. Is it clear or cloudy? Is it windy? Is the air dry or moist? Is new runoff entering the river? Is the flow fast or slow? Is it high or low? Lots to consider.

As a non–interior Alaskan, I welcome the opinions of those more knowledgeable on the subject than I am.

Friday, October 16, 2015

Snow Depth Graphic, Yukon Ice

Returning to the subject of the unusual September snowfall in Fairbanks this year, I created a different kind of graphic to illustrate the fate of all early autumn snowfall events in Fairbanks since 1930.  The chart below plots all non-zero snow depth observations from September 1 through October 15 in Fairbanks, with snow depth on the vertical axis and date on the horizontal axis.  Red markers indicate snow that subsequently melted out before the arrival of the permanent snowpack, and blue markers denote snow that stayed.  The "x" markers show the observations from 1992 and 2015.


A few features stand out on the chart.  First, this year's snowfall, despite being very unusual, was clearly much less anomalous than the 1992 event, which produced 10" on September 15.  Second, there have been other instances when 5-8" of snow in the first week of October melted out, so in retrospect it isn't too surprising that 11" on September 29 couldn't survive.  The 1992 event was accompanied by incredible cold that was arguably even more unusual than the snow.  Excluding 1992, there are hardly any blue markers prior to October 5, so it's very rare to see the permanent snowpack before that date.

The chart also illustrates that a snow depth above 4" after October 10 is very likely to survive; it's tough to melt snow in mid-October, even with sunshine and above-normal temperatures.  The downtown Fairbanks webcam shows traces of snow on the roof of the Yukon Quest HQ today, 10 days after the airport lost its snowpack, and after some unusually warm conditions.  The Goldstream Creek COOP near Fairbanks was still reporting 4" of snow on the ground as of yesterday morning.


On another note, there is now plenty of ice on the Yukon River at Tanana, as a result of some cold nights, particularly farther upstream; the Beaver RAWS was down to 2°F on Tuesday.  Here's a loop of the FAA webcam view in Tanana for most of the day today.


Update October 17: at least part of the Yukon is frozen over today at Beaver.


Wednesday, October 14, 2015

Radiation Budget

In Monday's post I alluded to the rapid net loss of infrared radiation in interior Alaska at this time of year, and reader Gary inquired about the processes that affect this mechanism of energy transfer; so I thought it would be helpful to go into a bit more detail on the answer.

The balance, or more accurately the imbalance, of infrared radiation across the Earth's surface is the fundamental driver of climate and weather variability, on timescales ranging from seconds to millenia.  Short-wavelength (shortwave) infrared radiation from the Sun heats the Earth's surface, and the surface emits long-wavelength (longwave) radiation back out to space.  Clouds and atmospheric gases such as water vapor and carbon dioxide also emit longwave radiation that is absorbed by the ground, and this is a major component of the surface radiation budget.  The relative magnitude of each of these radiative fluxes plays a large role in determining temperature changes at the surface, with the most obvious contrasts being those between day and night, and between summer and winter.

The rate of heating by shortwave radiation from the Sun is obviously affected by the time of year and of day, a location's latitude, the extent and character of cloudiness, and other factors like atmospheric aerosols (smoke, haze) and the degree of reflectivity (albedo) of the surface.  As for the longwave radiation emitted by the ground and by the atmosphere, the rate of emission is essentially determined by the temperature of the respective components, as per the Stefan-Boltzmann law.  So for example a warmer ground surface emits much more radiation upward than a cold surface; and a layer of low (warm) clouds aloft emits much more radiation downward than a clear sky.  (This is why cloudy nights are usually warmer than clear nights, and clouds bring warmth to interior Alaska in winter.)

It's an interesting exercise to develop a rough estimate of the radiation budget in the Fairbanks area.  We can do this using observed shortwave radiation data from the CRN site 11 miles northeast of Fairbanks; this site has measured shortwave radiation since mid-2002.  There are undoubtedly some differences between the CRN site and Fairbanks itself, but we'll ignore that for now.

The next assumption we make is that the radiation budget is in balance at both the summer peak of temperature and at the winter minimum of temperature; in other words, the following equation is satisfied on these dates:

absorbed shortwave + downward longwave = upward longwave

We know what the normal mid-summer and mid-winter temperatures are according to the 1981-2010 normals (63.7°F and -8.7°F at Fairbanks airport), so using Stefan-Boltzmann we can calculate the longwave radiation emitted upward from the ground at these temperatures.  Then given a balanced budget, this immediately gives us the downward longwave on these two dates.  The table below shows the results in terms of daily energy transfer; note that I've assumed a shortwave albedo of 0.132 on both dates.  (This is about right for mixed coniferous and deciduous forest in summer; it certainly should be higher in winter, but forested areas still have a fairly low albedo even with snow on the ground.  Of course, in the depths of winter the albedo doesn't make much difference as there is so little solar insolation.)

Summer temperature maximum
Absorbed shortwave4382 Wh
Upward longwave9726 Wh
Downward longwave5344 Wh

Winter temperature minimum
Absorbed shortwave17 Wh
Upward longwave5362 Wh
Downward longwave5344 Wh

With the arbitrary but realistic albedo choice that I made above, the estimated downward longwave radiation is (by design) exactly the same in summer and winter.  I don't know how close this is to the truth, but I suspect it is not a bad assumption; albedo constraints suggest that it can't be far from the truth.  If we proceed with the assumption that the downward longwave is constant throughout the year, we can then calculate the radiation imbalance for any day of the year.  The result is shown below.


Although I've made a few assumptions along the way - and this is admittedly a crude approach - the chart shows the basic features of the infrared radiation processes in interior Alaska.  The springtime gain in shortwave radiation outpaces the longwave losses, as the surface remains cold, and this leads to a radiation surplus and a warming trend.  In autumn, the direct solar radiation drops off more rapidly than the emitted longwave, because the surface remains warm, leading to a net loss of radiation.  We also see that autumn's peak rate of energy loss is greater than springtime's peak rate of gain, and so the temperature change is a bit more rapid in autumn than in spring.

Monday, October 12, 2015

Not Much Cooling

According to long-term normals, temperatures at this time of year are "normally" dropping like a rock in interior Alaska, as net infrared radiation loss takes a heavy toll.  The peak climatological rate of temperature drop in Fairbanks occurs on October 14 (6.2°F per week).  However, in the past 3 weeks the temperature hasn't dropped at all, as the circulation pattern has switched from unusual cold to unusual warmth.  Fairbanks reached 50°F yesterday, which is now well above the normal high of 36°F.  [But recall that I indicated on September 18 that it was unlikely that 50°F wouldn't be reached again.  If it hadn't, it would have broken a record.]


Looking at the last 10 days of September and the first 10 days of October this year, the latter period was actually warmer (35.2°F vs 33.7°F).  This is not too uncommon, having occurred 11 previous times since 1930, but prior to 1990 it only occurred 5 times in 6 decades.  In the 24 years from 1992-present, it has occurred 7 times.

Another way of looking at this change is that from 1930-1991, October 1-10 was colder than September 21-30 by 6.5°F on average.  However, from 1992-2015, the latter period was only 4.2°F colder on average.  So we could say the rate of cooling has diminished by over a third in the 3 weeks surrounding October 1.

Warm conditions notwithstanding, ice formation is now evident on the Yukon River at Beaver and Tanana:


No ice is yet visible on the Tanana at Nenana, however.


Saturday, October 10, 2015

Precipitation Trends

The recent wet September prompted me to look again at long-term precipitation trends in Fairbanks, especially in light of the hypothesis that increasing precipitation could be responsible for the trend towards earlier autumn snowfall.  In a post earlier this year, I showed that Fairbanks has become slightly drier over time (1930-present), but the only calendar month with a statistically significant trend is August, which has become drier at the 99% level of significance.

To look more closely at the variation in trends through the year, I calculated 30-day running precipitation totals and obtained a linear trend (1930-2014) for each day of the year.  I did this both for the actual precipitation amounts and also for the ranks of the values within the 85-year distribution.  The reason for this is that a single outlier year could throw off the least-squares trend calculation for the raw precipitation amounts, but the ranks won't suffer from this problem.  The chart below shows the results.


We see that most of the year (about 70% of it) has become drier over the 85-year history, regardless of whether we use the precipitation values or ranks.  The drying trend in August is very noticeable, as is a trend towards wetter conditions in July.  The rank trends show some other interesting peaks and troughs at various times of the year, some of which are no doubt caused by random sampling variability.

It's interesting to note that most of the autumn has become slightly drier, so the slight moistening trend in the month of September is an anomaly for the season as a whole.  The chart below shows the September precipitation totals since 1930.  We see that the early years (about 1930-1960) were relatively wet, then there was a drier spell in the 1960s and 1970s, and it has been wetter again since about 1990.  Thus when reader Gary comments that "late August to late September used to be the Golden Month", he might be recalling the drier decades in the middle part of the history.  The overall trend over the entire period is quite small, although it's definitely positive; note how few Septembers have been very dry in recent decades.


The chart below shows the number of days each September with daily precipitation amounts at or above 3 different thresholds.  As I noted in the earlier post, the frequency of 0.25" daily precipitation has increased quite a bit since 1990.  Smaller precipitation amounts have actually become slightly less common over time.  It's interesting to note that in the first 30 years (1930-1959), only 9% of September precipitation days produced 0.25" or more, whereas in the past 26 years (1990-2015), this ratio is up to 17%.  Changing Pacific sea surface temperature patterns almost certainly bear some of the blame for this, but an examination of the details will have to wait for another time.


Thursday, October 8, 2015

Fairbanks Melt-Out

The fortunes of snow have reversed again in Fairbanks, as mild temperatures and rain have already eradicated much of the snow cover that was so dramatically laid down last week; the snow depth at the airport was reported as down to a trace last night.  So the early-season snow cover has melted out twice already.  In and of itself, this is quite unusual: in more than 50% of years (most recently last year), the initial snow cover (based on daily snow depth) never melts out until spring.  In 27% of years it melts out once before becoming permanently established, in 18% of years it melts out twice, and in 2 of 85 years (1936 and 1970) it melted out 3 times.  The record was in 1934, when all-time record temperatures for December melted out a meager snowpack on December 5, and the permanent snowpack didn't arrive until the day after Christmas, after 4 false starts.

This year's events are of course more unusual with respect to the amount of snow that has come and gone.  A total of 20.9" has accumulated and melted, which is more than ever before prior to the snowpack; the previous record was in 1934 (14.9").

On a related note, Brian created a very interesting chart the other day showing the annual snowfall that does not contribute to the permanent snowpack in Fairbanks, i.e. the amount that falls and melts out before the snowpack arrives, plus any snow that falls after the initial spring melt-out.  On average this amount is only 2.6", and an average winter sees 96% of its snowfall contribute to the permanent snowpack.  The chart below shows the annual fraction of snow falling outside the snowpack dates, with the record being 41% in 1940-41.  Interestingly the winter of 1940-41 had a very strongly positive PDO and a strong El NiƱo.


It's interesting to see that there appears to be a long-term trend towards less snow outside the snowpack season, with the last decade being quite unusual compared to the long-term history.  This could be related to the long-term cooling trend at this time of year in Fairbanks, i.e. lower temperatures make a melt-out less likely, but I suspect it's more attributable to increased precipitation: a heavier early snowfall is less likely to disappear.  There has also been a decrease in spring snowfall, with a strong warming trend.  In any case, the trend on this chart will look a lot different when this winter's data point is added: the fraction for 2015-16 might be anywhere from 14% to 91%, based on the historical range of annual snowfall.

By way of comparison, note that Bettles sees only 1.4" of snow outside of the snowpack season, and on average over 98% of annual snowfall contributes to the snowpack.  The record non-snowpack snowfall was 16.3" (18% of total) in 2013-2014.  In McGrath, the record is 20.2" (25% of total).  The fact that Fairbanks has already seen more snow than this illustrates how very unusual the situation has been compared to the long-term climate of the interior.

Wednesday, October 7, 2015

Disappearing Snow

With last week's snow all but gone in Fairbanks, it's interesting to see where snow is hanging on across the interior and north.  We can get a broad sense of this from the SNPP satellite landcover imagery.  The images below were taken at about the same time mid-afternoon yesterday (top) and today (bottom); blue is indicative of snow and ice cover.  The Brooks Range and North Slope are pretty well snow-covered, except for patches of the western North Slope inland from Wainwright, and south of Point Lay.  In the interior, the Tanana valley, the middle and lower Koyukuk, and the Yukon Flats and upper Yukon valley clearly have little snow; but the high terrain is snowy throughout the interior.  Note also the lack of sea ice so far in the southern Beaufort and Chukchi Seas.


A quick tour of SNOTEL sites and FAA webcams confirms that last week's snow is mostly gone at low levels, but plenty remains at elevation.  Here are a few snow depths as of last report:

Eagle COOP: 0"
Chicken COOP: 1"
Fort Yukon SNOTEL: 1"
Bettles SNOTEL: 3"
Coldfoot SNOTEL: 4"
Fairbanks airport (as of midnight): 1"
Upper Nome Creek SNOTEL (2520' MSL): 10"
Munson Ridge SNOTEL (3100' MSL): 11"

Here are a few webcam shots for good measure.