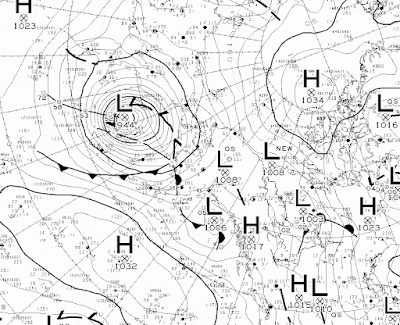
Returning to the topic of the September 1992 cold snap, which was still ongoing 30 years ago... at this point in the month (the 26th) there was about a week left of the deeply unusual and persistent cold. The worst of the cold, for the time of year, occurred around the 23rd and 24th, when Fairbanks saw two nights below 10°F; but this paled in comparison to -5°F in Nenana on the morning of the 24th, and a shocking -17°F at a RAWS site on the Yukon River near Beaver (the New Lake RAWS, no longer operating).
Rick Thoman has showed on more than one occasion that September 1992 was easily the most anomalous month for temperature in Alaska's climate history when the typical variability of the time of year is considered. In other words, the standardized departure from normal is greatest for that month. Here's a chart to illustrate for Fairbanks; click to enlarge.
Here I've defined a "contemporary normal" as the average monthly temperature within +/- 15 years of each year; this removes the long-term trend and makes for a relatively consistent analysis over time. At the beginning and end of the series I just used the 30 years at either end, so for example the normal for 1930 is 1930-1960, for 1965 it's 1950-1980, and for 2022 it's 1992-2022. Also, I excluded the year itself from its normal, so that the mean and standard deviation are not influenced by the year in question.
The big negative outlier is obviously September 1992, and interestingly May 1992 can be seen right next to it: May was a very anomalous month in its own right. The delayed start to summer in 1992 compounded the damage from the early, heavy snow of September, because trees were still in leaf when the snow arrived.
It is interesting to observe the negative skewness in the distribution of monthly temperatures: five calendar months were more than 3 SD below normal, but only three months were at least 3 SD above normal.
While these calendar month statistics are interesting, it's worth asking whether September 1992 is also the greatest outlier on a running 30-day basis. One can easily imagine a multi-week cold or warm spell that spans two months and doesn't show up as particularly unusual for either calendar month. To address this, I simply repeated the exercise for all 30-day periods, with the contemporary normal defined for each day of the year.
The answer is that yes, the autumn 1992 cold was easily the most unusual 30-day temperature anomaly, with an astounding -5.3 SD anomaly for the 30 days ending October 7.
Only one other 30-day anomaly reached +/- 4 SD, and that was the 30-day period ending May 7, 2013. Read about that cold spell in the blog archives, e.g. here. April 2013 was itself the second most unusual calendar month. Remarkably, June 2013 was then one of the most unusual months on the warm side, and the 30 days ending June 26, 2013 was the warmest 30-day period on record (+3.6 SD). The turn-around in the last third of May was astonishing:
http://ak-wx.blogspot.com/2013/06/oh-what-may-it-was.html
Here are the ranked lists of greatest 30-day temperature anomalies on both sides: the dates are the ending dates of the 30-day periods.
-5.3 SD October 7, 1992
-4.3 SD May 7, 2013
-3.9 SD July 8, 1949
-3.9 SD August 21, 1969
-3.8 SD May 24, 1992
-3.6 SD May 30, 1964 (record latest breakup at Nenana, tied with 2013)
-3.6 SD March 19, 2007
+3.6 SD June 26, 2013
+3.6 SD April 25, 1940
+3.4 SD June 28, 2004
+3.4 SD September 25, 1974
+3.3 SD January 25, 1937
It would be worth writing a post on each one of these events, as I'm not familiar with them all. It's interesting, though, that only one occurred in winter: it seems the natural variability of Fairbanks climate in winter is so large that the tails of the distribution are not as "heavy", i.e. very large standardized anomalies are less frequent.


