Showing posts with label Brooks Range. Show all posts

Saturday, June 7, 2025

Late Snow in Bettles - Again

I mentioned a few days ago that the contrast between fire activity in Alaska versus Canada so far this season is very reminiscent of 2023.  Here's another facet of the similarity: Bettles briefly saw accumulating snow yesterday, just like in early June 2023:

https://ak-wx.blogspot.com/2023/06/record-late-snow-in-bettles.html

Unfortunately the climate observer in Bettles didn't (yet) report a snow depth for yesterday, so we can't say whether the maximum snow depth was measurable - but if it was, it would be the latest measurable snow on record.  Judging from webcam imagery (see below), the situation yesterday looked similar to the 2023 event; but in 2023 the light snowfall persisted (at above-freezing temperatures) for longer, and it redeveloped again the following day.

[Update June 8: the accumulation report came in at 0.4", so that confirms it's the latest measurable snowfall on record in Bettles.

End of update]

Yesterday:


2023:


Yesterday:


2023:


The NWS in Fairbanks issued a Winter Storm Warning for central Brooks Range locations above Bettles, and the warning extends through tomorrow afternoon.  It's the first WSW issued by NWS Fairbanks in June since 2018.

Anaktuvuk Pass looks to have quite a bit of fresh snow:


Saturday, November 16, 2024

Cold in the Brooks Range

The past several weeks have been notably cold in the Brooks Range as a result of persistent northeasterly flow; and this has been caused by an unusual gradient between low pressure over southern Alaska and atypical high pressure over the Arctic Ocean.  Sea-level pressure has been 15mb higher than normal this month at about 80°N on the Date Line:


Here are the daily mean temperatures this autumn compared to normal at Anaktuvuk Pass, 2100 feet elevation in the heart of the Brooks Range:

From last Sunday through yesterday - six days in a row - daily average temperatures were below -15°F in Anaktuvuk Pass, which is pretty chilly for the time of year; we have to go back to 2005 to find as many days this cold in the first half of November.

It's also the first year since 2012 with an average temperature below 0°F for the first half of November, and in fact it's a notable break from the remarkably persistent warmth of 2013-2023:


The Arctic as a whole isn't noticeably cooler this year, so this seems to be a case of an unusual and persistent flow pattern bringing an unseasonably cold air mass to the region.

High-quality data from the Toolik Lake CRN site confirms the anomaly: this is also (easily) the coldest first half of November in the short history since 2017 at that location.

NWS Fairbanks expects no improvement in the short term: here's an excerpt from their latest forecast discussion.

"North Slope and Brooks Range...

- Cold temperatures (around -30F) become more widespread through Tuesday across the Arctic Plains and Brooks Range. North winds around 15 mph in the Brooks Range Sunday night into Monday morning will result in very cold wind chills near 55 below just barely short of a Cold Weather Advisory."

Monday, December 20, 2021

Wiseman Snow Follow-Up

Last week's post mentioned the remarkable 41" snowfall at Wiseman a couple of weeks ago, and I remarked that the limited historical data suggest this location is prone to occasional very large snow events.  Here's some follow-up based on a slightly closer look.

First, it's interesting to note that the average seasonal snowfall totals are not particularly high at Wiseman.  Based on a common set of 13 winters since 1996 that have reasonably complete data at Wiseman, Bettles, and Fairbanks, the median seasonal snow totals indicate that Bettles is considerably snowier overall:

Bettles   97"

Wiseman   72"

Fairbanks   57"

Despite this, Wiseman reported daily snow amounts of 12" or more on 10 different days during these winters, whereas Bettles had only one such day, and Fairbanks had none!  (But a few days came close in both Bettles and Fairbanks.)

Here's a simple chart showing the frequency of days with snow totals in several categories, again based on a common set of 13 winters.


One possible explanation for the large excess of big snows at Wiseman would be that the observer(s) may have tended to report storm totals as single-day snow amounts on the final day of a multi-day event.  However, some of the big single-day totals also have large snow amounts on adjacent days, leading to extreme storm totals, such as:

40.5"   Jan 23-24, 1999 (the two-day record until the most recent event)

47.5"   Jan 22-24, 2000

29.6"   Feb 12-13, 2019

Given what happened two weeks ago, with independent corroboration from the Coldfoot road crew, there's no doubt these events can happen.  It's just surprising that they don't show up in terms of high seasonal averages; but perhaps that could be explained by the observer failing to report many small events that would add up significantly over the course of a long winter.

For reference, here's the location of Wiseman; it certainly makes sense that orographic lifting would squeeze a lot of moisture out of flow that comes up from the southwest.


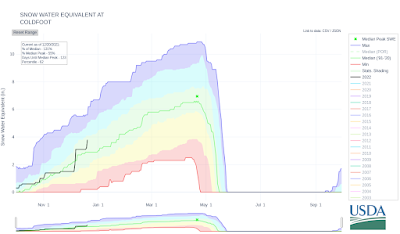
By way of comparison, the SNOTEL sites at Bettles and Coldfoot show similar snowpack statistics, with median water-equivalent snowpack peaking between 6" and 7" in late winter.  It's a little difficult to imagine that Wiseman would be much different, only 10 miles north of Coldfoot.


Speaking of heavy winter precipitation, Fairbanks just saw over an inch of liquid-equivalent in 24 hours, as another round of extremely warm and moist air enveloped a large part of the state.  I'll hopefully be able to post more comments on this soon.


Saturday, December 19, 2020

More on Wind and Cold

Wind chill has been a concern across much of interior and northern Alaska in recent days, with a notable combination of wind and cold in many locations.  The more exposed locations of course had the worst of it; Eagle Summit saw a wind chill of -66°F on Thursday morning (-30°F temperature with 28mph wind), and Brooks Range passes have been very cold in the past couple of days.  The Arctic coast has had several rounds of strong winds in the past week, but residual warmth from the ocean kept temperatures a little higher, at around -10°F or so.

As usual, the "winner" in the wind chill department is Howard Pass, with a wind chill down to -71°F yesterday evening.


This latest episode of extreme weather at Howard Pass, and comments from reader Gary on last week's post, led me to do a comparison of wind and temperature data from relatively nearby stations in the western Brooks Range.  The results illustrate nicely the unique and highly localized winter climate of the Howard Pass site.  Here's the location we're talking about, for those who may not be familiar (click to enlarge);


First, the chart below shows the joint distribution of daily mean temperature and wind speed at Howard Pass in the winter months.  There's a huge amount of missing data, because the instrumentation often fails to make it through the winter owing to the harsh conditions; the last reasonably complete winter of data was 2016-2017.  Nevertheless, there's plenty of evidence to show the remarkable inverse correlation of temperature and wind in winter: the lowest temperatures always come with wind, and high winds almost always bring serious cold.  This is because cold air from the North Slope is funneled up and through the pass from a NNE direction, as in today's observations above.  The strongest pressure gradient across the Brooks Range tends to accompany the coldest conditions on the North Slope, so this is a recipe for extreme wind chills at favored pass locations.


The same chart for the Imelyak RAWS, about 40 miles to the south and 1500 feet higher in elevation, is completely different:


The absence of cold, let alone cold plus wind, is quite remarkable at Imelyak; with nearly complete data since summer 2012, the lowest minimum temperature recorded is only -37°F.

Here's the joint distribution of winter wind chill for these two sites.  Here I've calculated wind chill from the daily mean temperature and wind speed, rather than starting from hourly data, so it's not a true daily mean wind chill (because the formula is non-linear).


A histogram format shows another view of the same thing: Howard Pass completely dominates on the low wind chill side of the distribution, even though Imelyak is 1500 feet higher in elevation.


Another relatively nearby observing site is the top-quality Ivotuk CRN installation, about 37 miles to the northeast of Howard Pass as the crow files.  Despite a similar elevation, Ivotuk has a wind-temperature relationship that looks much more like the interior North Slope: not much wind, and when it does get breezy, it's almost always warm.  The contrast from Howard Pass is really striking.


Here's a chart from the classic interior North Slope site: Umiat, another 100+ miles to the northeast.


Note that winter temperatures are highly correlated between Ivotuk and Howard Pass; they usually experience the same air mass, but the wind speed behavior is opposite.  (The coldest days at Howard Pass are missing on this chart because Ivotuk didn't start reporting until 2014.)


In summary - this is simply more documentation of the unique and fascinating local winter climate at Howard Pass.  As always, thanks to Ken Hill and Pam Sousanes (and probably others) for their persistent efforts over the years to maintain the Howard Pass site.


Monday, September 28, 2020

Brooks Range Chinook

Yesterday afternoon the temperature reports across northern Alaska caught my eye, with a striking temperature contrast across the Brooks Range.  Mid-elevation stations on the north side of the divide, such as Anaktuvuk Pass and Howard Pass, saw temperatures around 20°F - nothing unusual for the time of year - but downsloping produced dramatic warming on the south side of the mountains.  Bettles reached 54°F, and the Norutak Lake RAWS hit 56°F, which is very warm for so late in September.

Here's a map of temperature reports at 5pm AKDT - click to enlarge.

A very strong Gulf of Alaska storm explains this situation, as there was a pronounced north-south pressure gradient across the state at 4pm yesterday - see below.  As a result, strong cross-barrier flow occurred over the Brooks Range, and impressive chinook warming was able to develop even though the elevation changes are more subtle than in southern Alaska (Anaktuvuk Pass and Norutak Lake differ by only 1300').  Such is the power of elevation for modifying weather and climate.


Saturday, September 2, 2017

Brooks Range Chill in Context

Following up briefly on the last post, temperature data from the Atigun Pass SNOTEL provide a bit more context for the rather chilly conditions observed at this high-elevation site in recent days (down to 17°F on Wednesday).  Historical temperature data go back to 1999, although prior to 2006 there is only one data point provided per day - the temperature at midnight.

The chart below shows the accumulation of freezing degree days through August and September for each year since 1999 (calculated with only the midnight temperature throughout, for consistency).  The black line, indicating this year's pace of freeze-up, is a little ahead of the 18-year normal, but only by a few days, and the early chill this year has been much less severe than in 2000 and 2002.


Looking just at August total FDDs, the data from the early years confirm what I suspected - that the apparently cooler August conditions of the past few years are not unusual relative to a longer history.  From this perspective, the relative absence of chill in a number of years from 2004-2012 seems more unusual.


A longer and higher-quality history of temperature data is available from Toolik Lake Research Station, just 40 miles farther north up the haul road - and while this site is not quite in the mountains, the elevation at Toolik is still a respectable 2500'.  The chart below shows August FDDs at Toolik, confirming that recent years have brought freezes closer to the long-term normal, although not as severe as in some of the earlier years.


What could explain the early arrival of autumn chill in the Brooks Range in recent years?  The 500mb height chart from Wednesday provides a clue: notice the strong, cold upper-level trough over the North Slope.  More analysis would be needed to be sure, but it's likely that recent years have seen this kind of feature relatively more often at about the same time on the calendar.


Finally, lest we be tempted to infer that Arctic-wide conditions are cooler now than in recent years, the latest Alaska-centric sea ice analysis shows open water for more than 300 miles north of Barrow.  Arctic sea ice extent won't set a new record low this year, but it is still far below the long-term normal, and estimated ice volume is tracking near record lows.  More on that another day.


Tuesday, August 29, 2017

Brooks Range Snow

Wintry conditions have arrived early this year in the higher elevations of the Brooks Range, as evidenced by webcam photos taken this afternoon at the Chandalar Shelf DOT site (elevation 3285'), Anaktuvuk Pass (2171'), and Toolik Field Station (2493').


The Atigun Pass SNOTEL site is reporting a healthy snow depth of 8", and this is certainly plausible based on mostly sub-freezing temperatures for several days and the webcam views above.

This will be the 10th winter with a snow depth sensor installed at the Atigun Pass SNOTEL instrument array, and so we can look at the recent history of daily snow depth in August and September - see the chart below.


With the exception of last year, snow has been reported on the ground in August of each year since 2012, and 2015 also saw 8" on August 30, so the current conditions are not particularly unusual.  The 9" snow depth that was reported earlier this month on August 15 seems a little suspicious, although temperatures were certainly low enough and a little snow was evident on regional webcams at that time:


A curious feature of the chart above is that August snow was not reported in 2008-2011, and if we plot the first date of 4" snow depth, a rather striking trend jumps out - see below.  Based on this very brief history, significant snow has arrived earlier in the most recent years; but if we had a longer history, I imagine it would show that 2008-2012 were unusual for the lateness of the snow.  Given that temperature (and of course precipitation) data go back to 1999, it would be an interesting exercise to estimate when snow arrived for earlier years.


Friday, August 26, 2016

Wet in the Northwest

Parts of northwestern Alaska have seen very heavy rainfall in the past week or so, as very moist southwesterly flow has been drawn up into the western Brooks range.  The highest rain totals were observed at the high-quality CRN site near the Red Dog mine, about 30 miles north of Noatak and 45 miles northeast of Kivalina.  The CRN instruments sit at an elevation of 942 feet above sea level with higher terrain to the north and northeast, so flow from the south or southwest is favorable for heavy precipitation.  The station reported 4.97" in 3 days ending on the 20th, with 2.89" on the 19th alone.

Heavy rainfall continued in the subsequent days at points farther to the east in the western Brooks Range; the following images show the NWS estimates of precipitation over several consecutive days (with one image missing for the 23rd - sorry):


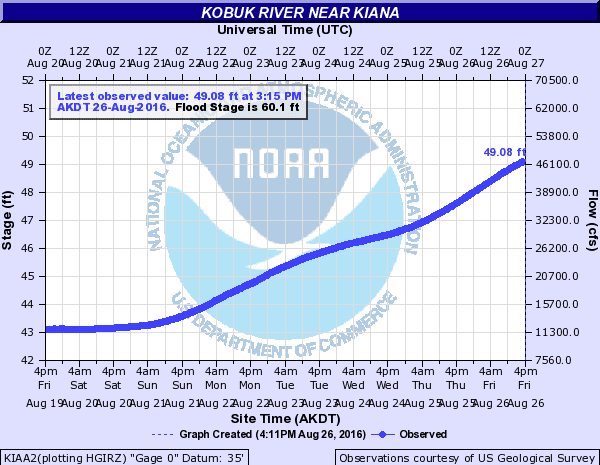
It's no surprise to see the NWS issue an advisory today for high water levels on rivers in the area.  As noted by the NWS, the flow of the Kobuk River near Kiana has more than quadrupled in the past week:


Here are a couple of soundings from Kotzebue that show the strong southwesterly low-level flow around the time of the very heavy rainfall at Red Dog.  The sounding at 4pm AKDT last Friday reported 45 knot winds from the southwest at 3000 feet above sea level, transporting copious moisture into the hills to the north.


As remarkable as 5" of rain in 3 days seems at a latitude of 68°N, it's apparently not that unusual for the Red Dog CRN site, which has been in operation for exactly 6 years today.  The chart below shows the monthly precipitation totals (liquid equivalent), and we see that not only was last August also very wet, but August 2012 produced an extremely large amount of rain at the site.  Given that August 2012 was also by far the wettest month on record at nearby Kivalina, with a remarkable 8.8" of rain, the extreme Red Dog total is plausible.


It is no coincidence that August 2012 also produced the strong Arctic cyclone that we discussed in connection with the recent Arctic storm; the circulation pattern this month, with low pressure to the north and northwest of Alaska, is broadly similar, although this year the main anomaly is farther to the north and away from Alaska.  Here's a map of the sea-level pressure anomaly in August 2012.


It is interesting, to say the least, that August has been so consistently wet at Red Dog in the past 5 years.  The figure below shows the distribution of precipitation totals for each month of the year, with the columns showing the absolute range and the horizontal markers indicating the median for each month.  It's intriguing to consider whether August has always been by far the wettest month of the year in this area, or if the past several years have been very anomalous compared to the longer-term climate.  I suspect the latter is more likely to be true.


Finally, for context and future reference, here's the setting of the Red Dog site as visualized on Google Maps and from the FAA webcam view.  The CRN site appears to be just visible on the webcam view, just to the right of the road as it heads away from the airport to the southwest.