Showing posts with label ERA5. Show all posts

Saturday, July 17, 2021

Climate Monitoring

One of the exciting aspects of modern climate science is that the tools for monitoring global climate have advanced by leaps and bounds in recent years.  Regular readers know that I'm a fan of the ECMWF's ERA5 reanalysis, which is a global gridded model estimate of hourly weather across the globe, and extending back to 1950.  The ERA5 product even includes uncertainty information based on an ensemble of possibilities that are consistent with the observed historical data.  ERA5 is certainly not without flaws, some of which are obviously connected to the 31-km grid spacing, but for many purposes it is a tremendous tool.

To illustrate what ERA5 can deliver, here's a look at June climate anomalies for a few variables that we don't usually monitor in detail, because they are not widely measured at ground level with consistent and reliable instrumentation.  For example, solar radiation:


The map shows the percentile rank of the June total solar (shortwave) radiation compared to the 1991-2020 distribution for the month of June.  On this scale, 0% would mean that June saw less solar radiation than any June in the past 30 years, and 100% would indicate it was the sunniest June in more than 30 years.  So according to ERA5, June was a very cloudy month along the west coast and western interior, as well as southwestern and south-central Alaska.

ERA5 precipitation shows a broadly similar pattern, with very wet conditions across the eastern Bering Sea, northwestern Alaska, and also in southeast Alaska.


Interestingly the NOAA/NCEI climate division data for June (see below) shows some significant differences, including much drier conditions from the Aleutians to south-central Alaska, but less dryness in the eastern interior.  Looking at some ground truth data, Anchorage was certainly dry with only 0.31" of rain (5th driest relative to the 30 years), and Homer also saw less rain than normal.  However, King Salmon was only a bit drier than normal, Kodiak was wetter than normal, and Cold Bay rainfall was substantially above normal (4th wettest).


We can also look at ERA5 wind speed, bearing in mind that presumably only the large-scale wind anomalies have much validity because of the model's inability to represent complex terrain.
 

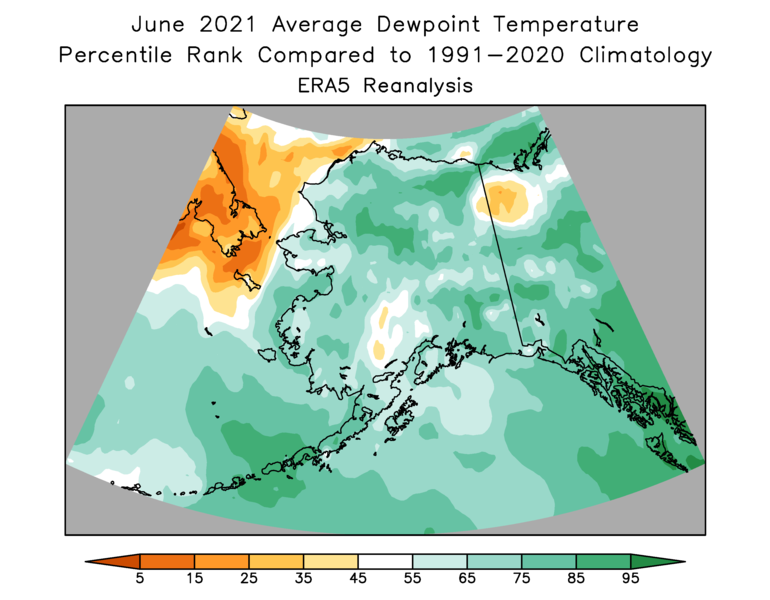
Here's dewpoint: above normal almost everywhere as a consequence of moist air being drawn up from the south.

The map below shows the mid-atmosphere pressure anomaly that produced the humid air flow and the wet, cloudy weather in the west and northwest: an unusually strong trough near the Bering Strait, and a strong ridge over southwestern Canada.  There was also very unusual low pressure in the Arctic, as highlighted in my comment a couple of weeks ago about the wet weather in the northwest.


Here's an example of an ERA5 variable that gives another perspective on the June climate anomalies:


According to the model, evaporation was well below normal in the southwest, but it was not widely suppressed elsewhere despite cloudy weather being quite widespread, and evaporation was higher than normal in the southeastern interior even though the dewpoint was high (because it was also warm - see figures at bottom).  But the far northern Yukon is a bit of a puzzle, as ERA5 shows below-normal evaporation despite low humidity and above-normal sunshine, wind, and temperature.  The surprisingly low evaporation may be related to low soil moisture, i.e. the the model thinks the ground was so dry that evaporation was reduced for lack of soil moisture.  The maps below show May and June soil moisture in the top layer of the ERA5 land model.


Finally, temperature - see below.  The ERA5 result compares reasonably well to the climate division data, except (and it's a big exception) on the North Slope.  Umiat was definitely warmer than normal, so this looks like a topic for further investigation.


Update: Rick Thoman's station plot for June showed near-universal warmth on the North Slope.  So I'm not sure what's going on with the climate division data, but I hope to find out.


Saturday, February 15, 2020

Alaska Climate Divisions

Last week a UAF news article highlighted the value of the Alaska climate division analysis that was developed a few years ago by Peter Bieniek and others from UAF and other universities, along with NOAA collaborators such as Rick Thoman.  NOAA has long used so-called climate divisions in the lower 48 to keep track of climate variations in climatically similar regions, but nothing comparable was available for Alaska until this work by Peter et al.

https://news.uaf.edu/taking-a-deep-dive-into-alaskas-record-breaking-warm-year/

The journal article describing the new climate division work was published way back in 2012, but as the article explains, it took a few years for NOAA to adopt the divisions for "official" monitoring.

https://journals.ametsoc.org/doi/full/10.1175/JAMC-D-11-0168.1

I'm a big fan of the Alaska climate divisions, but one of the potential shortcomings is the relative scarcity of ground-truth station data; only 42 sites (including some Canadian) were used to determine 13 climatically similar regions, and some divisions had far more sites than others.  The Northeast Interior division, for example, contains only one station (Fort Yukon), and the North Slope division has only one non-coastal site (Umiat).  Such is the world of historical Alaska climate analysis.

For reference, here are the Alaska climate divisions:


After reading the UAF news piece, I started wondering if modern reanalysis data would produce similar climate divisions to the Bieniek results.  To address this, I used monthly mean temperature data from the ERA5-Land reanalysis, now available from 1981 through most of 2019.  ERA5-Land is a higher-resolution version of ERA5 (9km vs 31km grid spacing) that models only surface variables such as 2m temperature, 10m wind, humidity, snow cover, and so on; it does not deal with oceans or the atmosphere aloft.  I'm hopeful that ERA5-Land may be an improvement over ERA5 for Alaska in winter (see this post from a few weeks ago), although I haven't done any investigation on this yet.

Regardless of the possible deficiencies of ERA5-Land, it's interesting to see what the climate division analysis produces.  I ran cluster analysis on the gridded monthly mean temperature anomalies (standardized) from 1981-2018, and the following maps show the results, ranging from 3 to 10 clusters, based on two alternative methods.  Bieniek et al tested these two methods and a third, but they focused on results from Ward's method (right column below).


K-means methodWard's method


There are a number of interesting aspects to the results.  First, the K-means cluster boundaries tend to jump around somewhat, because the method starts with a random choice each time and iterates to a solution.  For this reason it is also not 100% reproducible, i.e. you can get different results when you run it again.  In contrast, a hierarchical method like Ward's is reproducible, and the boundaries don't move around as the clusters are progressively sub-divided.

Despite the differences in the results, certain features are similar: the North Slope division emerges quickly and remains very well-defined throughout; a Panhandle division emerges at k=6 for both methods; and the clusters are really quite similar for k=5,6,7, and 9.

Perhaps most interesting, in my view, is the absence of some of the distinctions that are found in the Bieniek results.  For example, even if we go all the way up to 15 clusters (see below), there is no sub-division within the Panhandle, whereas Bieniek has three Panhandle divisions and another for the Northeast Gulf.  Similarly, the ERA5-Land clusters give no separation between Aleutians and Northwest Gulf (e.g. Kodiak Island).  As the number of clusters increases, the sub-dividing mostly takes place in the interior and eventually on the North Slope.


On the other hand, the ERA5-Land clusters quickly break apart the West Coast region, rather than keeping it together as Bieniek does.

I mention these differences out of curiosity, not to suggest that the Bieniek divisions are wrong.  It's very likely that ERA5-Land has certain deficiencies that would hamper the assessment of climate similarity - for instance, the reanalysis may be wholly inadequate in the very complex terrain of the Panhandle.  More investigation would be needed to see how well ERA5-Land reproduces climate in the vicinity of the stations used by Bieniek et al.

Lastly, it's not clear to me whether there is an optimal number of clusters based on the ERA5-Land analysis.  Traditionally one looks at the distribution of within-cluster variance and seeks to find a threshold beyond which (i.e. for smaller numbers of clusters) the variance starts to increase more quickly; but the results from ERA5-Land show no obvious stopping point.  Bieniek also found that using gridded data made it impossible to tell where to stop.


Personally I like the look of the K-means solution with 9 divisions, but it's purely a personal preference.  I'd be glad to hear any comments from readers.

Saturday, January 18, 2020

ERA5 Analysis of Cold

During the interior cold snap of the last week of 2019, when the temperature dropped well below -50°F in many places, I was eager to see what the new state-of-the-art ERA5 reanalysis would say about the minimum temperatures.  I've used the ERA5 data on previous occasions (e.g. see here), and will continue to do so, because it's an exciting new product from Europe's weather and forecasting science powerhouse, ECMWF.  Besides this, ERA5 is becoming widely used as essentially ground truth data across the globe, so it's of great interest to see how it performs in extreme or unusual weather situations.

First, here are some maps of the ERA5 daily minimum temperatures during the cold spell.  Note that I've used a 24-hour period from 3pm to 3pm AKST (midnight UTC) for simplicity in processing the data.  Click to enlarge.


When comparing to the December 27 satellite-estimated values that I showed in a previous post, it's clear that the area affected by -50°F or lower is considerably smaller in the ERA5 data, especially to the south of the Yukon River.


The absolute minimum on the ERA5 31-km grid is -58.7°F, and this is found right over Allakaket on December 27; this temperature matches very well at Allakaket itself, but as discussed before, the satellite suggests it was a bit colder on the Kanuti Flats.  Moreover, the ERA5 analysis is nowhere near as cold in the vicinity of the Eureka coop (MLYA2) report of -65°F, although of course we can't expect a 31-km resolution model to capture localized valley cold pools - we would need a far finer grid to hope for success in that situation.

It's interesting to see that the model does have a localized area of cold near the Nowitna CRN site (NWTA2), and so I thought it would be worthwhile to do a more detailed comparison of ERA5 vs CRN temperatures.  Of course the quality of the CRN measurements is extremely high.

First, the big picture: all daily mean temperatures since March 2017, when the Nowitna (Ruby 44 ESE) CRN site first started working reliably (after being installed in 2014).  See below - the comparison is fairly good at temperatures above freezing, but there are evidently some problems in the cold season; in particular, ERA5 tends to have a high bias in cold conditions, and it's large in some cases.


Here's a chart of daily mean temperatures this winter since October 1.


The main problem is immediately obvious: ERA5 stays much too warm when the temperature drops off quickly at the CRN site.  Each of these cold snaps no doubt corresponds to a period of clear and calm weather that allows a strong temperature inversion to develop, and evidently the model's boundary layer physics do not handle this situation well.  It's a bit disappointing, considering the pedigree of the ERA5/ECMWF models, but we must admit that it's a tall order to reliably represent such shallow layers of intense temperature inversion in any model.

Here are charts from the past two winters.  The same problem is evident, although not to the extent of this winter.  Interesting the mean bias from October-March was exactly the same in both 2017-2018 and 2018-2019 (ERA5 3.1°F too warm), but the bias is running at +4.9°F so far this winter.


In summary, ERA5 clearly has some problems with extreme cold in Alaska in winter.  In the recent interior cold snap, the extent of coldest conditions was too small, although part of this is certainly related to the grid-box averaging that is intrinsic to the model; the model simply doesn't represent valley-floor locations when there is higher terrain elsewhere in the grid cell.  Looking at the Nowitna CRN, there's a clear tendency for a warm bias that shows up during cold spells, and this seems to be a symptom of inadequate surface layer physics as well as insufficient horizontal resolution.

All of this goes to show that we still can't overestimate the value of real ground-truth observations such as those provided by the wonderful CRN network.  And as an aside, I for one am very grateful for the efforts of the NWS personnel who finally got the Nowitna site working properly - it's a great location and we're lucky to have such a treasure trove of data.