Thursday, August 8, 2013

Hottest Fair EVER

Seven days down and three to go for the Tanana Valley State Fair, and with high temperature again exceeding 80ºF on Thursday, this is already the hottest TVF ever, — at least if you're counting days with a high of 80ºF or higher: five days have had highs of 80ºF or higher.

Here's the plot the number days with high temperatures of 80ºF or higher since 1952:
As reader Gary pointed out, the dates of the Tanana Valley Fair have varied over the years, as has the length. Fairs were generally 3 or 4 days long until the early 1970s, when they bumped up to 5 to 7 days in length. Since the early 1990s Fairs have been mostly nine or ten days long. However, it's clear on the above plot that the frequency of hot days corresponds with the change to in start dates of the Fair from sometime in the middle of the month (usually the second week) to the first Friday of August.

Notable Temperatures

Here's a brief round-up of temperature records and near-records in the past couple of days:

- Fairbanks max temp of 85 F on Wednesday was a daily record; Fairbanks reaches 85 this late in the season in less than 10 % of all years.
- Bettles max temp of 83 F on Wednesday was a daily record.  Also, the preliminary minimum temperature of 60 F this morning would be only the 3rd time that a low in the 60's has been recorded so late in the season.  The August record high minimum is 61 F.
- As mentioned earlier, Fort Yukon apparently reached 88 F on Wednesday, which would tie the record highest temperature observed there in August and also tie the highest so late in the season.  However, the Fort Yukon GHCN data is highly incomplete in recent decades.
- Deadhorse reached 72 F and Nuiqsut reached 77 F on Wednesday, both notable but not records.
- Delta Junction reported an overnight minimum of 66 F last night, but I'm not sure which historical station series to compare to for a possible record.

Over the border in Canada this morning:

- At Inuvik airport, the lowest hourly temperature overnight was 64 F; the record highest minimum so late in the season is 63 F (data from 1957-2005).
- Komakuk Beach, on the Arctic coast just across the border, reported a minimum hourly temperature overnight of 61 F, which compares to an August record highest minimum of only 56 F (data from 1959-1992).  The all-time highest minimum is only 62.

Finally, on the other temperature extreme, and on the southern coast (oddly enough!):

- Kodiak airport reported a temperature of 40 F this morning, a new daily record minimum temperature.  The temperature has been lower in the first half of August on only 4 occasions.

Wednesday, August 7, 2013

Most Extreme Year Ever for Fairbanks?

** Updated at 1:00 p.m. on 8/8/13 to correct a rather embarrassing math error **

As a follow-up to Richard's excellent post from last week, I decided to re-calculate the daily anomalies based upon the "new" NCDC formula that he and I discussed via email for generating daily standard deviations. The following charts for Fairbanks and Anchorage show the results of that reanalysis.

Here is how to interpret the charts - from bottom to top.

1) The red line shows the annual percentage of days that the temperature was more than three standard deviations either above or below the mean; e.g., +3.2, -3.5, etc. Since it uses percentages, 2013 can be compared to other years on equal footing. Also note that the categories are non-overlapping.

2) The dark blue line shows the percentage of days where the daily temperature anomaly was between 2 and 3 standard deviations either above or below the mean; e.g., +2.1, +2.7, -2.4, etc. The dashed line is the expected value based upon the normal distribution.

3) The solid burgundy line shows the percentage of days where the daily temperature anomaly was between 1 and 2 standard deviations either above or below the mean; e.g., +1.5, +1.2, -1.6, etc. The dashed line is the expected value based upon the normal distribution.

4) The solid green line shows the percentage of days where the daily temperature anomaly was between 0 and 1 standard deviations either above or below the mean; e.g., +0.2, -0.9, -0.7, etc. The dashed line is the expected value based upon the normal distribution.

5) The solid orange line at the top shows the Chi-Squared goodness of fit value. It is a squared, weighted measure of the difference between the actual and expected values and is the gold-standard for categorized (grouped) data. A value of zero indicates that the distribution of anomalies exactly fit a normal distribution. Any Chi-Squared value less than 6.0 (with 2 degrees of freedom) indicates that that year's temperatures approximated a normal distribution at he 95th percent significance level. The larger the value, the more anomalous (less normal) the distribution is. It can also be thought of as a measure of distribution extremes. By this metric, Fairbanks in 2013 (through August 7th) has had the most extreme temperatures of any year on record (post-1930) by a large margin. In fact, if the rest of 2013 is exactly normally distributed, it will still be the most extreme year on record. For Anchorage, 2013 is also in 1st place by a wide margin.


The graphic below shows the calculation for Fairbanks in 2013.


It is worth noting that if additional categories are used that to distinguish positive and negative anomalies, 2013 is still easily in first place overall for Fairbanks but not by as much. If the rest of the year was "normal," 2013 would only rand in 10th place. 1993 is a good year to look at. That year 11% of days were between -1 and -2 SD and 17% of days were between +1 and +2 SD. When you look at those as separate categories, they each differ fairly significantly from the expected value of 13.6. However, when they are combined, the number matches almost perfectly with the expected value. Of course, that knife cuts both ways.

Here is a good explanation of Chi-Squared:  http://www.stat.yale.edu/Courses/1997-98/101/chigf.htm

Here is a good site to manually enter numbers and check the Chi-Squared value: http://www.quantpsy.org/chisq/chisq.htm

Fairbanks Precipitation Update

Reader Mike asked about Fairbanks precipitation since May 1 and whether the dry conditions are within normal climate variability.  The chart below, showing annual values for May 1 - Aug 6 precipitation, indicates that the dryness is very unusual, but not unprecedented - the precipitation for this period is the 3rd lowest in the Weather Bureau/NWS era, exceeding only 1957 and 1966.  The number of days with measurable precipitation (17 out of 98 possible days) is also the 3rd lowest.


On another note, it appears Fort Yukon reached about 88 °F today, which ties the highest recorded temperature for so late in the season according to GHCN data - although the GHCN historical record is highly incomplete in recent decades.  Rick may be able to comment on whether more recent data are available.

Tuesday, August 6, 2013

Hot Weather and the Tanana Valley Fair

Tuesday was the fifth day of the Tanana Valley Fair, and the third day thus far with a high temperature in the 80s.  So this raises the question; how unusual are 80 plus temperatures this late in the summer in Fairbanks?

Here's a plot of the calendar day frequency (1930-2012) of days with maximum temperature ≥80F (disclaimer: the plotted data is a three day running mean frequency, just to smooth out the curve):

As you can see, the frequency of hot days in early August is about half that in late June and early July. So while 80ºF temperatures are uncommon this time of year, this is by no means unprecedented.

So, today's trivia questions are: what's the most number of days during the Tanana Valley Fair with a high temperature of 80F or higher?  And will the 2013  Fair break that record?

Warm Surge

Here's a nice visible satellite picture of the low pressure system currently spinning over the ocean south of the Alaska Peninsula.  The low was analyzed at 983 mb this morning, making it the deepest low to the south of Alaska since April.  Far to the northeast, over Canada's Northwest Territories and Arctic Archipelago, there is an enormous blocking ridge, as evidenced by the mostly clear skies in the interior.


As the low weakens and pulls back to Bristol Bay in the next couple of days, a powerful surge of warm air will be drawn northwestward across interior and northern Alaska.  The most unusual conditions relative to normal may be along the eastern North Slope, where the computer models are indicating 850 mb temperatures above 15 °C by late tomorrow.  The forecast graphic below shows a time-height cross-section of temperature at Barter Island; the horizontal axis shows time (UTC) increasing to the right, beginning at 12 UTC (4 am AKDT) today, while the vertical axis indicates pressure in mb.

It seems rather likely that some high temperature records may be broken across northern Alaska in the next day or two.


Monday, August 5, 2013

Uniform Temperature Days

Last November I noticed that Juneau had a day where the high and low temperatures were identical. It got me to thinking about how common of an occurrence this is. Well, here is the answer for the "Big 3" cities in Alaska. Surprisingly, Fairbanks has had more of these days than either Anchorage or Juneau. Note: I will check surrounding stations for the June 1905 occurrence in Fairbanks.

Anchorage - 1 occurrence
1/8/1917  Max = 11, Min = 11

Juneau - 2 occurrences
10/26/1942    Max = 57, Min = 57
11/13/2012    Max = 32, Min = 32

Fairbanks - 3 occurrences
11/12/1904    Max = 10, Min = 10
6/25/1905    Max = 54, Min = 54
12/24/1909    Max = 8, Min = 8

Sunday, August 4, 2013

Unusual Temperatures

As a follow-up to Brian's and Rick's illuminating posts on Friday and Saturday, I thought it would be interesting to examine more closely how "unusual" the "unusual temperatures" of 2013 have been.  Brian showed that, in Fairbanks and Anchorage, temperatures more than 1, 2, or 3 standard deviations from the mean have occurred much more often in 2013 than would be expected based on the normal distribution.  The question is, how often does this occur, or might it be unpredecented in the modern historical record?

The charts below show the number of days each year since 1931 when the daily mean temperature was more than 1, 2, or 3 standard deviations from the preceding 30-year average, for dates between January 1 and August 2.  Note that I compared the temperatures to the preceding 30-year average rather than the 1981-2010 average to help reduce artifacts associated with the long-term warming trend.  For example, temperatures in 1961-1970 are compared to the 1931-1960 mean and standard deviation.  (If we used the modern mean, many of the older temperatures would look artificially cold and would boost the counts in earlier years.)


We can see that 2013 really stands out in the "2 SD or more" category, with this year's count exceeding any previously observed for both Fairbanks and Anchorage.  The number of days at least 1 SD from the mean is very high but not unprecedented, while the 3 SD count is a record in Fairbanks but not Anchorage.

Note that my numbers differ slightly from Brian's for 2013, which is probably because the calculation method was slightly different for the 1981-2010 daily means and standard deviations (a smoothing method is required).

It is interesting that the total 83-year count for the "3 SD or more" category is much higher for Anchorage than Fairbanks (87 versus 39).  If the daily temperature anomalies truly followed a normal distribution, the counts would be around 48.  This suggests that the Jan 1 - Aug 2 Anchorage temperature distribution might have "fat tails" compared to the normal distribution, i.e. a higher chance of high-sigma events.  But strong decadal variability or long-term trends could also be playing a role - more investigation is required.

Saturday, August 3, 2013

Warm Spells and Cold Spells in Fairbanks

I have thought a lot about what constitutes a cold spell or a warm spell over the years. We have all heard countless times something close to, "what a nice stretch of weather we have had" or "it's been really cold for the last two weeks." Based on a cursory review of the literature, there is nothing even approaching a definition of where to put the bounds on a homogeneous grouping of days. So how do we quantify something that is inherently ambiguous. We can all agree that if the temperature is 2 standard deviations above the mean for 15 straight days that that would constitute a warm spell. But what if day 8 (of the 15 days) was cloudy and wet and was 0.1 standard deviations below the mean; leaving 14 of the 15 days 2 standard deviations above the mean. Is the 15-day period a single warm spell with one outlier or is it two distinct warm periods? What I have temporarily proposed is that if 6 out of a group of 7 days are in the upper third (tercile) of the expected temperature range, each of those days is a member of a warm spell. Conversely, if 6 out of a group of 7 days are in the lower third (tercile) of the expected temperature range, each of those days is a member of a cold spell. This is an entirely subjective criteria and I am very interested in suggestions from the readers for an alternative criteria. I discussed this with Rick a few months ago and he chimed in with a few thoughts so he is off the hook (for the time being). The first graphic below shows standard anomalies for Fairbanks during May 2013. The cold spell at the beginning of the month and the warm spell at the end of the month are identified. Make note of the text on the graphic that explains why certain observations are included in the respective groupings. Also, there is usually a transition period between one spell and the next but the example below does not have such a transition period.


The next chart shows the length of cold spells in Fairbanks since 1920 using the methodology described above. The typical length of a cold spell is 13.5 days and has been nearly steady over the last 90 years. However, the time interval between cold spells has not always been steady.


Here is the companion chart for warm spells in Fairbanks. The length of warm spells has increased from 13 days to 14 days over the last 90 years. However, as with cold spells, the interval between warm spells has not been uniform.


The final chart shows the number of days per year that Fairbanks has been in a cold spell (blue), a warm spell (red), and the combined number of days (black dashed).


As stated earlier, I am interested in hearing the thoughts of others on the criteria described in the introductory paragraph.

Fairbanks Temperature Updates

Here's some updated Fairbanks temperature and anomaly plots to compliment Brian's post Friday. First, the plot of the daily mean temperature reflected around the 1981-2010 normal:


The sustained, though not monolithic warm weather since late May is evident. Next is the raw daily departure from normal (and for good measure the year to date running departure):


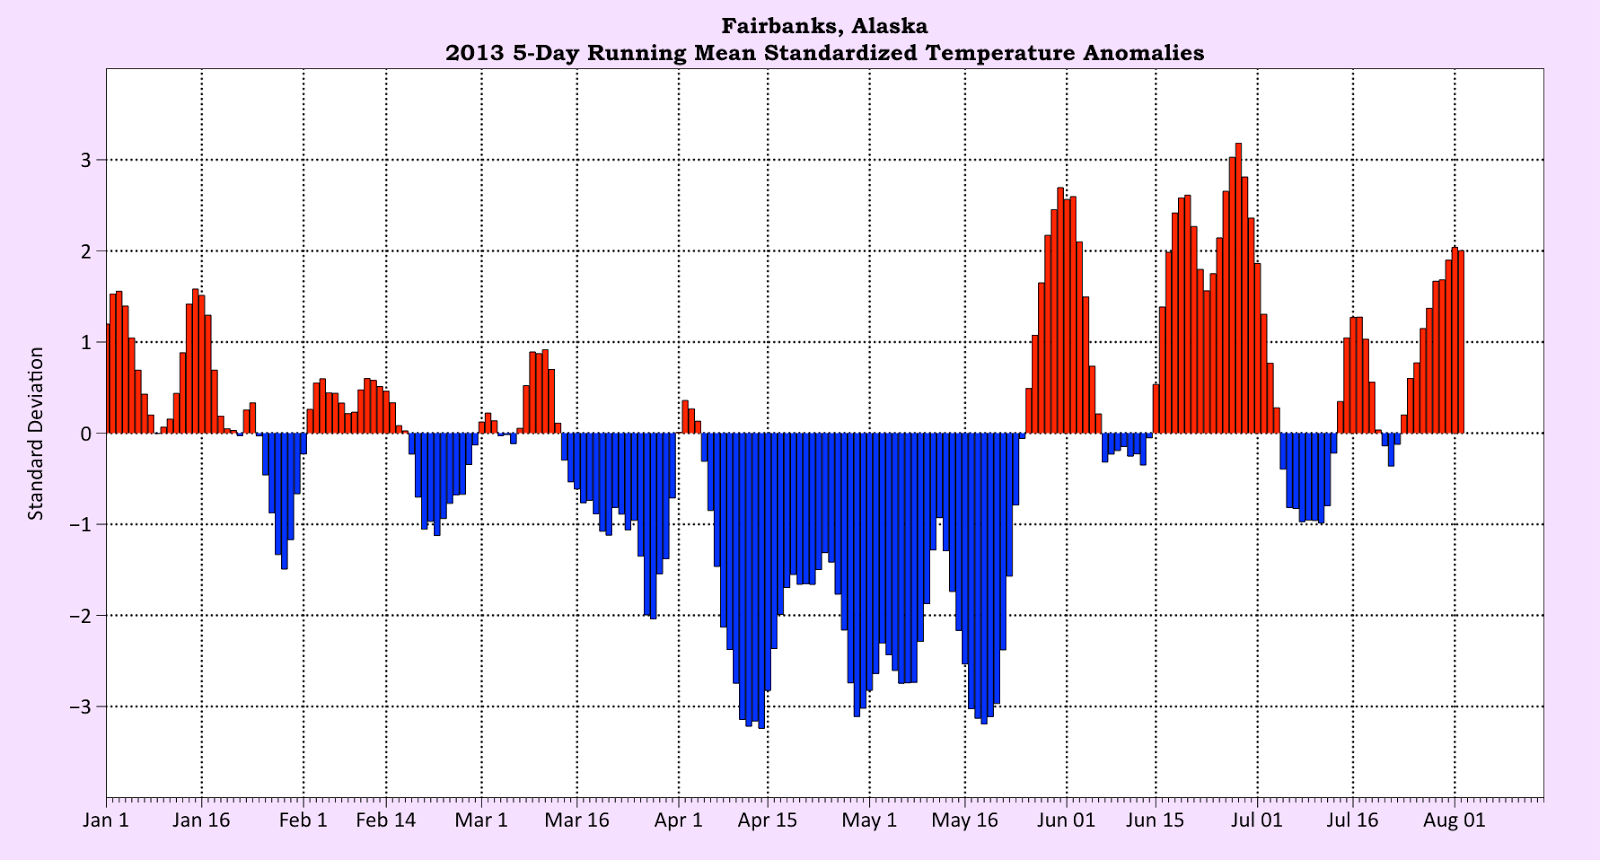
As we all know, absolute temperature departures from normal are much smaller in the summer than in the snow cover season. So, of course I have to include a standardized departure plot, which accounts for the much smaller temperature variability in the summer.

This is the five-day running standardized departure, which smooths the day to day variation and clearly illustrates that we've had a lot of unusual weather since late March.

Friday, August 2, 2013

Year to Date Temperature Anomalies

So far the temperatures in 2013 have run hot and cold both literally and metaphorically. Through August 2nd there have been 214 calendar days for which daily temperature anomalies can be evaluated. The chart below categorizes the daily temperature anomalies for the three main population centers in Alaska by standard deviations from the mean. An expected value, based on the normal distribution, is also shown for each category. What really stands out is how many days both Anchorage and Fairbanks were more than on standard deviation from the mean and how many days all three cities were more than two standard deviations from the mean.

Note: So far this year Fairbanks is 1.4 degrees below normal, Anchorage is 0.6 above normal, and Juneau is 0.4 degrees above normal.


July anomalies

Below are a couple of maps showing the July temperature and precipitation anomalies at observing locations across Alaska.  The format was inspired by Rick's practice of comparing anomalies to the width of the local historical distribution; this allows a more meaningful comparison between locations with widely differing climates.

In the first map (temperature), the area of each circle shows the magnitude of the standardized anomaly, which is calculated as (July mean - 1981-2010 mean)/(1981-2010 standard deviation).  The second map (precipitation) depicts the significance of the precipitation anomaly by using the rank of the July total compared to the 30 July totals in the 1981-2010 period; so the largest possible circle is obtained when the July total is either smaller or larger than any in the 30-year period.  If the July total falls in the middle of the historical distribution, the circle has zero radius (i.e. precipitation was close to average).

The numbers at the observing locations show the actual values for the mean temperature and total precipitation.


Thursday, August 1, 2013

Sunshine Duration Through the Year

The sun sets at Barrow on Friday morning, August 2nd at 157am AKDT for the first time since early May. So here's a plot of possible sunshine (duration the sun is above the horizon) through the year for some representative Alaska location:
I've include 18 months to get the full effect of month the winter minimum and summer maximums.

Why So Warm?

Reader Gary asked about the cause of the warm summer in much of Alaska and pointed to the upper-atmosphere flow pattern as an explanation.  In a certain sense this is undoubtedly correct, because observed weather patterns at the earth's surface are always closely related to the configuration of the air flow at various heights in the atmosphere.  This summer has seen unusually strong upper-level high pressure across Alaska, especially in the south.

Looking at a few maps, the first chart below shows the average (1981-2010) 700 mb height field in June and July, which can be thought of as the pressure pattern at about 3 km or 10,000 feet above sea level; there is a mean trough in the Bering Sea and extending into the Gulf of Alaska, and a ridge extending up from British Columbia to eastern Alaska.
Now let's look at the average 700 mb height this summer so far (since June 1), see below.  Heights have been much higher than normal over most of Alaska, as the southeastern ridge has been very strong and the Bering Sea trough has been weak.
Taking the difference between this year's average and the long-term mean shows where the height has been most unusual, see below.
What does this all mean?  Two things, as I see it: first, the source region of the air over southern and interior Alaska has been predominantly far to the south, so that the prevailing air mass has been very warm.  Chilly Arctic air has stayed out of the picture, because the strong ridge has kept cold fronts well to the north and west.  Second, the ridge has caused subsidence and low humidity in the lower atmosphere, leading to plentiful sunshine and dry conditions, which in turn favors higher temperatures.  Thunderstorms have been scarce because the atmosphere has been stable.

Having said all this, in my view the upper-air flow pattern is ultimately unsatisfying as an explanation for the warm weather, because the question immediately turns to "what caused the ridge"?  Why did the weather pattern evolve this way in the summer of 2013?  This is an enormously difficult question, and I only have one small piece of possible insight to offer: this summer's pattern may (perhaps) be (partially) related to the phase of the Quasi-Biennial Oscillation (QBO).  The QBO is a fairly regular cycle in east-west winds in the tropical stratosphere, i.e. about 15-50 km above sea level at the equator.  Over a period of about 2-3 years, the wind direction reverses from east to west and back again, and it is known that the phase of the oscillation affects weather and climate variations around the globe.  This summer there happens to be a strongly positive phase of the QBO, so I looked up previous years with similar phase and found the following pattern of 700 mb heights near Alaska:


The map shows that higher heights are more common from the Bering Sea to southeast Alaska when the QBO phase is significantly positive in summer.  So it's possible that the QBO phase this summer raised the likelihood of a strong ridge developing over Alaska, although it certainly cannot be cited as the only reason.  Note that several of the top QBO years listed on the map brought cool summers in Fairbanks (e.g. 2008, 2002, 2006), so it is far from a one-to-one correlation.  Also, I can't comment on the exact mechanism by which the QBO might influence the flow pattern near Alaska - it's purely a historical observation and may be a coincidence.

Rick and Brian may have more to add on causes of the warm summer - and any other insight or suggestions from readers would be most welcome.

Tuesday, July 30, 2013

Record Warm Spell for Anchorage

* Updated 7/31

Much as already been made regarding the breaking of the record for consecutive 70-degree days for Anchorage. Today is day number 14 in a row and the forecast for the next several days indicates that the record will be extended. What has not been noted anywhere is that the last two weeks has been the warmest two week period ever measured in Anchorage when looking at the average daily temperature. Here is the list:

14-Day Ave Temp            Date Range              Rank
          64.96             7/17/2013 - 7/30/2013      1 * (minor edit on 7/31)
          64.89             7/7/2003 - 7/20/2003        2
          64.82             6/20/1953 - 7/3/1953        3
          64.75             7/18/1936 - 7/31/1936      4

In addition, Anchorage (and Fairbanks) are closing in on their warmest summer-to-date records. Here is an update of the chart uploaded a few days ago.


Note: Each of the thin lines represents the cumulative average temperature for the summer season at a specific point in the season for the 10 warmest summers on record. Here is an example of how it works.

Date            Temperature       Season-to-Date Temp.     Calculation
June 1               66                              66.0                       66 / 1
June 2               62                              64.0                       (66+62) / 2
June 3               71                              66.3                       (66+62+71) / 3
June 4               67                              66.5                       (66+62+71+67) / 4
June 5               65                              66.2                       (66+62+71+67+65) / 5

At the beginning of the summer there is a lot of variation since the value in the denominator is small. Over the course of the summer the lines tend to converge.


Monday, July 29, 2013

North Slope Cold Front

It's a raw summer day in Barrow with drizzle, mist, 34 °F, and winds gusting to 30 mph.  The UAF webcam reveals bits and pieces of sea ice along the beach.


A strong cold front went through yesterday just after midday, bringing a sharp temperature drop after late-morning warmth of near 60 °F.  In advance of the front, a substantial amount of rain accompanied the warm, moist airmass: the daily precipitation total of 0.55" and the two-day total of 0.70" are the highest respective precipitation amounts in Barrow in over three years.

Today's pocket of cold air is apparent in the following time-height temperature cross-section for Barrow, which shows a computer forecast for the lower atmosphere beginning at 10 am ADT yesterday; time increases to the right and the vertical axis is pressure in mb.  Surface temperatures near or a little below freezing are possible for the rest of today and into tonight.


Saturday, July 27, 2013

Summer-to-Date Temperatures

Through July 27th, both Fairbanks and Anchorage are well on their way to Top 5 warmest summers on record. As is stands now, Fairbanks is in 4th place with a season-to-date temperature of 65.3F. In first place is the questionable summer of 1915 with 1975 and 2004 close behind – each of those years is approximately a full degree ahead of 2013. For Anchorage, the season-to-date temperature of 59.95F is only 0.2F below the record pace of 2004. The chart below shows the Top 10 warmest summers for each city with the running mean of June 1st through August 31st. The 2013, and 1981-2010 normals are shown and thick solid and thick dashed lines respectively.


Arctic Sea Ice Update

There is much more ice in the Beaufort Sea presently (July 27th) than last year at this time. Here's the Alaska-centered graphic from the University of Illinois Cyrosphere Today:

The  difference in the Beaufort Sea coverage between last year and this year is shown at the endpoints of this plot:
Arctic-wide, the sea ice coverage is not quite as low as the record low last year, but it is close, thanks to much less ice on the Atlantic side of the Arctic. This year continues the pattern we've seen since 2007, with different parts of the Arctic having different year to year melt patterns, but for the basin as a whole the ice coverage continues to decrease. The melt season has another six to nine weeks to go, and a vigorous storm earlier this week well north of Alaska may have broken up a lot of northern Beaufort Sea ice, so the accelerating decline evident on the Beaufort Sea ice area plot is likely to continue.

Friday, July 26, 2013

Kenai Rainfal

Last night just before midnight AKDT, the Kenai Municipal Airport recorded 1.23" of rain in one hour (and 1.83" in two hours). This is an extraordinary amount. To put it into perspective, according to the newly released NOAA precipitation atlas for Alaska (http://hdsc.nws.noaa.gov/hdsc/pfds/pfds_map_ak.html), an hourly reading of 1.17" has a 1/1,000 chance of occurring in any given year for the city of Kenai (1,000-year recurrence interval). The 1,000-year recurrence interval for a two hour rainfall is 1.48". Wow! One of the resources that NOAA used to generate their numbers can be found at the following link: ftp://hdsc.nws.noaa.gov/pub/hdsc/data/ak/dur01h_ams_na14v7.txt . According to that rather abbreviated list, here is a list of the top 1-hour rainfall events in Alaska (I accidentally deleted the date column, sorry):

Station Hourly Rain (in.)
80-1940 PREACHER        , AK   1.67
50-6586 NORTHWAY AP     , AK   1.48
80-2440 TELIDA  , AK   1.33
80-0100 ALCAN HWY   1.32
80-2440 TELIDA  , AK   1.32
50-0352 ANNETTE ISLAND AP       , AK   1.22
80-0460 CHATANIKA       , AK   1.22
80-2620 VUNZIK LAKE     , AK   1.21
50-9941 YAKUTAT STATE AP        , AK   1.20
80-1280 KAIYUH  , AK   1.20

Chilly Morning at Eagle

A quick update to note the overnight minimum temperature of 34 °F at Eagle airport; this breaks the daily record of 36 ° set in 1958 and 1968.  However, most of Eagle's daily record minima in late July are 34 ° or lower, so this morning's chill is not all that unusual.  In 2005 the temperature dropped to 29 ° on July 21 and 30 ° on July 31.

Reader Gary asked about a 2013 precipitation chart, so here it is for Fairbanks.