Showing posts with label Tempertaures. Show all posts

Saturday, April 12, 2014

Cold and Warm Spots in U.S. With and Without Alaska

A few months ago we blogged about the stations in Alaska that recorded the lowest temperature in the state most frequently in 2013 (see post HERE). Since we now have data for primary stations across the Lower 48, I thought it would be interesting to see how often Alaska had the daily high or low when looking at the entire U.S. during 2013.

This analysis is slightly different that the January analysis in that only primary stations are evaluated; i.e., no Cooperative, SNOTEL, RAWS, or Mesonet stations. The volume of data would overwhelm my computer to assess all of that data.

Figures 1 and 2 show the count of the number of days a primary station (n=1025) recorded the lowest high temperature in the U.S. with and without Alaska respectively. If a tie occurs, each station receives a tally. Each small gray dot represents a station used in the analysis. When Alaska is included, here is the top 5 list of stations:

1) Barrow 4 ENE, AK (116)
2) Nuiqsut AP, AK (99)
3) Deadhorse AP, AK (46)
4) Mt. Washington, NH (17)
5) Barrow Post Rogers AP, AK (15)

When Alaska is excluded, here is the top 5 list of stations:

1) Mt. Washington, NH (147)
2) Beaver 15 E, UT (27)
3) Boulder 14 W, CO (27)
4) Northgate 5 ESE, ND (22)
5) Mauna LOA 5 NNE, HI (20)

Figure 1. Count of times a station recorded (or tied) for the lowest high temperature in the U.S. (Alaska included).

Figure 2. Count of times a station recorded (or tied) for the lowest high temperature in the U.S. (Alaska excluded).

Of course Alaska frequently records the lowest minimum temperature in the country on most days of the year. The next two maps show how the count of daily low temperatures across the country look when Alaska is included (Figure 3) and excluded (Figure 4).

Figure 3. Count of times a station recorded (or tied) for the lowest low temperature in the U.S. (Alaska included).

Figure 4. Count of times a station recorded (or tied) for the lowest low temperature in the U.S. (Alaska excluded).

When Alaska is included, here is the top 5 list of stations:

1) Nuiqsut AP, AK (60)
2) Barrow 4 ENE, AK (42)
3) Deadhorse AP, AK (37)
4) Eagle AP, AK (33)
5) Stanley RS, ID (32)

When Alaska is excluded, here is the top 5 list of stations:

1) Stanley RS, ID (60)
1) Mt. Washington, NH (42)
3) Provo 22 E, UT (35)
4) Yellowstone Lake, WY (28)
5) International Falls, MN (19)

Not surprisingly, Alaska did not record a single occurrence of having the warmest high temperature or the warmest low temperature in the U.S. in 2013. Figure 5 shows the number of days that a station recorded the highest maximum temperature in the nation and Figure 6 shows the number of days that a station recorded the highest minimum temperature in the nation.

Figure 5. Count of times a station recorded (or tied) for the highest maximum temperature in the U.S. (Alaska included).

Figure 6. Count of times a station recorded (or tied) for the highest minimum temperature in the U.S. (Alaska included).

Sunday, March 16, 2014

Season of Freezing Temperatures

Every so often I do a quick climate analysis for a blogger in Houston, Texas, and one of the things that came up earlier in the winter was the frequency of freezing temperatures down there. In a few weeks, stations in Alaska will be approaching the date at which freezing temperatures are no longer expected. Therefore, I thought it would be interesting to look at 1) the number of days per season with sub-freezing temperatures and 2) the length of time between the average first freeze and the average last freeze. Specifically, I was interested in how Fairbanks compares to other places in Alaska and the Lower 48.

Number of Freezes

As the analysis unfolded, it became apparent that the Fairbanks International Airport station's values did not appear representative of the greater Fairbanks area. For example, the number of sub-freezing days per season at the airport's official station is 222.7. However, the Fairbanks Airport #2 station records 237.1 sub-freezing days. Therefore, I used an average of five stations to generate a single Fairbanks value of 226.6 sub-freezing days.

Figures 1 and 2 show the number of days with subfreezing temperatures for Alaska and for the entire U.S. respectively. Figure 3 shows the stations used in the Analysis. All stations with a value greater than Fairbanks' 226.6 (rounded to 227) are shown in blue dots. Note that the color scale is different on the two maps. I was a little surprised at the number of stations in Alaska that have more freezing days than Fairbanks – particularly places west of Fairbanks like Galena, Kaltag, and Tanana.

Figure 1. Map of Alaska showing the annual number of days with a temperature of 32°F or lower. Stations with a larger annual value than Fairbanks are highlighted in blue.

Figure 2. Map of the U.S. showing the annual number of days with a temperature of 32°F or lower. Stations with a larger annual value than Fairbanks are highlighted in blue.

Figure 3. Stations used in the analysis of sub-freezing temperatures. To qualify for the analysis, a station must have at least 10 complete years of data beginning in 1980-1981 (maximum of 33 years). Any year with more than 15 missing observations was excluded. There were 181 stations that met those qualifications in Alaska and 1025 in the rest of the U.S. The Lower 48 analysis did not include Cooperative or RAWS stations.

Length of Freezing Season

Another way of describing the frequency of freezing temperatures is to define a season where freezing temperatures are likely to occur. This is the opposite of a growing season. In this section I did a simple subtraction of the average date of the last freeze of the season minus the average date of the first freeze of the season. For Fairbanks, the average of the five stations that are collectively referred to a 'Fairbanks Valley' on the maps is 257 days (Sept 5 - May 20). Figures 4 and 5 show the number of days with in the freezing season for Alaska and for the entire U.S. respectively. All stations with a value larger than Fairbanks' are shown as blue dots (see Figure 3 for a map of all stations).

Interestingly, the number of stations in Alaska with a longer freezing season than Fairbanks is larger than the number of stations with a larger count of freezing temperatures. This implies that Fairbanks drops quickly into a freezing temperature regime in the Fall and bounces out of the freezing temperature regime quickly in the spring. This is also evident when comparing Figure 2 with Figure 5; that is, quite a few stations in the Lower 48 have a longer freezing season than Fairbanks (or most other Alaska stations for that matter). In the case of the Lower 48 stations, they are frequently at high elevations (less atmosphere to radiate longwave energy downward) and also have 8-10 hours of darkness in the summer (unlike Fairbanks) when heat can be radiated upward.

Figure 4. Map of Alaska showing the average number of days between the first freeze of the season and the last freeze of the season. Stations with a larger annual value than Fairbanks are highlighted in blue.

Figure 5. Map of the U.S. showing the annual number of days  between the first freeze of the season and the last freeze of the season. Stations with a larger annual value than Fairbanks are highlighted in blue.

Data Set

There are many interesting values that popped out. Far too many to mention. Therefore, for anyone who is interested, here is a LINK to the entire data set as an MS Excel file. The file is 2.8 megabytes.


Friday, February 28, 2014

Periodic Thermal Waves

*Updated to add 500mb anomaly reanalysis maps at the bottom *

A few days ago I thought it would be interesting to see what would happen when calculating what day of the week was the warmest in the U.S. It was intended to be a silly exercise to demonstrate that even if one day was the highest it would be statistically trivial. I looked at 'primary' stations only since my poor computer could only handle two years at once before crashing. So I queried 2012 and 2013.  Well, much to my surprise, there were very distinct patterns. Not only were the patterns geographical, but the were temporal and propagated from west to east. Figure 1 shows the warmest days of the week for all primary stations in the U.S. Across areas with minimal longitudinal variation, the daily percentages are staggeringly variable. In Alaska for example (see Figure 2), an amazing 41% of stations were warmest on Thursday and only 4% are warmest on Tuesday or Wednesday. To me, that is a signal indicating a possible climate connection.

Fig 1. All primary stations in the U.S. mapped according to which day of the week during 2012 and 2013 was the warmest (1=Sunday, 2 = Monday, and so on.) Only stations with 95% complete data were used.

Fig 2. All primary and RAWS stations in Alaska mapped according to which day of the week during 2012 and 2013 was the warmest (1=Sunday, 2 = Monday, and so on.). Only stations with 90% complete data were used.

I then set out to check time periods other than seven days. Of course a seven day period corresponds very nicely with a calendar week. I checked time periods between 2 and 30 days. For the 30-day period think of it as grouping Jan 1, Feb 1, March 1, etc. and calling those "Group 1". Then take Jan 2, Feb 2 March 2, etc. and call those "Group 2". 

After a little trial and error, it was pretty obvious that 4-days was a very prominent pattern for the Lower 48 and modestly prominent for Alaska. Figure 3 shows which of the repeating 4 days is the warmest for the Lower 48 and Figure 4 shows the same but for Alaska.

Fig 3. All primary stations in the U.S. mapped according to which day, of a repeating 4-day pattern, during 2012 and 2013 was the warmest. Only stations with 95% complete data were used.

Fig 4. All primary and RAWS stations in Alaska mapped according to which day, of a repeating 4-day pattern, during 2012 and 2013 was the warmest. Only stations with 90% complete data were used.

Looking at the ESRL Reanalysis data (see Figures 5, 6, 7, and 8 below), a very clearly defined 4-day thermal wave is evident. I compared each of the four repeating days with the other days in the 4-day set to track the atmospheric patterns for 2012 and 2013. I am quite amazed that given the number of days used in the analysis (728) that any pattern whatsoever holds up. If the 4-day pattern was 3.5 or 4.5 days it would break down in the reanalysis data after a while. When I ran the same analysis at the 7-day interval (not shown) a noticeable, but less prominent thermal wave was also evident. I can share those images with anyone who may be interested.

So what recurs at 4 and 7 days. One obvious answer is planetary (Rossby) waves. They tend to recur at 7-day intervals according to the literature but their period is pretty variable and is highly dependent on the number of waves. The fact that the 7-day pattern in Figure 1 is more prominent between 40°N and 50°N lends credence to the planetary wave origin for that length time period. But what about the 4-day pattern? It has a much stronger signal. Is it related to planetary waves? What drives the thermal push depicted in Figures 5-8? Also, might the 7-day pattern actually be a 1/2 strength version of the 4-day pattern since 7 is almost, but not exactly, a multiple of 4?

Surely this is not a new discovery. My brief search of the literature didn't lead to any obvious answers beyond the Rossby wave solution. Any ideas would be much appreciated.
Fig 5. Day 1 of the 4-day thermal wave as depicted by the ESRL daily composite reanalysis. A wave axis is superimposed as a red line. This is a compilation of all Day 1s minus the average of Days 2, 3, and 4. 728 days were used in the analysis.


Fig 6. Day 2 of the 4-day thermal wave as depicted by the ESRL daily composite reanalysis. A wave axis is superimposed as a red line. This is a compilation of all Day 2s minus the average of Days 1, 3, and 4. 728 days were used in the analysis.


Fig 7. Day 3 of the 4-day thermal wave as depicted by the ESRL daily composite reanalysis. A wave axis is superimposed as a red line. This is a compilation of all Day 3s minus the average of Days 1, 2, and 4. 728 days were used in the analysis.


Fig 8. Day 4 of the 4-day thermal wave as depicted by the ESRL daily composite reanalysis. A wave axis is superimposed as a red line. This is a compilation of all Day 4s minus the average of Days 1, 2, and 3. 728 days were used in the analysis.


* Update section

After reading a section from a paper from 1976 (Blackmon, M. L. 1976. A climatological spectral study of the 500 mb geopotential height of the Northern Hemisphere. J. Atmos. Sci. 33, 1607 -1623.) that describes the propagation period of Rossby waves as 20° longitude per day, I decided to make reanalysis plots of the 500 mb height anomalies. The 20° value corresponds to 1/4 of the width of the Lower 48 states. Therefore, the 4-day thermal wave may be entirely explained by that.The wave train of anomalies stands out very nicely and clearly propagate from west to east. 
Fig 9. 500mb height anomaly on Day 1 of the 4-day thermal wave as depicted by the ESRL daily composite reanalysis. This is a compilation of all Day 1s minus the average of Days 2, 3, and 4. 728 days were used in the analysis.
Fig 10. 500mb height anomaly on Day 2 of the 4-day thermal wave as depicted by the ESRL daily composite reanalysis. This is a compilation of all Day 2s minus the average of Days 1, 3, and 4. 728 days were used in the analysis.
Fig 11. 500mb height anomaly on Day 3 of the 4-day thermal wave as depicted by the ESRL daily composite reanalysis. This is a compilation of all Day 3s minus the average of Days 1, 2, and 4. 728 days were used in the analysis.
Fig 12. 500mb height anomaly on Day 4 of the 4-day thermal wave as depicted by the ESRL daily composite reanalysis. This is a compilation of all Day 4s minus the average of Days 1, 2, and 3. 728 days were used in the analysis.

Friday, January 24, 2014

What Might February Look Like

Several people have asked me if the rest of the winter will be as warm as the last several weeks have been. While there is no way to tell for sure, it is helpful to look back at February's that follow exceptionally warm January's. To do this, I looked at all of the GHCN data from NWS and COOP stations (no RAWS) and organized them by climate division according to Bieniek et al (citation at the end of the post). Then, each climate division was weighted according to the proportion of the state that the division encompasses. Between 1940 and 2013, here are the ten warmest and coldest January's.


What I wanted to know was not only how those ten January's looked (first map below) but more importantly, how the February's afterward looked. To my surprise, the February's were essentially normal. In one sense, the temperatures always tend to drift toward normality; however, I expected the forcings that caused the warm January's to have a residual effect in February too. The ESRL database that I used to generate the maps has data beginning in 1948 so any years from the top 10 list that fell between 1940 and 1948 was substituted with the next year down on the list. Unfortunately the ESRL database that goes back to the beginning of he 20th century is temporarily out of order.


Bieniek, Peter A., and Coauthors, 2012: Climate Divisions for Alaska Based on Objective Methods. J. Appl. Meteor. Climatol.51, 1276–1289.

Saturday, August 3, 2013

Fairbanks Temperature Updates

Here's some updated Fairbanks temperature and anomaly plots to compliment Brian's post Friday. First, the plot of the daily mean temperature reflected around the 1981-2010 normal:


The sustained, though not monolithic warm weather since late May is evident. Next is the raw daily departure from normal (and for good measure the year to date running departure):


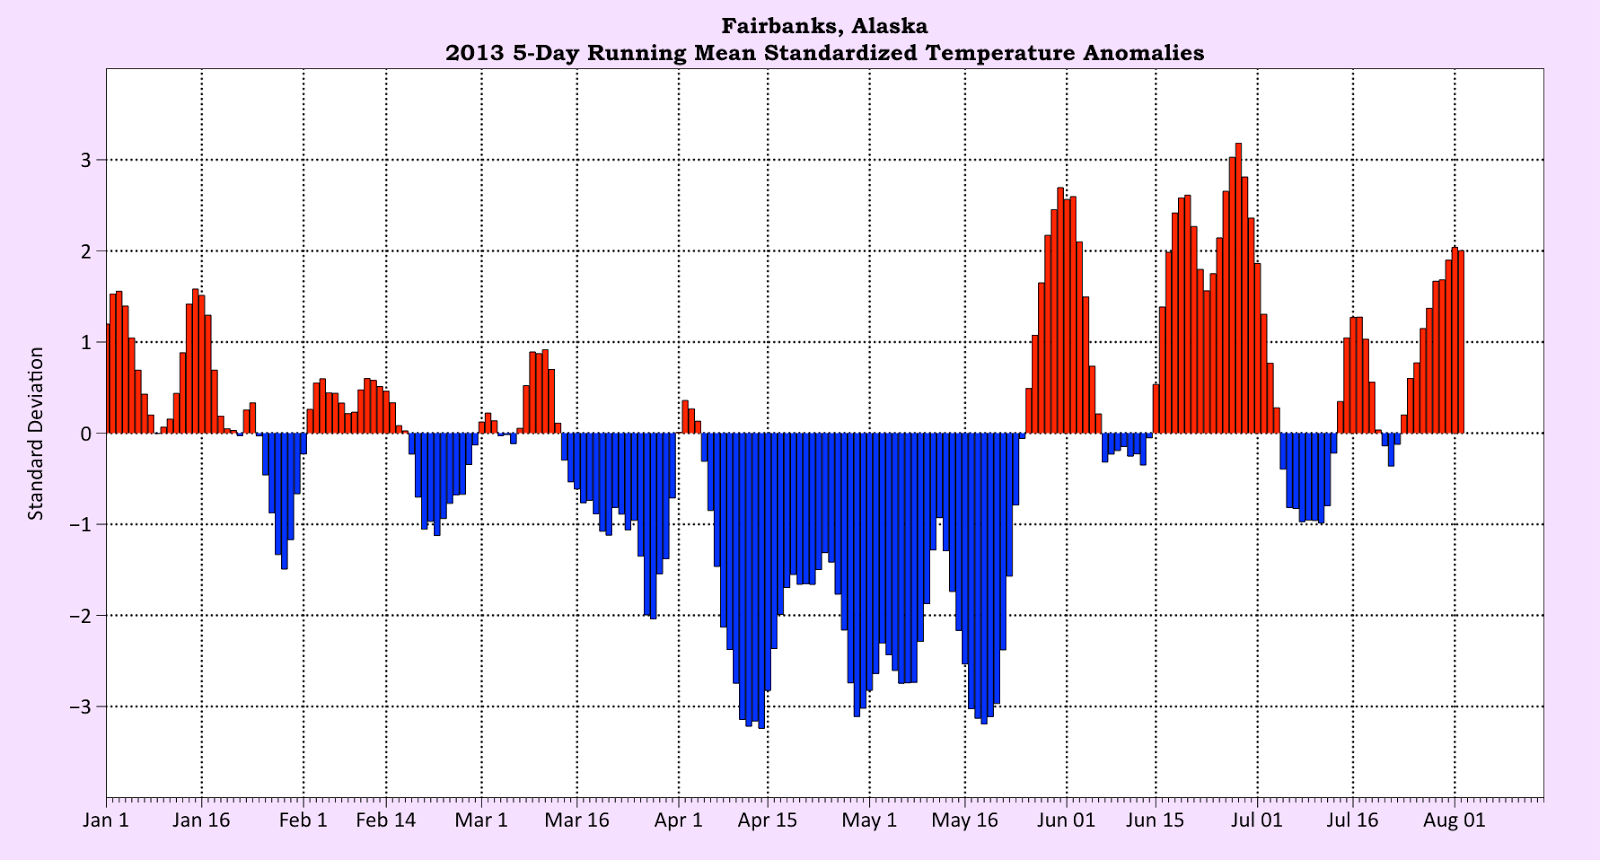
As we all know, absolute temperature departures from normal are much smaller in the summer than in the snow cover season. So, of course I have to include a standardized departure plot, which accounts for the much smaller temperature variability in the summer.

This is the five-day running standardized departure, which smooths the day to day variation and clearly illustrates that we've had a lot of unusual weather since late March.

Saturday, April 13, 2013

The Cold April week

Updated with Saturday, April 13th stats

Fairbanks has chilled through the coldest April week since the 1920s. The average temperature Saturday, April 6th through Friday, April 12th was +2.6ºF. This is the coldest week wholly within April (no end-of-March days) since April 2-8, 1927, when the average temperature was also 2.6ºF. The coldest April week was in 1924, when the average temperature April 1-7 was -1.5ºF. If we include the last couple of days of March, then this is the coldest "mostly April" week since March 30-April 5, 1985, when the average temperature was 1.7ºF. This was not quite the coldest week so late in the season: April 7-13, 1911 had an average temperature of 1.0ºF.

Update: Saturday came in with a high of 25ºF and a low of -13ºF. So, the week of April 7-13th is now the coldest (and this should be the bottom), with an average temperature of +2.2ºF.  This the coldest April week since April 3-9, 1924, when the average temperature was +1.9ºF.  

The lowest temperature this week was 21 below on the 10th, the lowest April temperature since 1992. The only daily record temperature set was the low of 15 below on the 11th, which broke the previous record of 12 below set in 1936.

From my favored standardized anomaly viewpoint, the average daily temperature on Thursday, April 10 was 3.0 standard deviations below normal. This is the largest daily negative anomaly since June 4, 2006 (-3.4). However, this was only the absolute largest anomaly since May 28, 2011 (+3.1). A quick analysis of the weekly anomaly, using the full Weather Bureau/NWS era, 1930-2013 as a base comes to -2.9. This is no where close to the greatest negative weekly anomaly in April: April 20-26 1924 and 1948 both came in at -4.0.

Update: The average temperature of +2.2ºF for April 7-13 is 3.0 standard deviations below the 1930-2013 mean. 

How did this happen: cold low aloft. Here's the mean 500mb heights for April 6-12:
Courtesy NCEP/NCAR reanalysis
There have been no upper air records set or even approached. Rather, it's the duration of the cold pattern that has produced the cold April week.

Saturday, December 15, 2012

Back in the Drink

Courtesy of Alaska Climate Research Center
A cold airmass and only variable low cloud cover have allowed temperatures to again plunge in Fairbanks-land. Low temperatures through 10am include:

Fairbanks Airport: -41F
Goldstream  Creek: -38F
Fort Wainwright: -36F
Eielson AFB: -34F
UAF West Ridge: -32F
Keystone Ridge: -26F
Cleary Summit: -20F

Saturday, December 1, 2012

Following the Bouncing Inversion

Here's a plot of the daily high temperatures in November for Fairbanks Airport and Keystone Ridge (about 1150' elevation difference). Notice the dramatic and sustained increase in inversion strength following Thanksgiving.

Thursday, November 1, 2012

Variable Winds Modulating Temperatures

1200 UTC Surface Analysis courtesy of Environment Canada
An interesting wind situation has prevailed in the past day over the Fairbanks area, with widespread northeast winds right down to the valley floor. The average wind at the Fairbanks Airport on Wednesday was 14.1 mph. This is most unusual this time of year for a northeast wind event: persistent winds this strong in winter typically occur with southwest flow following a frontal passage. The surface analysis for 4am ADT Thursday from Environment Canada shows the 1039bm high over the Brooks Range, with a decent, though not extreme pressure gradient over Interior Alaska.  The winds Thursday morning have slacked in some valley areas, allowing temperatures to fall smartly: down to 11 below at Woodsmoke near North Pole and 4 below at Fort Wainwright and Fairbanks International. However, one of the usual cold spots, Goldstream Creek, had puffs of wind all night. The temperature dipped to 2 below about 3am, then was back up to 7 above by 730am.

Thursday, October 4, 2012

Warm October Day

Temperatures rose into the 50s and lower 60s in southern Interior Alaska on Thursday. The high at Fairbanks Airport of 61F was just a degree shy of the October 4th record of 62F set in 1923. Other highs included 61F at Fort Greely, 59F at Fort Wainwright and Nenana, 58F at UAF West Ridge and 54F at Keystone Ridge. The unseasonably warm weather is the result of deep southerly flow aloft. This geostationary image from 630pm ADT Thursday tells the story:

The deep low in the central Bering Sea is the extra-tropical rebirth of ex-Typhoon Jelawat. The occlusion is stretched northeast to southwest across mainland Alaska, and south of Kodiak you can see the clouds arcing around a big high aloft centered over the southeast Gulf of Alaska. While temperatures will cool off some, for the most part it looks to remain warmer than normal through the weekend.

Friday, August 10, 2012

The Deepening Night

Daily solar heating is decreasing rapidly now, and the effects of less daytime heating and longer nights are showing: it's almost getting (briefly) dark now. This is being accentuated by high pressure aloft, which is keeping skies mostly clear over the Interior: below is the 500mb analysis for 4am ADT Friday from Environment Canada, showing the elongated high centered about at 63N.

Updated Friday morning low temperatures in Fairbanks-land show a substantial nocturnal inversion and include:
Angel Creek RAWS: 28F
Goldstream Creek: 29F
Woodsmoke PWS: 32F (near North Pole)
UAF West Ridge: 39F
Eielson AFB: 39F
Fairbanks Airport: 42F
Keystone Ridge: 47F
Clearly Summit: 49F
Nenana Hills RWIS: 51F

Thursday, February 16, 2012

How Warm Has it Been?

The average temperature at the Fairbanks Airport the first two weeks of February was +5.6F. This is about 10 degrees above normal, but is only the 17th warmest first half of February of record. Temperatures are not expected to show overall much change the next few days, though low temperatures will vary in valleys depending on overnight cloud cover.