Friday, December 6, 2013

Snow Depth Thoughts

Brian's post the other day raised some intriguing questions about the relationship between snow depth and snow totals in Fairbanks.  The paradox that he observed is that snow totals in recent years have often been below normal while snow depth has been near or above normal.  Has the snow become less dense or undergone less compaction?  The chart below shows a different depiction of the same trend, using the ratio of the February 28 snow depth to the snow total through that date.  I chose February 28 because it's approximately the time when snow depth peaks; the strengthening sun causes more sublimation and eventually melting in March and later.  We see that indeed the late winter snow depth has become larger in recent years compared to the accumulated snowfall total (as measured daily at the airport).


If we look at the total annual snowfall in the cold season (see chart below), we see that recent years have seen snowfall on the low side compared to the 1981-2010 climate normal period; 12 of the last 18 years have been below the 1981-2010 median of 52.5".  This by itself could be part of the explanation for the apparently lower snow density, because the fractional compaction of snow will decrease with smaller snow amounts.  Consider the bottom 12 inches of the snowpack: it will be compacted more if a greater mass of snow accumulates above; and so lower seasonal snowfall will produce lower snowpack density, on average.


Another interesting trend in the snowfall history is that snowfall has been occurring later in the season in recent years than in the 1981-2010 period overall.  The chart below shows the date at which half of the season's snowfall total was reached; in the 1970's and 1980's, nearly every year saw half of the snowfall occurring before the turn of the year, but in recent years the midpoint date has become later by two or three weeks on average.  I would suggest that this could also affect the late winter snow density, because if snowfall is occurring later, then it has less time to settle and undergo compaction; so again this might contribute to a "fluffier" snowpack.


One final thought about the snow depth trend is that measurement procedures could perhaps be subtly changing, leading to a bias in the recent years' observations compared to former years.  I don't think this is particularly likely in recent years, but interestingly the data suggest that something may have changed in or around 1983: consider the chart below, which shows the accumulated reduction in snow depth as a fraction of the total snowfall, through February 28.  I calculated this by adding up all the snow depth losses from day to day each season through February 28; this could be from compaction, sublimation, melting, or even wind redistribution.  Then I divided by the snowfall total, because of course total snow depth loss (mostly compaction) is closely related to the total snowfall.  The chart shows that since about 1983, on average 30 % or less of the snowfall has "disappeared" through these various processes, whereas prior to 1983, the loss was often above 40 % or even 50 %.  It's an intriguing result, perhaps worthy of more investigation; but the simplest explanation may be the most likely, which would be that measurement practices or site exposure have somehow changed.


Thursday, December 5, 2013

November Anomalies

Below are maps showing the November temperature and precipitation anomalies at some primary observing stations across the state.  The area of each circle indicates how unusual the month's conditions were, as measured by the anomaly in standard deviations for temperature and the percentile rank for precipitation (based on the 1981-2010 normals).  In the temperature map, the circle in the legend indicates the size of a 1 standard deviation anomaly, and in the precipitation legend, the circle size corresponds to a precipitation total that was outside the range of observations in 1981-2010.


The monthly temperature averages were fairly unremarkable for most of the state, with the largest departure from normal being at Cold Bay (+1.4 SD) and McGrath (+1.1 SD).  Interior Alaska saw much above normal temperatures in the first half of the month, but colder than normal conditions emerged after mid-month.

Precipitation was well above normal over most of western, interior, and northern Alaska; Bettles had their third wettest November of record, Gulkana their fourth wettest, and Fairbanks their fifth wettest.  Barrow experienced yet another month of above-normal precipitation, the ninth in a row; the year-to-date precipitation in Barrow is now the third highest on record.


Tuesday, December 3, 2013

Snow Depth Paradox

* Updated with additional chart*

Something that I have noticed over the last several years is a disconnect between the season-to-date snowfall and the snow depth for Fairbanks. Reader Eric also commented in the previous blog post about the normal snow depth and the below normal snowfall. The chart below shows the snow depth surplus/deficit and the season-to-date snowfall surplus/deficit in inches (y-axis). Including this winter, 5 of the last 6 winters show a paradoxical inverse correlation between snowfall and snow depth. This is somewhat puzzling. Is the snow "fluffier"; i.e., more dendrites? Is there less wind to compact the snow? Unfortunately there are no snow water equivalent measurements after 2001.

Note: the normal snow depth value is from the 1981-2010 NCDC climate normal database. The value used is the daily 50th percentile. When there is less than a 50% chance that the 50th percentile snow depth exists (a coincidence) the normal snow depth is listed as 0". That's why it goes from 8" on May 2nd to 0" on May 3rd. Only days where a published normal snow depth were used in this analysis (9/26 to 5/2 each year).


Near-Normal Precipitation

After the wettest November since 1970, and the fifth wettest of record, year-to-date precipitation in Fairbanks is now only slightly below-normal for the year; the summer's rainfall deficit has been almost made up by the wet conditions in early fall and the recent snow (and rain).  As shown in the chart below, the running total as of the end of November was 9.87", compared to a long-term mean of 10.33" for the 11-month period.  The long-term median for the same period is 10.01" - slightly lower because the distribution is slightly positively skewed - and so this year's total to-date is indeed very close to normal.


Monday, December 2, 2013

Extreme Inversion

[Update 5 pm AKST: this afternoon's sounding from Fairbanks showed an inversion of 31.7 °C or 57 °F as warming continued aloft.  This has only been matched on 7 previous occasions since 1948.]

This morning's balloon sounding from Fairbanks airport revealed a temperature difference of more than 30 °C (55 °F) between the surface temperature and the temperature at 5300 feet above ground level.  As shown in the chart below, deep warming has occurred in the past few days, and at 3 am this morning the temperature was only just below freezing at around 4000-5500 feet.  Computer models suggest that the temperature is probably now above freezing at the same levels, despite valley surface temperatures below -20 °F.


An inversion of 55 °F or greater is quite unusual in Fairbanks; the last time it was observed was in January 2005.  In the history of upper-air observations since 1948, the strongest inversion was 60 °F on December 4, 1956.  The chart below shows the maximum inversion strength by winter since 1948-49, with the red line indicating the 10-year trailing average.

An even stronger inversion was observed in McGrath this morning (31.9 °C or 57 °F), but this is slightly less unusual there, as very warm air aloft can reach McGrath more easily.  The strongest inversion observed in McGrath was 40.0 °C (72 °F) on January 13, 1966.

November Summary

Here's the November weather summary from the National Weather Service in Fairbanks.

PUBLIC INFORMATION STATEMENT
NATIONAL WEATHER SERVICE FAIRBANKS AK
530 PM AKST SUN DEC 1 2013

...MONTHLY WEATHER SUMMARY FOR NOVEMBER FOR FAIRBANKS ALASKA...

NOVEMBER 2013 IN FAIRBANKS STARTED OFF MILD...BUILT TO WILD
CRESCENDO IN THE MIDDLE OF THE MONTH WITH SNOW...FREEZING
RAIN...RAIN AND ONE OF THE MOST DESTRUCTIVE WIND STORMS IN THE
INTERIOR IN RECENT MEMORY...BUT ENDED UP ON A CALM AND COLD NOTE.

THE AVERAGE HIGH TEMPERATURE AT THE FAIRBANKS AIRPORT WAS 15.4
DEGREES ABOVE WHICH WAS 4.5 DEGREES ABOVE THE NORMAL HIGH
TEMPERATURE OF 10.9 DEGREES. THE AVERAGE LOW TEMPERATURE AT THE
FAIRBANKS AIRPORT WAS 3.2 DEGREES BELOW WHICH WAS 2.5 DEGREES
ABOVE THE NORMAL LOW TEMPERATURE OF 5.7 DEGREES BELOW. THE AVERAGE
TEMPERATURE WAS 6.1 DEGREES ABOVE WHICH WAS 3.5 DEGREES ABOVE THE
NORMAL AVERAGE TEMPERATURE OF 2.6 DEGREES. NOVEMBER 2013 RANKS AS
THE 43RD WARMEST OF 109 YEARS OF RECORD.

NOVEMBER 2013 WILL BE REMEMBERED FOR A DESTRUCTIVE STRONG STORM
SYSTEM THAT MOVED ACROSS THE WEST COAST AND INTERIOR THAT BROUGHT
FREEZING RAIN DURING THE DAY ON THE 13TH AND DAMAGING WINDS EARLY
MORNING ON THE 14TH THAT LEFT NEARLY 14000 PEOPLE WITHOUT POWER
ACROSS FAIRBANKS...NENANA...AND NORTH POLE AREA AS WELL AS
UPROOTED NUMEROUS TREES. THIS STORM EVENT WAS DECLARED A STATE OF
DISASTER BY THE FAIRBANKS NORTH STAR BOROUGH MAYOR ON MONDAY
NOVEMBER 18TH WHEN TEMPERATURES DROPPED TO 27F BELOW ZERO ON THE
19TH AND AN ESTIMATED 800 RESIDENTS FROM GOLDEN VALLEY ELECTRIC
ASSOCIATION WERE STILL WITHOUT POWER. THIS STORM SYSTEM HAD
INITIALLY STARTED OUT AS SNOW BRIEFLY AT THE FAIRBANKS AIRPORT
BEFORE SWITCHING OVER TO A MIX OF FREEZING RAIN AND SNOW THROUGH
THE EARLY MORNING ON THE 13TH. AS WARMER AIR MOVED ALOFT OVER THE
COLD SURFACE...WIDESPREAD FREEZING RAIN WAS REPORTED ACROSS THE
GREATER FAIRBANKS AREA ON THE MORNING OF THE 13TH. ALTHOUGH
DRIVING CONDITIONS WERE DIFFICULT AND SEVERAL ACCIDENTS WERE
REPORTED ON THE MORNING OF THE 13TH...MANY COMMENTED MORE ISSUES
WITH THE RAIN FREEZING INSTANTLY ON THE WIND SHIELDS RATHER THAN
THE ICY ROADS. SEVERAL DRIVERS HAD TO PULL OFF THE ROAD TO REMOVE
THE ICE ON THE WIND SHIELDS DURING THE MORNING COMMUTE. SEVERAL
REPORTS OF A QUARTER OF AN INCH TO ONE HALF INCH OF ICE
ACCUMULATION. THE WINTRY MIX OF FREEZING RAIN AND SNOW CONTINUED
THROUGH THE DAY WITH TOTAL SNOW ACCUMULATIONS ON THE 13TH OF 3.9
INCHES AT THE FAIRBANKS AIRPORT. SEVERAL REPORTS ACROSS THE AREA
RANGED WITH 4 TO 5 INCHES OF SNOW WITH THE STORM SYSTEM. AS THE
WARM FRONT PUSHED TOWARDS THE GREATER FAIRBANKS AREA DURING THE
LATE EVENING OF THE 13TH...SNOW QUICKLY STARTED TO MELT AS THE
SOUTHEAST WINDS INCREASED TO SUSTAINED WINDS OF 15 MPH AND GUST OF
26 MPH AT 1000 PM RECORDED AT THE FAIRBANKS AIRPORT. ALONG WITH
THE INCREASING WINDS THE TEMPERATURES ALSO INCREASED FROM 22F TO
44F IN TWO HOURS BETWEEN 800 PM AND 1000 PM AKST. REPORTS OF POWER
OUTAGES AND BLOWN TRANSMITTERS WERE REPORTED BETWEEN 1100 PM ON
THE 13TH THROUGH 1 AM AKST ON THE 14TH. ALTHOUGH THE STRONG
SOUTHEAST WINDS STARTED AS EARLY AS 1000 PM AKST ON THE 13TH AND
CONTINUED THROUGH 1 PM ON THE 14TH...THE PEAK WIND GUSTS RECORDED
AT THE FAIRBANKS AIRPORT WAS 55 MPH AT 1239 PM ON THE 14TH. OTHER
AREAS SUCH AS FORT WAINWRIGHT RECORDED A PEAK WIND GUSTS OF 62 MPH
AT 1239 AM AND 101 AM ON THE 14TH AND EIELSON AFG RECORDED A PEAK
WIND GUST OF 49 MPH AT 137 AM ON THE 14TH. FROM THE COLLECTED DATA
FROM 1930 AT THE FAIRBANKS AIRPORT FOR WIND RECORDS... THE 55 MPH
WIND GUST IS STRONGEST PEAK WIND GUST FOR THE MONTH OF
NOVEMBER AND THE 4TH STRONGEST PEAK WIND GUST AT THE FAIRBANKS
AIRPORT WITH THE RECORD PEAK WIND GUST OF 63 MPH SET ON JULY 7TH
1990. AS PREVIOUSLY MENTIONED...NUMEROUS TREES WERE UPROOTED
WITH SEVERAL REPORTS OF CAR...ROOF...AND HOUSE DAMAGE. THERE WAS
ALSO REPORT OF A PIPER SUPER CUB AIRPLANE WITH THE WINGS SHREDDED
AND DAMAGE ALL OVER THE PLANE. IT TOOK OVER A WEEK FOR GVEA TO
RESTORE POWER TO CUSTOMERS AND REPAIR THE DOWNED POWER LINES DUE
TO UPROOTED TREE DAMAGE.

NOVEMBER ALSO HAD LARGE AND IN SOME CASES RAPID TEMPERATURE
SWINGS. THE WARMEST TEMPERATURE AT THE FAIRBANKS AIRPORT OCCURRED
ON THE 14TH WHEN THE TEMPERATURE SOARED TO 45 DEGREES AND SET A
NEW RECORD HIGH TEMPERATURE FOR THE DAY. THE LOWEST TEMPERATURE
OCCURRED ONE WEEK LATER ON THE 21ST WHEN THE TEMPERATURE DROPPED
TO 33 BELOW. WARM CHINOOK WINDS BLOWING THROUGH THE ALASKA RANGE
BROUGHT LARGE AND RAPID TEMPERATURE FLUCTUATIONS ACROSS THE
FAIRBANKS AREA. THE TEMPERATURE JUMPED 39 DEGREES FROM 25 BELOW TO
14 ABOVE IN LESS THAN 24 HOURS AT THE FAIRBANKS AIRPORT ON THE
21ST AND 22ND. THE TEMPERATURE JUMPED 53 DEGREES AT EIELSON IN 24
HOURS. BOTH OF THESE TEMPERATURE SWINGS PALE IN COMPARISON TO THE
TEMPERATURE CHANGE THAT OCCURRED AT HEALY WHERE THE TEMPERATURE
JUMPED FROM 41 BELOW TO 40 ABOVE...AN INCREDIBLE 81 DEGREE
SWING...IN LESS THAN 24 HOURS. AS THE WARMING CHINOOK FADED AT
HEALY THE TEMPERATURE PLUNGED 32 DEGREES IN 4 HOURS.

PRECIPITATION THAT FELL AT THE FAIRBANKS AIRPORT TOTALED 1.74
INCHES WHICH WAS 0.67 INCHES ABOVE NORMAL AND RANKS AS THE 5TH
WETTEST OF 99 YEARS OF RECORD. NOVEMBER 2013 WAS ALSO SNOWY WITH
17.6 INCHES OF SNOW FALLING AT THE AIRPORT WHICH IS 4.4 INCHES
ABOVE THE NORMAL NOVEMBER SNOW FALL OF 13.2 INCHES. NOVEMBER 2013
RANKS AS THE 15TH SNOWIEST OF 98 YEARS OF RECORD. SNOW ON THE
GROUND STARTED WITH ONLY A TRACE ON THE 1ST BUT HAD GROWN TO 12
INCHES OF SNOW ON THE GROUND BY THE 29TH.

LOOKING AHEAD TO DECEMBER...THE AVERAGE HIGH TEMPERATURE DROPS
FROM 7 ABOVE ON THE 1ST TO 2 ABOVE ON THE 31ST. THE AVERAGE LOW
TEMPERATURE DROPS FROM 11 BELOW ON THE 1ST TO 16 BELOW ON THE
31ST. IN THE LAST 108 YEARS...DECEMBER TEMPERATURES HAVE VARIED BY
120 DEGREES IN FAIRBANKS...FROM A HIGH OF 58 ABOVE IN 1934 TO A
LOW OF 62 BELOW IN 1961. AVERAGE SNOWFALL IS 12 INCHES BUT HAS
BEEN AS MUCH AS 50.7 INCHES IN 1984 TO AS LITTLE AS A TRACE IN
1969. DECEMBER IS THE DARKEST MONTH OF THE YEAR WITH POSSIBLE
SUNSHINE DECREASING FROM 4 HOURS AND 35 MINUTES ON THE 1ST TO THE
ANNUAL MINIMUM OF 3 HOURS AND 42 MINUTES ON THE WINTER SOLSTICE.
BY THE 31ST POSSIBLE SUNSHINE INCREASES TO 3 HOURS AND 59 MINUTES
GAINING 17 MINUTES ALONG THE LONG CLIMB BACK TO THE MIDNIGHT SUN
ON THE SUMMER SOLSTICE IN JUNE.

THE OUTLOOK FOR FAIRBANKS FOR DECEMBER FROM THE CLIMATE PREDICTION
ENTER CALLS FOR EQUAL CHANCES OF ABOVE NORMAL...NEAR NORMAL OR BELOW
NORMAL TEMPERATURES. THE CLIMATE PREDICTION CENTER IS ALSO CALLING
FOR EQUAL CHANCES FOR ABOVE NORMAL...NEAR NORMAL OR BELOW NORMAL
PRECIPITATION.


OBSERVED LAST MONTH...11/2013

                         OBSERVED   RANK
AVG MAX TEMP (F)             15.4   37TH WARMEST OF 109 YEARS
AVG MIN TEMP (F)             -3.2   44TH WARMEST OF 109 YEARS
AVG TEMP (F)                  6.1   43RD WARMEST OF 109 YEARS
TOTAL PRECIP (IN)            1.74   5TH WETTEST OF 99 YEARS
TOTAL SNOW (IN)             17.60   15TH SNOWIEST OF 98 YEARS

$$

CCC/MAK
 

Saturday, November 30, 2013

Mid-November Wind

According to a News-Miner article on Wednesday, an anemometer atop the GVEA administration building in Fairbanks recorded a peak wind gust of 83 mph during the November 13-14 storm.  While the measurement is not comparable to the official history of wind measurements from the airport, the report is impressive and led me to wonder how the airport observations in the recent storm compared to past events.   The chart below shows the annual maximum wind speed in Fairbanks according to the GHCN daily data; note that various time averaging periods were reported at different times in the history.


The highest 5-second or greater wind speed in the GHCN data is 59 mph on April 18, 2003, but this report appears suspect to me because the 2-minute maximum for the same day was only 12 mph, and there does not appear to have been anything unusual about the weather situation that day; I excluded the report for the chart above.  Ignoring the 2003 event, the official measurement of 55 mph on November 14 is the highest on record for a 5-second period or greater; higher "peak gust" values were reported in July 1990 and June 1997.  The recent 2-minute report of 41 mph also narrowly exceeds the peak 1-minute values in 1970 and 1974.

It's also interesting to examine the annual values of the peak wind speeds in winter - see the chart below.  Note that I have excluded March here, because average wind speeds pick up considerably in March (see second chart below) and I thought it would be most valuable to look only at the deep winter months with similar wind behavior.  Interestingly, in 3 of the last 4 winters (including this one to date), the peak 2-minute wind speed has been at the upper end of the historical distribution - and so it appears we can say that Fairbanks has had a run of unusually strong wind events in recent winters.  The behavior of peak wind speeds in April through September (the "less calm" season) does not show any similar trend (third chart below).


Thursday, November 28, 2013

Thanksgiving Records

Here are the daily temperature and precipitation records for Alaska on Thanksgiving day.

Wednesday, November 27, 2013

Thanksgiving Climatology

Since tomorrow is Thanksgiving, it is a good time to see how Thanksgivings of years past have fared for Alaska's three largest cities. The following charts show the high and low temperatures for Thanksgiving day (gold bars) as well as any daily snowfall (cyan). The normal maximum and minimum lines are based on the 30-year climate normal period that corresponds to the date in question. The lines appear staggered because Thanksgiving occurs on a different calendar day each year. The normal values represent the value on the day that Thanksgiving fell on that year. (Note: snowfall measurements, particularly for Anchorage, are frequently missing in the early years shown on the charts)


Tuesday, November 26, 2013

Persistent Warmth

Six months have now passed since the dramatic late spring reversal in Fairbanks temperature anomalies, from persistently below-normal to mostly above-normal (see chart below).  Since late May, unusual warmth has been quite persistent, with only brief interruptions to the prevailing trend.  Remarkably, over 40 percent of the days since May 24 have been at least 1 standard deviation warmer than normal, while only 14 of 185 days have been an equivalent amount below normal.  The distribution of anomalies is shown in the second chart below.


The immediate cause of the persistent warmth is the upper-level ridge that has repeatedly redeveloped over southern Alaska and northwestern Canada, as shown below in the six-month mean 500 mb height anomaly.


[Update: per reader Eric's request, below are the corresponding 500 mb height maps for the prior 10 years: 2003 through 2012, in order.]


Monday, November 25, 2013

Winter Rain Climatology

In view of recent freezing rain in Fairbanks, and also in many other Alaska locations, it's interesting to look at the history of winter rain events in Fairbanks.  Of course, the phenomenon is very unusual because of the difficulty of getting warm enough air into the Alaskan interior in winter, but when it does occur it's very problematic.  As Rick wrote elsewhere, "Freezing Rain in Fairbanks is a serious pain. Because the ground and road surfaces are well below freezing from October through March, any rain, even if it falls when air temperatures are above freezing, can cause severe travel problems. Significant amounts of rain will usually produce significant ice accretion on roads that persists, at least on some lower traffic roads, until late March or early April."

The chart below shows the annual number of significant winter rain or mixed rain/snow events (November through March) since the winter of 1917-18. The cluster of events in recent years is evident (Nov 2010, Jan 2013, Nov 2013) and has resulted in an up-tick in the 15-year trailing average frequency. However, there have also been periods in the past when winter rain occurred with higher than normal frequency, notably in the 1960's, in the 1920's, and in the remarkable winters of 1935-36 and 1936-37, when rain occurred five times. If anything, it appears that winter rain has become somewhat less common over the past century, although I am not sure if the trend is statistically significant.


Winter rain in Fairbanks is most common in November and least common in December and March, as the chart below shows. It is curious that significant winter rain has never been observed between November 25 and December 23 inclusive; it's not clear if this might possibly be a statistical quirk, but the sudden cessation of rain events in late November does look as if it represents a true feature of the Fairbanks climate. From Christmas on, the distribution of rain events seems fairly random.


Sunday, November 24, 2013

Freezing Rain in Anchorage

Unfortunately, Anchorage was greeted with a freezing rain event just like Fairbanks was a week earlier. According to the Anchorage NWS office, there was at least 0.16" of freezing rain. In one hour, 0.08" of freezing rain occurred. That was the most since 0.11" fell in one hour on 11/3/2004. The driving was extremely difficult to say the least (see photo of overturned pickup truck).

For the winter of 2012-2013, it was the 4th calendar day where the Anchorage International Airport reported freezing rain. The seasonal average is 6 days. The chart immediately below shows the count by season for the last 18 winters.


In looking at the events over the previous 18 winters (that's how far back the easily obtainable hourly observation go back via the NCDC website), the coldest that freezing rain (actually freezing drizzle) was observed was 15°F on 3/5/2012 (at 3 p.m.). Conveniently, this is the exact time of an upper air sounding. The chart below shows the sounding at the time of that observation as well as last Friday's event sounding. Interestingly, the 2012 sounding it is very similar to the Fairbanks sounding from their freezing rain event last week. The chart below shows the sounding from Friday's freezing rain event in Anchorage and the one on 3/5/12. The 2012 profile looks eerily similar to the Fairbanks sounding from 11/13/13. Fortunately the 2012 event in Anchorage produced very little in the way of accumulations and the associated travel difficulties.


Thursday, November 21, 2013

The Climate Below (Ground)

The ground beneath our feet is an important part of the biosphere. What happens in the soil directly affects the weather and climate in the atmosphere above us. From water storage to heat storage, the soil is an often overlooked component of the earth's biosphere.

There are several soil monitoring stations around Fairbanks but the Bonanza Creek Experimental Forest site ( 64.699030N 148.258742W) is the one I check on the most frequently. The FP1A station is approximately 15 miles southeast of Fairbanks along the Tanana River. The site description is as follows: "FP1A is located on a low early successional terrace (1.8 - 2 m above winter low river level) adjacent to the Tanana River. Vegetation establishment occurred in 1982 to 1983. Significant bank erosion has occurred since the establishment of the study area, resulting in loss of some study plots."

The chart below shows the daily normal temperature (°C) for sensors at 0 cm, 5 cm, 10 cm, 20 cm, 50 cm, 100 cm, and 200 cm between 1989 and 2012 (Note: these are depths below the organic layer at the surface). The small black squares are the November 21st 2013, readings. The color of the square corresponds to the color of the line (the 0 cm and 5 cm boxes are nearly on top of one another). As you can see, the soil temperatures are far above normal for this time of year. In fact, if you look at the table below the chart, the 11/21/13 readings were the highest on record (for the date) for 5 cm and 50 cm sensors during the 25 years of observations.

I am interested is seeing if there is a correlation between ice measurements along the Tanana and the subsurface temperatures.


Dark in Barrow, -50 F in Southeast Interior

Continued cooling over interior Alaska has produced the season's first reports of -50 °F today in the southeast; here are some of the colder observations:

-51 F  Bolio Lake RAWS
-50 F  Chicken COOP
-50 F  CW4591 automated station near Tok
-49 F  Marguerite Creek near Healy 13NE
-48 F  Tok #2 COOP
-47 F  Northway airport
-46 F  Tok COOP
-41 F  Eielson AFB

According to the GHCN data, it is somewhat unusual for -50 F to be reported this early in the winter in Alaska; it happens once or twice a decade on average.  The earliest observation of -50 F was on November 4, 1945, at Allakaket (-53 F).

In the far north of Alaska, the polar night has now reached Barrow, where the sun set three days ago for the last time this year.  The FAA webcam image below shows the southern horizon today at close to solar noon.


Wednesday, November 20, 2013

Low-Level Refrigeration

The break-up of low-level cloudiness over Fairbanks yesterday allowed lower-atmosphere temperatures to drop smartly from mid-morning on, with the result that the surface-based inversion was pronounced by early this morning (see below).

This morning's low temperature of -31 °F, which may yet be broken before midnight tonight, is slightly unusual for this early in the season; the -30° mark is reached by this date in only about one quarter of years - and less often since the 1970s.  More unusual is today's high temperature of only -22 °F; cold of this degree has occurred this early in the season in only six years since 1930.  Interestingly, some years (six of them since 1930) never produce a day this cold throughout the entire winter.

Across the border in Dawson, upriver from Eagle, today's high temperature of -41 °F was within one degree of the coldest on record for so early in the season, with historical records back to 1900 or so.


Minus 10°F Climatology

With the onset of classically cold Alaska temperatures, I though it would be a good time to put up a map of the number of seasonal occurrences of days with temperatures of -10°F or lower. This map only uses winters since 1950-1951. Stations with 10+ winters of good data during that time period were included. A table with selected values is included a the end. Note: a winter with more than 15 missing observations was excluded.


Tuesday, November 19, 2013

Deepening Cold

This morning's dawn view from Arctic Village features mostly clear skies, some light ice fog, and -42 °F; see below, courtesy of the FAA webcam.  This is the first -40 observation I've seen in Alaska this winter, though there might have been others I missed.  Across the border in the Yukon Territory, the town of Faro reached -44 °F, and Watson Lake reached -41 °F.  Historical data for Watson Lake go back to 1939 and reveal that this morning's chill is close to the coldest on record for so early in the season, although the cold snap of early November 1989 was colder (-46 °F on Nov 12).


Monday, November 18, 2013

Cloud Warming

Valley-level temperatures in and around Fairbanks are being held above the precipice of radiative cooling (so to speak) by low clouds, as seen in the infrared satellite image below: relatively dark shading in parts of the southern and western interior indicates relatively warm temperatures at the top of low clouds.  In northern areas, a mix of high and low clouds is also keeping temperatures from dropping as low as they otherwise would; the cold temperatures (white shading) in the satellite image show areas of cold high cloud in the northeast, not surface-level temperatures.  However, skies are generally clear in the southern Yukon Territory, and there temperatures have dropped to the -20s F and colder.


The low-level clouds have destroyed yesterday morning's surface-based inversion in Fairbanks, as shown in the two soundings below, and so Fairbanks airport has warmed by 15 °F despite continued cooling aloft.  When the clouds break up in the next day or two, the inversion will return and valley-level temperatures will drop to their lowest levels of the season.


Friday, November 15, 2013

Running Snow Total

If the snow forecast for Fairbanks verifies over the next 48 hours, the 30-day running total will exceed the 30-day normal total. That is actually a somewhat unusual occurrence in the last several years. Since the winter of 2007-2008, the 30-day running snow total has been below normal for 70.6% of the time in the months of November through March. By comparison, the 30-day running snow total for Anchorage has been above normal 58.4% of the time in the months of November through March. Note 1: the 30-day snow deficit of -10.9" on 11/9 was the largest during the time period in question. Since this is the snowiest time of year, it is not surprising that the largest deficit was recorded during this time frame. Note 2: the daily snow normals are from the 1981-2010 climate normal period.


Real Cold Coming

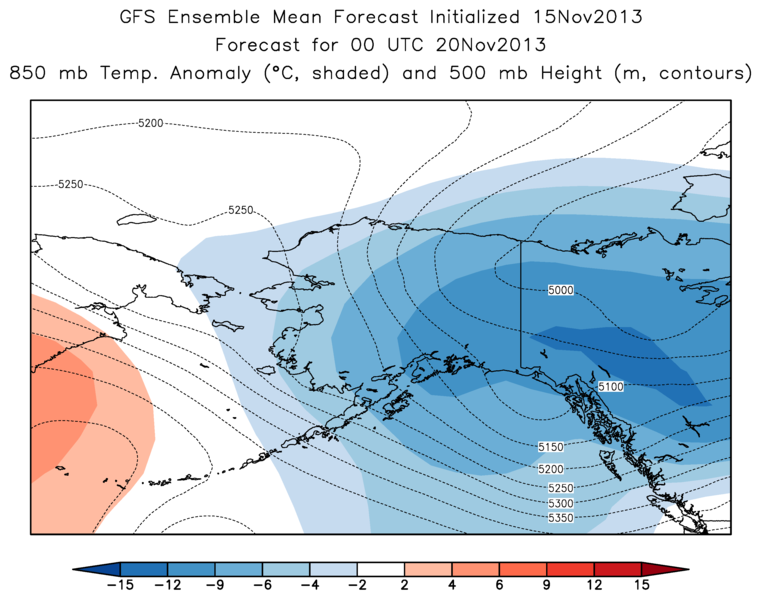
A major change in the weather pattern over Alaska is underway, as flow from the north is about to bring serious cold over most of the state.  The charts below show two of the leading computer model forecasts for Tuesday afternoon; the color shading indicates temperature departure from normal at 850 mb, and the dotted lines show the 500 mb height.  Both models show a cold upper-level trough extending from northwest Canada into interior Alaska, and below-normal temperatures.  The agreement is fairly good, although the ECMWF solution is more extreme, showing 850 temperatures more than 15 °C (27 °F) below normal.  At this time of year, that's cold.