Monday, April 7, 2014

Changing Pressure Gradients

A post by Brian the other day led to some discussion about long-term trends in wind speed over Alaska and the lower 48 states - specifically, whether the observed weakening in wind speed is "real" or is at least partially an artifact of changing measurement procedures.  To look a little closer at the changes in Fairbanks, I calculated the mean annual gradient in sea-level pressure from the NCEP/NCAR global reanalysis, which extends back to 1948 at six-hourly time intervals with a horizontal resolution of 2.5 degrees latitude/longitude.  Admittedly the data is spatially coarse, but it does provide a consistent gridded history, and for sea-level pressure the quality of the synoptic-scale variations should be very good.

The chart below shows the results obtained for a reanalysis grid point close to Fairbanks: the black line depicts the annual mean pressure gradient, and the colored lines show the mean gradient in three-month seasons.  It is interesting to note that the mean annual gradient was slightly lower than earlier norms for about ten years beginning in 2000, but it was slightly higher again in 2012 and 2013.  The largest decline from earlier years occurred in winter and fall, whereas spring and summer showed no significant change.


The drop in mean pressure gradient since 2000 is consistent with lower mean wind speeds at Fairbanks, suggesting that the wind speed really has slackened in recent years.  However, note that the annual pressure gradient did not begin to drop off until 2000, whereas the reported wind speed dropped off quite precipitously in 1998, so I think it's likely that there is also an equipment or measurement change involved in the wind speed history.  Of course, we should remember that the surface wind speed is also affected strongly by the inversion and stability characteristics of the air near the ground, so the pressure gradient is not the only determining factor.

The spatial scale of the pressure gradient change is illustrated in the map below, which shows the difference in mean gradient since 2000.  Most of Alaska stands out prominently as having a reduced pressure gradient, while the Arctic Ocean has experienced higher gradients in recent years.  The changes in the lower 48 are rather small, except in New England where weaker gradients are consistent with Brian's map showing weaker wind speeds.


Sunday, April 6, 2014

Length of Snow Cover

The seasonal snow melt is beginning in Alaska. While the line is currently just entering the Southern Mainland, it will make an inevitable trek northward. Here are some maps that graphically depict the progression of melt out and the length of time that snow stays on the ground. Figure 1 shows the range of dates, on average, when there is a 50%/50% chance of having a snow depth of 1" or greater. For all maps, the data are based of the values in the GHCN database. Since cooperative data is pretty hit or miss, those stations were not included. Please keep in mind that these maps use a smaller number of points than most of my other maps so the interpolation algorithm is not going to do as good of a job. Therefore, if a point is in one range but you know it should be in another, it is the interpolation algorithm that weights each point according to the value of itself and the five closest neighbors. This is true for all maps in this particular blog post entry.

Figures 2 and 3 show the total number of days that a snow depth of 1" or more is recorded each season in Alaska and the Lower 48 respectively. Around half of Alaska is covered in snow for 6" months out of the year. By comparison, a relatively small part of the Lower 48 has snow on the ground for 90+ days.

Figure 1. Average last date where the snow depth is 1" or greater.

Figure 2. The number of days per year (winter) with a snow depth of 1" or more in Alaska. This is a total count of days and does not necessarily represent the continuous winter snow pack. A few of the stations have short periods of record so their data might be suspect; e.g., Ft. Yukon.

 
Figure 3. The number of days per year (winter) with a snow depth of 1" or more for the entire U.S. Only areas where the number of days is greater than 2 are shown. This is a total count of days and does not necessarily represent the continuous winter snow pack. Note: the color scale is different for Alaska in this figure as compared to Figure 2.

Thursday, April 3, 2014

Nenana Ice Classic - Early Breakup?

An entertaining ritual of spring in Alaska is the famous Nenana Ice Classic guessing game, wherein hopeful participants submit estimates of the precise time that the ice will go out on the Tanana River at Nenana.  Last year's breakup was the latest on record, although the breakup in 1964 was technically a day later if you account for the fact that 1964 was a leap year.

The ice at Nenana this year is a little thinner than usual, which has led some to speculate that the breakup will be early, although the historical correlation between early April ice thickness and the breakup date is very small.  A much more important factor is the temperature in April - and in early May if the breakup is late.  Of course, for those playing the Classic, the submission deadline of April 5 makes it impossible to know with confidence how temperatures will evolve in the last 2 or 3 weeks prior to breakup.  However, I find it interesting to note that the long-range temperature forecasts from the National Weather Service's CFSv2 model are modestly skillful and therefore allow for a slight edge over random chance in the guessing game.

The chart below shows the breakup date (day of the year, vertical axis) against the forecast temperature for April, according to the CFSv2 forecasts as of April 1 of each year since 1982.  The forecasts for prior years are obtained from the historical "reforecasts" provided by NOAA - these are the retrospective forecasts used to calibrate the operational forecasts of today.  I extracted the forecast average temperature over the Tanana River drainage basin upstream of Nenana, with the idea that upstream temperatures are probably important as well as temperatures at Nenana itself.  There is a modest negative correlation between the forecast temperature and breakup date (R=-0.65), which is not particularly impressive but is better than nothing.  (Note that the actual April temperature in Fairbanks predicts the breakup date with R=-0.85, and the forecast predicts the actual with R=+0.77.)


Simple linear regression allows for a crude estimate of the potential effect of the expected temperature on the breakup date.  This year's forecast temperature for April is 23.0 °F, or 1.9 °F above normal, which translates into a breakup date of April 30, or 2 days earlier than the 1982-2013 mean.  Of course, this is only a slightly better guess than simply taking the mean; the error distribution on the regression indicates that the probability is about 66% that the breakup will be earlier than May 2.

From a subjective standpoint, I would guess that the breakup will be earlier than the forecast indicates, because there is very little snow on the ice (see below).  This is unusual for the time of year, and with no reflective snow pack, the sun will be unusually effective in melting the ice.  My best guess for breakup is between April 23 and April 28.


Wednesday, April 2, 2014

Average Wind Speed

Compared to most places in Alaska, Fairbanks has a low annual wind speed. Distance from the ocean, persistent winter inversions, and a lack of topographic constrictions all conspire to prevent strong winds in most situations. There are a cluster of stations in the Interior that all have relatively low annual wind speeds; including Bettles, McGrath, Nenana, Tanana, and Eagle. Figure 1 shows the average annual wind speed of 44 stations in Alaska with at least 10 complete years of data. Note: this data was obtained from the 'AWND' field of the GHCN database.

Figure 1. Map of average annual wind speed at 44 stations in Alaska (1984-2013). Stations with at least 10 years of data were included in the map.

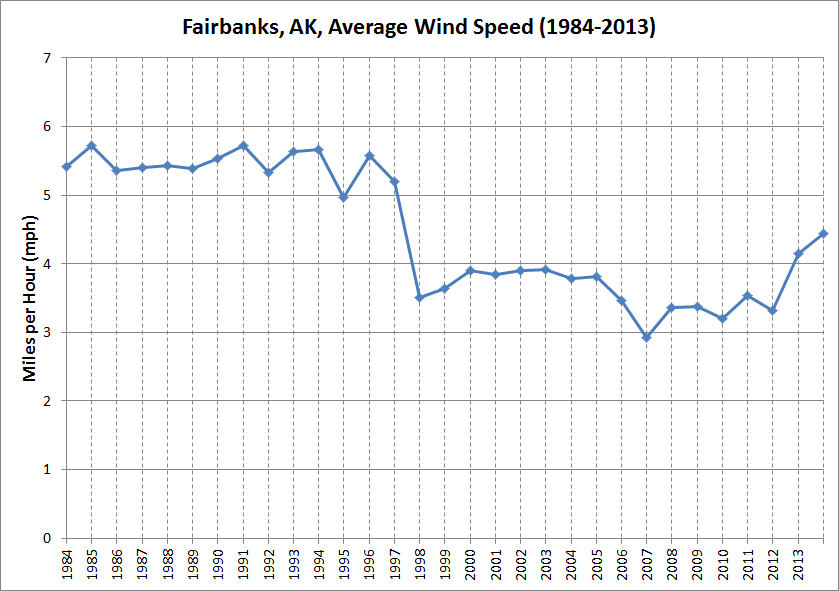
Interestingly, if you look at the wind speed over time, there is a noticeable downward trend – including an abrupt shift in 1998. Figure 2 shows the average annual wind speed for Fairbanks between 1984 and 2013. The speed was consistently above 5 mph before 1998 and mostly below 4 mph after 1998. To see if this is an anomaly or if other stations have the same issue, I made a chart of the 19 stations that have nearly complete data between 1984 and 2013. They all show a downward trend in wind speed and many have the same shift in speed in 1997 or 1998 but to a lesser degree. Figure 3 shows the result of that analysis. My guess is that a change in equipment protocol was implemented in the that time period. The method for estimating both visibility and sky conditions changed during that same time period so it is not unreasonable to assume wind speed measurement protocols changes as well. It is also possible that the downward trend in Alaska's wind speed is related to a similar reduction in wind speed noted across the Lower 48. Several researches have previously noticed this effect and a possible attribution to a diminished thermal gradient between the equator and the poles is a sound hypothesis. The thinking is since wind is generated by the pressure-gradient force and differences in pressure are a result of differences in density (which are a result of differences in temperature), a diminish thermal gradient will result in a lower pressure-gradient force – and therefore a lower wind speed.


Figure 2. Average annual wind speed in Fairbanks, Alaska (1984-2013).


 Figure 3. Average annual wind speed at 19 stations in Alaska (1984-2013).


Figure 4. Average annual wind speed at 229 stations in the U.S. (1984-2013). Only stations with 28, 29, or 30 years of data were included.


Figure 5 (added by Richard James).  Mean annual wind speed at 850 mb (1950-2013) for Anchorage, Fairbanks, and Barrow.

Figure 6. Change in wind speed of two 10-year periods for the entire U.S. measured in miles per hour. Note: this has not been cross-referenced for station location changes or equipment changes.

Figure 7. Change in wind speed of two 10-year periods for the entire U.S. measured in percentage. Note: this has not been cross-referenced for station location changes or equipment changes.

Saturday, March 29, 2014

First 40°F, 50°F, and 60°F Days in Fairbanks

Fairbanks has already experienced their first 40° day of the season. In fact, there have been quite a few 40°F days in the last week or so. There were 71 days between the last 40°F day in the Fall and the first 40°F day of the Spring. This is more than 40 days less than the 1981-2010 normal value. Looking ahead to the first 50°F day, it normally occurs on April 3rd. Through March 29th, there have been 152 days since the last 50°F day in the Fall. To reach the normal value would require another month of sub-50°F days. The 60°F seems more attainable. If Fairbanks makes it to the normal date, they will (slightly) exceed the normal length of time between 60°F days. Figure 1 shows the number of days between the three temperature thresholds. Figure 2 shows a chart of the annual number of day  between the three temperature thresholds in Fairbanks. For comparison, Figure 3 shows a chart of the annual number of day  between the three temperature thresholds in Anchorage. Interestingly, for both cities, the 50°F time is about the same over the long term. The length of time between 40°F days is longer at Fairbanks and the length of time between 60°F days is longer at Anchorage.


Figure 1. Number of days between 40°F, 50°F, and 60°F days in Fairbanks.

Figure 2. Annual chart of the length between 40°F, 50°F, and 60°F days in Fairbanks.

Figure 3. Annual chart of the length between 40°F, 50°F, and 60°F days in Anchorage.

Thursday, March 27, 2014

El Nino and Summer

An article a couple of weeks ago in the Alaska Dispatch discussed the potential for El Niño conditions to develop in the tropical Pacific this summer or fall, and speculated that another warm, dry summer might result if El Niño does in fact emerge.  So I thought it would be interesting to look at the strength of the connection between El Niño and summer temperature and precipitation in Alaska.  To do this, I looked at the June-July period as representative of high summer, and I picked out the top 10 years for El Niño conditions, based on a bivariate ENSO index that I feel is a good measure of the El Niño/La Niña (ENSO) phenomenon.  I then examined how many of these years produced above-normal, near-normal, or below-normal temperature and precipitation in June and July, based on three equal divisions (terciles) derived from the 1951-2010 historical data.

The maps below show the results, with the height of the columns corresponding to the number of years in each category.  Warmer than average conditions are definitely favored in most Alaska locations in El Niño summers, and dry conditions are more common than wet from Anchorage to Nome, Kotzebue, and Barrow; but elsewhere (including in Fairbanks) the precipitation patterns are mixed.


We know that the phase of the Pacific Decadal Oscillation (PDO) is also a very important influence on Alaska climate, so I then subdivided the top 20 El Niño years by whether the PDO was positive or not.  Compare the two maps below: the first shows the climate for nine years with both El Niño conditions and a significantly positive PDO phase, but the second map shows El Niño conditions combined with a near-neutral or negative PDO phase.  The difference is stark; unusual warmth is strongly favored in southern and central Alaska when the "warm" PDO phase lines up with El Niño, but a cool summer is actually more likely in the southwest in El Niño years with a neutral or negative PDO.


The corresponding precipitation maps are shown below; the dry signal is strong from the west coast to Fairbanks and Anchorage in the El Niño - positive PDO years, but a less positive PDO phase creates a more variable pattern.


These results suggest that the PDO phase is more important than ENSO for summer temperatures over Alaska, because the El Niño signal is largely removed when the PDO is neutral or negative.  The maps below, derived from the top 10 positive PDO summers, confirm that the PDO temperature signal is stronger than the El Niño temperature signal, when taken in isolation.  Thus a strongly positive PDO phase is more reliably connected to summer warmth than El Niño, and the Fairbanks summer is also more likely to be dry in positive PDO years.


What does all this mean for summer 2014?  Well, the El Niño part is just speculation, because El Niño hasn't even developed yet, let alone a strong El Niño.  However, the PDO has been significantly positive for several weeks now, as the long-lived pool of warm water in the North Pacific has moved closer to the west coast of North America.  If this pattern persists, which seems quite likely, then the positive PDO signal will come into play and another warm summer will indeed be on the cards.

Wednesday, March 26, 2014

Large Diurnal Range

[Updated March 27, see bottom]

In weather that is quite characteristic of the time of year, valley locations around Fairbanks have seen large diurnal fluctuations in temperature in recent weeks.  Strong solar heating by day and warm temperatures aloft have produced warm afternoons, but clear skies and a 20+" snowpack have allowed for sharp cooling at night.  At the airport, the average difference between the daily high and low temperatures so far in March is 33 °F, which is towards the high end of the historical range for the time of year, but is not a record (March 2011 saw an average diurnal range of 36 °F).

The charts below show that daily maximum temperatures have been mostly above normal in the past month (+5.9 °F anomaly in the past 30 days), but daily minimum temperatures have remained mostly near normal (0.0 °F 30-day anomaly).


[Update:] Reader Eric suggested making a plot of the daily temperature range; this indeed nicely illustrates the rapid increase in diurnal range during February.


Saturday, March 22, 2014

Winter Temperatures 2013-2014

This week I ran the temperature numbers for climatological winter (December, January, and February) for Alaska. As most Alaska residents can attest to, this winter was warmer than normal. An extremely warm January was somewhat offset by a cooler December and February. The first map shows the statewide winter temperature values by climate division and the second map shows the winter temperatures in the Fairbanks area.

The climate divisions are a relatively new statewide organizational grouping of similar regions by Bieniek et al. (2012). Of the 13 climate divisions, 12 were above normal for the winter. Only Juneau's region was below normal. For the Fairbanks area, nearly every station was 3°F to 4°F above average for the winter.

Figure 1. Winter 2013-2014 temperature and temperature departure by climate division. All stations that reported temperatures for at least 15 days were utilized. Similarly, the 1981-2010 normals were calculated using stations that reported data at least 15 days for the month.

Figure 2. Winter 2013-2014 temperature and temperature departure for the Fairbanks area. The departure values are not based on NCDC published values. They are a departure from average for those stations with at least 5+ years of data (note: no RAWS stations are included).


Friday, March 21, 2014

January Yukon Record Confirmed

Regular readers may recall a post from January about a potentially significant record high temperature of 16.5 °C (62 °F) at Burwash in Canada's Yukon Territory.  Based on the data I have access to, I speculated that this was a new record for the month of January in Yukon.

I recently spoke to an Environment Canada meteorologist who confirmed that (a) there are no concerns about the quality of the observations on January 24 from Burwash, and (b) this is a new Yukon record for January.  It is not quite clear what the previous record was, as there are quality concerns about many of the warmest observations in recent years, but we do know that all reports warmer than Burwash have been eliminated.


Wednesday, March 19, 2014

Warm Alaska Winter

Meteorological winter is traditionally defined as December through February, and it was a very warm one in much of Alaska this year.  The maps below show the Dec-Feb temperature and precipitation anomalies relative to the 1981-2010 period, with larger circles indicating greater departures from normal.  Fairbanks and Anchorage were in the top 10 for warmth, but most of the excessive warmth occurred in January; both December and February were slightly colder than normal.  To the west, the warmth was more extreme: Barrow and Cold Bay recorded their warmest winter (Dec-Feb) on record; Kotzebue, Bethel, and McGrath saw their second warmest winter; and Nome's winter was the third warmest on record.


Most locations saw above-normal precipitation in December through February, and Barrow and Gulkana had their second wettest winter on record (based on liquid equivalent of snowfall).  Remarkably, Barrow saw yet another month of above-normal (i.e. above-median) precipitation, the 12th in a row.

The warmth in Barrow has been really extraordinary in recent months, with each month from October through February being at least 5 °F above normal.  The five-month average temperature was the highest on record for the time of year by some margin, as shown in the chart below.


A few reanalysis charts illustrate the larger-scale anomalies that contributed to the warmth in Barrow and elsewhere since October: first, the 850 mb temperature map shows temperature anomalies of more than +3 °C over northern Alaska and far eastern Russia:


The 500 mb height map shows the strong ridge that keeps recurring over southeastern Alaska, but also reveals that upper-level pressure has been higher than normal over the entire Bering Sea-Alaska-North Pacific basin:

Sea-level pressure anomalies have been similar:
Finally, the sea surface temperature map identifies one of the likely causes for the unusual pattern: the very widespread and unusual warmth in the northeast Pacific waters.

Sunday, March 16, 2014

Season of Freezing Temperatures

Every so often I do a quick climate analysis for a blogger in Houston, Texas, and one of the things that came up earlier in the winter was the frequency of freezing temperatures down there. In a few weeks, stations in Alaska will be approaching the date at which freezing temperatures are no longer expected. Therefore, I thought it would be interesting to look at 1) the number of days per season with sub-freezing temperatures and 2) the length of time between the average first freeze and the average last freeze. Specifically, I was interested in how Fairbanks compares to other places in Alaska and the Lower 48.

Number of Freezes

As the analysis unfolded, it became apparent that the Fairbanks International Airport station's values did not appear representative of the greater Fairbanks area. For example, the number of sub-freezing days per season at the airport's official station is 222.7. However, the Fairbanks Airport #2 station records 237.1 sub-freezing days. Therefore, I used an average of five stations to generate a single Fairbanks value of 226.6 sub-freezing days.

Figures 1 and 2 show the number of days with subfreezing temperatures for Alaska and for the entire U.S. respectively. Figure 3 shows the stations used in the Analysis. All stations with a value greater than Fairbanks' 226.6 (rounded to 227) are shown in blue dots. Note that the color scale is different on the two maps. I was a little surprised at the number of stations in Alaska that have more freezing days than Fairbanks – particularly places west of Fairbanks like Galena, Kaltag, and Tanana.

Figure 1. Map of Alaska showing the annual number of days with a temperature of 32°F or lower. Stations with a larger annual value than Fairbanks are highlighted in blue.

Figure 2. Map of the U.S. showing the annual number of days with a temperature of 32°F or lower. Stations with a larger annual value than Fairbanks are highlighted in blue.

Figure 3. Stations used in the analysis of sub-freezing temperatures. To qualify for the analysis, a station must have at least 10 complete years of data beginning in 1980-1981 (maximum of 33 years). Any year with more than 15 missing observations was excluded. There were 181 stations that met those qualifications in Alaska and 1025 in the rest of the U.S. The Lower 48 analysis did not include Cooperative or RAWS stations.

Length of Freezing Season

Another way of describing the frequency of freezing temperatures is to define a season where freezing temperatures are likely to occur. This is the opposite of a growing season. In this section I did a simple subtraction of the average date of the last freeze of the season minus the average date of the first freeze of the season. For Fairbanks, the average of the five stations that are collectively referred to a 'Fairbanks Valley' on the maps is 257 days (Sept 5 - May 20). Figures 4 and 5 show the number of days with in the freezing season for Alaska and for the entire U.S. respectively. All stations with a value larger than Fairbanks' are shown as blue dots (see Figure 3 for a map of all stations).

Interestingly, the number of stations in Alaska with a longer freezing season than Fairbanks is larger than the number of stations with a larger count of freezing temperatures. This implies that Fairbanks drops quickly into a freezing temperature regime in the Fall and bounces out of the freezing temperature regime quickly in the spring. This is also evident when comparing Figure 2 with Figure 5; that is, quite a few stations in the Lower 48 have a longer freezing season than Fairbanks (or most other Alaska stations for that matter). In the case of the Lower 48 stations, they are frequently at high elevations (less atmosphere to radiate longwave energy downward) and also have 8-10 hours of darkness in the summer (unlike Fairbanks) when heat can be radiated upward.

Figure 4. Map of Alaska showing the average number of days between the first freeze of the season and the last freeze of the season. Stations with a larger annual value than Fairbanks are highlighted in blue.

Figure 5. Map of the U.S. showing the annual number of days  between the first freeze of the season and the last freeze of the season. Stations with a larger annual value than Fairbanks are highlighted in blue.

Data Set

There are many interesting values that popped out. Far too many to mention. Therefore, for anyone who is interested, here is a LINK to the entire data set as an MS Excel file. The file is 2.8 megabytes.


Friday, March 14, 2014

Cold West, Warm East

A strong east-west temperature gradient is evident across Alaska today, with a temperature difference of more than 40 °F between the central Interior and the Yukon-Kuskokwim Delta region.  In an interesting setup, cold air has invaded southwestern Alaska from the Bering Sea while eastern Alaska is basking in warmth under the influence of the seemingly semi-permanent ridge over western Canada.  Here are surface observations from the last hour (temperatures in red):


Upper-air maps from a model forecast for 4pm AKDT today are shown below, revealing the cold cyclone aloft over the southwest and the strong gradient of temperatures at 850 mb:
The following map shows pressure and vorticity (a measure of spin) in the middle levels of the atmosphere:


The warmth in the Interior today signals the seasonal trend towards relatively warmer conditions inland, compared to the west coast, as spring draws closer.  In fact, it just so happens that today is the day that Fairbanks becomes warmer than Nome in the climatological normals.  The chart below shows the annual cycle of daily normal temperatures at these two locations which have almost identical annual mean temperature.


Thursday, March 13, 2014

Temperature Skewness Maps

In response to reader Eric's comment, Brian helpfully offered to produce some maps of seasonal temperature skewness across Alaska.  Brian used his expert GIS mapping skills, and I supplied him with the data.  Except for some of the Arctic coast stations (where I used hourly temperature data), all of the results are from the 1981-2010 GHCN daily data.

Maps are shown below for the four climatological "seasons" of December-February, March-May, June-August, and September-November.  These don't correspond particularly well to meteorological times of transition in Alaska, but they are conventional categories for dividing up the data.  Recall that positive skewness indicates a long upper tail, so that large warm anomalies are more common than large cold anomalies; and conversely, when there is negative skewness, large cold anomalies are more common.  Qualitatively, the warmer/red colors on the maps show regions and seasons that are more often "very warm" (relative to the mean), whereas colder/blue colors on the maps indicate locations that are more often "very cold" (relative to the mean).


Interesting features of the maps include the general lack of significant skewness in the central Interior, except in spring, the pronounced skewness in many places in spring, and the strong positive skewness in far southern Alaska in summer.  Each of these features describes characteristics of the climate that go beyond the traditional "seasonal norms" and even "seasonal variability/variance", but are nevertheless important and perceptible aspects of the local environment.

[Update March 16:]  The chart below shows the summer temperature distribution for Kodiak, where the skewness is strongly positive.  In the period 1981-2010, the daily mean temperature in June through August was never more than 10 °F below the mean, but daily anomalies of +15 °F or more occurred on a number of occasions.  It seems that the favored setup for the warm anomalies involves high pressure to the west, thus bringing warm air from the mainland to the north - and sometimes the air is very warm.  In winter the large-anomaly air from the mainland would be cold, and so the distribution is negatively skewed.