Thursday, November 13, 2014

Exceptional Warmth

The intense high-pressure ridge over northwestern North America has brought extremely unusual warmth to interior and northern Alaska in recent days.  In Kotzebue, which has been much warmer than normal for most of 2014, the temperature hasn't been below freezing since Sunday - this will probably be the fourth consecutive day with a minimum temperature at or above 32 °F.

In the context of the historical data, this is remarkable.  It's unusual to see any day in November (or December) with a minimum temperature of 32° or above; there have only been 15 cases since 1930 prior to this year, and all but four of these were before November 10.  The only remotely comparable event was in 2003, when the first 5 days of the month remained at or above 32 °F.

Extreme warmth has also been seen at McGrath, where the temperature reached 50 °F yesterday; this breaks the all-time record for November.  Previously the latest date in the year that 50 °F was observed was October 22, 1980 - more than 3 weeks earlier in the year.  Judging from the FAA webcam image this afternoon, there is little or no snow cover left at McGrath.


The upper-level high pressure system is the dominant feature in this morning's 500 mb analysis, see below.  The 500 mb height and temperature at Fairbanks were measured at 5670 m and -16.5 °C, both of which are above the normal values for the peak of summer.  Remarkably, the 1000-500 mb thickness was 5502 m, which is the same as the normal value in late June or mid-August; so it is no exaggeration to say that the average column temperature in the lower half of the atmosphere is as warm as in summer.


The evolution of the temperature profile in the past several days over Fairbanks is shown below.  Today's 850 mb temperature of +9.0 °C is the highest on record for November, and the temperature of +10.0 °C at 3900' AGL is the highest temperature measured at any level in a Fairbanks sounding between November 2 and January 14 inclusive.


Update November 14: Yesterday afternoon's Fairbanks sounding recorded even more impressive warmth, with the 850 mb temperature reaching 9.8 °C and a new all-time high freezing level for the winter season (November-March).  The 500 mb height reached 5690 m and the 1000-500 mb thickness was 5530 m.


Wednesday, November 12, 2014

Fairbanks Snow Through Nov. 13

Fairbanks is entering their snowiest time of the year yet they have only received 6.0" through today. Normally they receive 18.4" by November 13th. What does this mean for the rest of the season? In the 95 years of reliable snow record keeping, only ten years had less than 6.0" through November 13th. Of those ten years, eight ended up with below average snowfall. Most of those seasons were far below normal. Figure 1 shows the correlation between the November 13th snow total and the end of season snow total and Figure 2 lists the ten season with under 6.0" through November 13th. The R-squared value for the points on Figure 1 is 0.32. Perhaps this year will mirror 1928-1929 and end up with a large snow total – but the odds are against it. The ten years shown in Figure 1 ended up with 50.5" of snow on average. The normal season total is about 65".

Unfortunately the next week or more is looking quite dry for Fairbanks. If we push our analysis out to November 20th (see Figure 3), the snow picture looks even bleaker. Only eight seasons have recorded under 6" of snow through November 20. The R-squared value for the points on Figure 3 is 0.41.

A snowy season is not out of the question, but the chances get slimmer by the day.


Figure 1. Scatter plot showing the season-to-date snow total through November 13th versus the end of season snow total (1920-1921 through present).


Figure 2. List of the ten seasons with under 6.0" of snow through November 13th and  (1920-1921 through present) and the final season snow total.


Figure 3. Scatter plot showing the season-to-date snow total through November 20th versus the end of season snow total (1920-1921 through present).

Sunday, November 9, 2014

Fairbanks November Above Freezing Days

The forecast for the next 5 days (at least) in Fairbanks is decidedly warm. Afternoon high temperatures could reach, or exceed freezing several times this week. Figure 1 shows the 5-day NWS temperature forecast (dark green line) along with the GFS and NAM modeled temperatures.

Figure 1. 5-day forecast from the NWS (dark green line) and several computer model temperature forecasts. Figure generated at 9:30 p.m. on November 9, 2014, from the Iowa State Meteogram generator.

How uncommon are high temperatures in the month of November that reach or exceed the freezing mark? On average, there are 2.7 such days per November in Fairbanks. The greatest number was 13 in 2002 and many years have had no days with a high temperature of 32°F or greater. Figure 2 shows the annual count of November days with a high temperature of 32°F or warmer. While the average number of above freezing days has slightly decreased since 1970 (3.0 days vs. 2.3 days), the number of days with a count of 0 has increased dramatically.


Figure 2. Days in November where the daily maximum temperature was at least 32°F.

Fairbanks is typically much colder than any place in the Lower 48 during the month of November. However, some stations do occasionally record high temperatures lower than Fairbanks on a given day in November. This coming week, some stations in the central part of the Lower 48 will experience high temperatures colder than Fairbanks on Wednesday through Saturday. Here are some places that might be colder than Fairbanks this week and the number of times between 1981 and 2010 (up to 900 total days) that their high temperature was lower than Fairbanks during the month of November:

Amarillo, TX: 2 occurrences
Chicago, IL: 13 occurrences
Cleveland, OH: 5 occurrences
Indianapolis, IN: 4 occurrences
Denver, CO: 30 Occurrences
St. Louis, MO: 4 occurrences

Figure 3. Map showing the climatological normal (1981-2010) number of days per November with a high temperature colder than Fairbanks.

Saturday, November 8, 2014

Strong Warming Ahead

As the super-cyclone associated with the remnants of Nuri reaches its peak intensity in the western Bering Sea, a chain of events is being set in motion that will lead to extreme warming over northern Alaska in the coming days.  An intense ridge of high pressure aloft will build over southeast Alaska and then expand over eastern Alaska and the Yukon Territory, and vast quantities of warm air will be imported by the deep southerly flow over Alaska.

The table of maps below shows the predicted evolution of the 500 mb height (dashed lines) and the 850 mb temperature anomaly (departure from normal, shaded) from yesterday afternoon's GFS and ECMWF model runs.  The maps are valid at 24-hour intervals from Tuesday afternoon in the top pair to Friday afternoon in the bottom pair.  It's clear that the model agreement is excellent and therefore confidence is high.  Remarkably, the models show 850 mb temperatures reaching more than 20 °C above normal over the eastern North Slope - I've created these maps before, but this time I had to adjust the color scale to accommodate the magnitude of the anomaly.


The good agreement between the models provides a nice opportunity to test my recent hypothesis that the National Weather Service temperature forecasts for Fairbanks are sometimes too conservative at the end of the short-range forecast period when the models agree in predicting a major anomaly.  The 850 mb temperature anomalies predicted for the closest gridpoint to Fairbanks are shown below, and the current NWS forecast for the high temperature each day is also shown.

Date (AKST)GFSECMWFMeanNWS High Temperature
3pm Nov 11+11.3C+13.5C+12.4C31F
3pm Nov 12+17.2C+15.3C+16.2C34F
3pm Nov 13+15.8C+17.7C+16.7C34F
3pm Nov 14+13.6C+14.3C+13.9C26F

We see that the NWS forecast is already calling for well above-normal temperatures, and in fact the forecast doesn't look conservative at all; the normal high temperature in Fairbanks on November 13 is 11 °F.  However, the record high temperatures for this time of year are in the 40s, and the upcoming event looks like it intends to set some records.  Could the thin (2-inch) snow pack be in danger in Fairbanks?  We'll find out soon.

Friday, November 7, 2014

Cloud Cover Continued

In view of our recent discussion surrounding cloud cover observations in Fairbanks, I decided to look more closely at the historical data and long-term trends.  The goal is to understand the reported changes in sky condition categories, as shown in the chart below (click for a larger version); and I'm focusing on the winter season for now.  As noted earlier, there have been large variations in the frequency of clear sky conditions, and the past 50 years have seen an apparent decline in the frequency of overcast skies in winter.


In my previous post I mentioned that fog used to be more common in winter in Fairbanks, and this confounds the analysis because sky condition can't be observed reliably during foggy conditions.  However, it turns out that the observers in Fairbanks very often used to report overcast skies during fog.  The chart below shows the December-February frequency of fog conditions (blue columns) and the 11-year centered mean frequency of an overcast sky condition when fog was observed (gray line).  We see not only the long-term decline in winter fog frequency, but also a very pronounced trend away from reporting overcast skies during fog.  In recent years, the most common sky condition during winter fog is "obscured", which makes sense as it is difficult to observe the true cloud coverage in the presence of fog at ground level.


The implication of these results is that winter sky condition data from earlier decades in Fairbanks had a bias towards more frequent overcast than today, because the observers used to report overcast during fog, and fog used to be relatively common.  This indicates that the long-term decline in overcast conditions may be smaller than the raw data suggest.  I'll attempt to remove the effect of the bias, and get closer to the "true" cloud cover changes, in a future post.

Tuesday, November 4, 2014

Aleutian Low Forecast

Recent computer model forecasts of a very strong storm in the Bering Sea at the end of this week have been well-publicized in the past few days.  The strong extratropical cyclone is expected to develop from the remnants of Super Typhoon Nuri, which recently had sustained winds of 155 knots (180 mph) over the western Pacific.

The computer model forecasts have shown an extraordinarily intense storm passing over the western Bering Sea and/or the western Aleutian islands on Friday.  This morning's deterministic GFS forecast for late Friday night is shown below, indicating a central minimum pressure of less than 930 mb, and the ECMWF forecast has shown a sub-920 mb central pressure.


The chart below shows the annual (cold season, July-June) minimum of the gridded sea-level pressure analysis in the 2.5x2.5 degree global reanalysis dataset, for a region centered on the Bering Sea (50-66N, 160E - 160W).  The coarse reanalysis grid misses the lowest central pressure in many storms, of course, but it seems likely that if the ex-Nuri storm pans out as expected, it will be one of the strongest storms observed in the past 65 years.


The monthly distribution of minimum sea-level pressure for the same Bering Sea region is shown in the second chart, below.  The strongest storm of the winter is usually observed sometime between November and February.


Saturday, November 1, 2014

Historical Cloud Cover

In recent weeks I put up a few posts looking at changes in mean seasonal temperature since 1950 in Fairbanks, with a particular focus on winter warming; the most recent post was here.  One of the obvious next steps in the investigation is to look at changes in winter cloud cover over time, because there is a strong relationship between cloud cover and temperature (see e.g. here).

I plan to look at this more fully at another time (I'm currently traveling and unable to write a detailed analysis), but for now I'll put up a couple of charts and invite comment.  First, the fraction of the hourly sky condition observations that reported "clear" in deep winter (Dec-Feb) since 1950, see below.


One issue to be aware of here is that the automated (ASOS) observations were introduced in 1997, and it's inevitable that this change produced a bias relative to earlier years, because the ASOS ceilometer doesn't detect clouds above a certain height (12000 feet in the original ASOS ceilometer).  For example, here's a comparison of ASOS and conventional observations for several stations in the lower 48 over a limited period of time (taken from a report here).

These results indicate, as we would expect, that the ASOS instrument over-reports clear skies compared to earlier manual observations, so if anything we would expect to see a higher frequency of clear skies since 1997 in the chart above.  It seems that the change in observing procedure does not explain the apparent decrease in frequency of clear skies in recent winters in Fairbanks.

Another potentially confounding factor is that fog in winter in Fairbanks obscures the sky and precludes cloud cover observations, and we know that fog used to be more common in Fairbanks (see e.g. here).  However, we would expect that fog forms preferentially under clear skies in winter, so presumably the missing observations from foggy times in earlier years would be more of the "clear sky" variety.  Again, the trend towards less fog (more complete cloud cover data) doesn't seem to explain the decrease in frequency of clear skies.

Another way to look at the data is to calculate the mean cloud cover fraction from the reported coverage category (i.e. clear, scattered, broken, or overcast); see below.  I hope to post more discussion and analysis at a later date.


*******************
Charts added by Brian on 11/2 & 11/3


Tuesday, October 28, 2014

Thin Snowpack Survives

The snow cover that arrived in Fairbanks on October 4 failed to melt out sufficiently to bring the official snow depth below 1 inch, and so we can now say the likelihood is very high that the permanent winter snowpack was established on October 4.  This is tied with 1933 for 3rd earliest in the Weather Bureau/NWS era; the only years with earlier onset of permanent snow cover were 1992 (September 13) and 1956 (October 2).

It is an interesting curiosity that the snow depth was reported at 1 inch for 11 consecutive days ending October 23, and this is tied for fifth longest such period (consecutive days at 1" snow depth).  However, it's nowhere close to the record: in 1953, the snow depth remained at 1" for a remarkable 48 days ending December 9.  The chart below shows the years with at least 11 consecutive days at 1" along with the number of days in the period with a high temperature above freezing.  Most often a lengthy spell of 1" snowpack is accompanied by few or no days above freezing, but this year 8 of the 11 days saw the temperature rise above freezing.  However, we should note that the Fairbanks snow depth measurements are now taken (I believe) at the #2 airport location, which is sheltered by vegetation and often runs several degrees cooler than the official temperature site; only 5 of 11 days rose above freezing at the #2 location.


On another note entirely, here's a webcam shot of shallow steam fog over the Tanana River at Nenana early on Sunday morning, with an air temperature of 4 °F at the airport nearby.  The tendrils of mist form when air that has been warmed and moistened in contact with the water surface mixes with colder air a few feet above the surface.  A lot of interesting microscale physics was occurring within that shallow layer of intense temperature gradient!


Monday, October 27, 2014

Sub Zero Temps

Fairbanks nearly recorded their first sub-zero temperature of the season this morning. If they had, the date would have been only 1 day behind schedule. Figure 1 shows the low temperatures this morning. The first 0°F of the season at the official climate site for Fairbanks has occurred as early as October 3rd and as late as November 22. Figure 2 shows the annual date of the first 0°F day since 1904. Finally, Figure 3 shows the earliest 0°F observation for each climate station in the greater Fairbanks area for stations with at least 15 years of observations that extend into the 2000s. Every station has experienced 0°F temperatures before the end of October. North Pole is the winner with a 0°F reading on September 26, 1983.

Figure 1. October 27, 2014 low temperatures from the University of Utah's Mesowest site.


Figure 2. Date of first 0°F temperature for Fairbanks.

Figure 2. Earliest date of 0°F temperature for all GHCN stations around Fairbanks with at least 15 years of data ending no earlier than 2000.


Sunday, October 26, 2014

Point Barrow Freeze-Up

This is just a brief post to note the arrival of widespread sea ice around and north of Point Barrow in the past few days.  The NWS-Anchorage sea ice analysis from Friday showed a large gain in ice cover that connected the shore ice to the Arctic pack for the first time:


It's interesting to observe that cooler temperatures developed quickly at Barrow in the wake of the sea ice formation; the low was 4 °F yesterday, and a significant low-level temperature inversion was observed for the first time since September 16 (see yesterday's 3am and 3pm soundings below).  Prior to sea ice formation, strong surface warming from the adjacent ocean waters tends to produce a steep low-level lapse rate (warm below, cold above) in the lowest levels of the atmosphere, but the heat source is reduced after most of the nearby ocean surface is frozen.  These changes are evident in the climatological vertical temperature profile as discussed in an earlier post here.


Saturday, October 25, 2014

Fairbanks Forecast Performance - Part 2

In an earlier post I began looking at the performance of NWS temperature forecasts for Fairbanks, with a particular focus on whether the forecasts show enough of a "signal" at the end of the short-term forecast period.  On average through the year, the forecast errors at Day 7 are about 20 percent smaller than they would be if the forecast just called for "normal" every day, so the forecasts are clearly useful even out to Day 7.  But do the forecasts show "enough" departure from normal or are they too heavily weighted towards climatology?  The first post showed that the scaling is about right; the NWS forecasts are close to optimal in this regard.

There is more analysis that we can do, however, if we bring in the computer model forecasts and compare them to the NWS forecasts.  For this purpose, I've extracted the GFS and ECMWF computer model forecasts of 850 mb temperature for every day since mid-August 2013 (when I started collecting the data).  The NWS forecasts tend to track with the 850 temperature forecasts, as we would expect, but the following chart shows a hint of something interesting (detailed explanation is below):


The chart shows the average of the Day 7 temperature anomalies (departure from normal) predicted by the two models on the x-axis, and the error of the Day 7 NWS forecast on the y-axis; and the chart only shows days when the model anomalies have the same sign and agree to within 4 °C.  So I've excluded many cases when the models disagreed, because I'm attempting to isolate what happens when the models agree reasonably well.

There is a lot of scatter, of course, and the overall correlation is very weak, but notice the frequency of points above the horizontal zero line when both models expect very cold conditions; the NWS forecast tends to be too warm (not cold enough) in these cases.  On the right-hand side of the chart, there are far fewer cases with comparable warm anomalies in the model forecasts, but in the top five events it seems the NWS was too cold (not warm enough).

My interpretation of the results is that the NWS forecast has a tendency to be too conservative when both of the leading computer models agree in predicting a very large temperature anomaly.  If both models are very cold, then the NWS forecast ought to be lower; and if both models are very warm, then the NWS forecast ought to be warmer.  The conclusion is tentative because of the scatter in the data, but it does make sense: when the two independent models both show a large signal, then this considerably raises the chance that something very unusual will occur; and it seems the NWS forecast anomaly should be amplified accordingly.

For comparison, it's interesting to look at the same charts using the two models individually, see below.  When either model by itself shows a large cold anomaly, there is no obvious bias of the NWS forecasts, although the data on the warm side still suggests an error pattern in the most extreme warm events.


What do I conclude from this analysis?  A general conclusion - and one that is well known - is that having access to independent model forecasts is very useful for assessing the likelihood of extreme events.  This is obviously one justification for running model ensemble systems such as the GFS ensemble forecast, but using a completely independent system like ECMWF provides even more valuable information.

The more specific conclusion is that there is some potential to improve the Day 7 temperature forecasts in Fairbanks when the GFS and ECMWF forecasts are closely aligned in showing a large temperature anomaly.  In other words, the degree of agreement between the models is itself a useful predictor and should be part of the forecast process.  Each model by itself has limited skill at day 7, but when the models line up, then this sends a signal that predictability is higher, and the forecaster would do well to pay attention.

Thursday, October 23, 2014

Disappearing Sun; Barrow Update

Today marks the day when the sun's angle above the horizon at solar noon has declined half way from the equinox to the winter solstice; or equivalently we have traveled three-quarters of the way from the summer to winter solstice in terms of the sun's elevation at noon.

What does this mean?  It means we hereby enter the dark third of the year in the northern hemisphere; and of course this fact is more inescapable the farther north you go.  We can illustrate the lack of solar energy across Alaska in winter by calculating the theoretical solar insolation under clear skies.  From this theoretical standpoint, the total solar energy received in Fairbanks over the next 4 months is less than is received in 6 days in the height of summer.  In Bettles the dark third of the year receives less radiation than in 4 days in summer.  However, in Anchorage the winter sun provides the equivalent of about 10 days in summer.

Here's the view at close to solar noon yesterday from the Alaska Climate Research Center webcam on UAF West Ridge.  The weakness of the sun is illustrated by the fact that some snow remains on the ground despite most days getting above freezing in the past two weeks; the official snow depth in Fairbanks has been at 1 inch for 10 days now.


On another note, Barrow has had a chilly and very windy time of it in the past several days, with a very strong pressure gradient importing cold Arctic air from the northeast.  Here's the surface analysis from Monday afternoon when winds were sustained at about 40 mph for a time.


The high temperature on Tuesday was only 17 °F in Barrow, which is the coldest day so early in the season since 2002.  As we've mentioned many times before, Octobers since 2002 have been extremely warm in Barrow compared to previous decades, and so this kind of chill would have been completely normal in the last century.  For example, the 1930-2000 normal for coldest high temperature to have occurred by October 21 in Barrow was 10 °F; and a high temperature of 17 °F would normally have been observed by October 12.  In 1996, when sea ice was firmly established from Barrow eastward by late September, the high temperature was -7 °F on October 11!

So, it's been a little cooler in Barrow in the past few days - but even this is only approaching normal from earlier decades.  October 2014 is still running well above both the 1981-2010 and 1971-2000 normals.

Wednesday, October 22, 2014

Anchorage Forecast Performance

This is a follow-up to Richard's excellent post on Fairbanks' forecast performance. What I want to focus on is the comparison of the official forecast to both climatology and persistence. Unlike Richard, I have not been proactively saving forecast products. Instead, I utilize the Iowa State text product finder. One of the forecast products is called the State Forecast and represents point forecasts for first-order stations. The product is issued twice daily and includes a minimum and maximum for the next 7 days (morning issuance) and 6.5 days (afternoon issuance). Figure 1 shows a sample State Forecast product.


Figure 1. State Forecast product issued by the Anchorage NWS Office on October 22, 2010.

In Figure 1, you will notice a series of minimum, maximum, and precipitation probability forecasts. Unfortunately, only the Anchorage and Juneau offices issue State Forecasts; hence, our analysis will focus on Anchorage (I know, not very Deep Cold). A choice must be made as to whether to use the morning or afternoon issuance. In this case, we used the afternoon forecast product, which effectively gives us a 6 day forecast. This option provides the shortest time window for assessing the Day 1 forecast (best case scenario) and makes the day-to-day comparison more meaningful. It also allows for a baseline to conduct a persistence forecast comparison. On the negative side, it eliminates Day 7 as a forecast period.

Forecast temperatures vs. Actual Temperatures

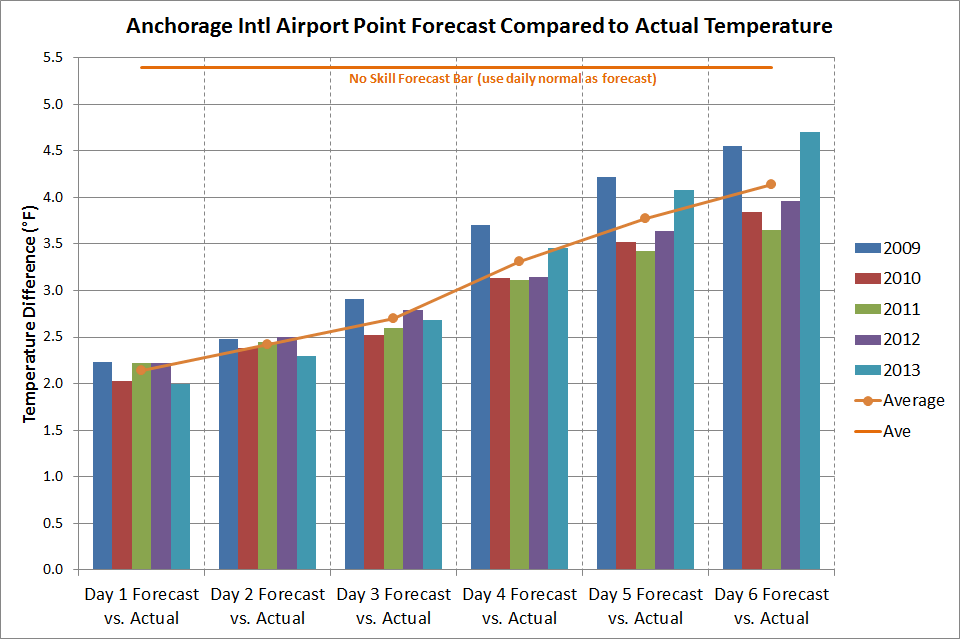
When looking at days 1 through 6, we see decreasing skill in the temperature forecast. This is not surprising, as we would expect this result for every forecast issued anywhere in the world. The question is how much value do we get from the forecast compared to another method. In Figures 2 and 3, we see the 2009-2013 difference between the forecasted temperature and the actual temperature for Day 1 through Day 6. Figure 2 is a summary by year and Figure 3 is a summary by month.

On both charts, we see decreasing skill the farther out in time we get; however, the actual forecast always exceeds the no skill forecast (climatology). The most dramatic forecast skills are in the winter months when the skill for Day 1 through Day 3 is especially high. A noticeable drop off is observed by Day 4. We see in Figure 2 that on average, the Day 1 forecast provides 3°F of improvement versus climatology and the Day 6 forecast provides 1.3°F of improvement.

A caveat regarding 2009 and 2013 in Figure 2. Those years had very large temperature anomalies and so the forecast skill for those years suffered accordingly.


Figure 2. Difference (absolute value) between forecasted temperature and measured temperature for Day 1 through Day 6 in Anchorage, Alaska, between 2009 and 2013. All months are aggregated for each year.


Figure 3. Difference (absolute value) between forecasted temperature and measured temperature for Day 1 through Day 6 in Anchorage, Alaska, between 2009 and 2013. All years are aggregated for each month.

Forecast temperatures vs. Climatology

If you had no access to television, radio, or the Internet, one option for generating a 6-day forecast is to predict that each day will be exactly normal; i.e., just use the numbers from the NCDC normals table. As it turns out, climatology appears to be a factor in the NWS forecast. As a forecaster, you would feel comfortable predicting that Day 1 is 20°F above or below normal based on the numerical models is the situation was warranted; however, the comfort level with a forecast of 20°F above or below normal for Day 6 is much reduced. Therefore, the forecast is tempered somewhat by trending it toward climatology. Figures 5 and 6 show the difference between the forecasted daily temperatures and the NCDC published temperature.

Looking at Figure 4, the Day 1 forecast is slightly more than 5°F different than the published normal temperature. However, by Day 6, the forecasted temperature is 3.7°F difference than the published normal temperature. In Figure 5, we see the breakdown by month. In every month and in each year, the forecast trends toward the climatological daily normal.


Figure 4. Difference (absolute value) between forecasted temperature and the NCDC published normal temperature for Day 1 through Day 6 in Anchorage, Alaska, between 2009 and 2013. All months are aggregated for each year.


Figure 5. Difference (absolute value) between forecasted temperature and the NCDC published normal temperature for Day 1 through Day 6 in Anchorage, Alaska, between 2009 and 2013. All years are aggregated for each month

Which Forecast is the Best?

So how do the point forecasts for Days 1 through 6 compare to a no skill forecast? For this analysis, we add a second type of no skill forecast called persistence. This is where you forecast that the temperature tomorrow will be the same as the temperature today. This can be extended all the way out through Day 6. When we do this, the results are shown in Figure 6.

We see that over the course of out 5-year period, the NWS forecast for the Anchorage International Airport is off by slightly more that 2°F (see Figure 3 for an NWS forecast breakdown by month). This is 1.1°F less (better) than a strict persistence forecast and 3.3°F less (better) than a climatology forecast (see orange line in Figure 3 for a climatology breakdown by month).

By Day 3, the climatology forecast catches up with the persistence forecast. Looking out to Day 6, the NWS forecast sill exceeds climatology by 1.3°F. The maximum differential between the NWS forecast and the no skill forecast is at Day 3.

Due to high variability of temperatures from year-to-year, it is impossible to assess the relative forecast improvement over this short time period. However, there is a large skill improvement when using the NWS forecasts for temperatures as compared to the alternatives.


Figure 6. Difference (absolute value) between actual temperature and three forecast methods for Day 1 through Day 6 in Anchorage, Alaska, between 2009 and 2013.


Monday, October 20, 2014

Fairbanks Forecast Performance

For some time I've been meaning to take a look at the long-term performance of the National Weather Service temperature forecasts for Fairbanks, and particularly with one question in mind: do the forecasts show enough variance at the end of the short-term forecast period, i.e. 5-7 days in the future?

The question is motivated by the idea that sometimes the computer models indicate a pronounced temperature anomaly from about a week in advance, but the early NWS forecasts for the same time show only a small departure from normal.  A recent example was seen in the early October cold spell, when the ECMWF and GFS deterministic forecasts of September 29 both showed a notable cold anomaly in place by October 5, but the NWS forecast for the high temperature on October 5 was 38 °F, only 3.6 °F below normal.  In this case, as time went on and the forecast became more certain, the forecast dropped and the observed high temperature was 31 °F.  However, there are many cases when the computer forecasts are badly wrong from 7 days out, and so it is entirely justifiable for the official forecast to show only a small anomaly at longer lead times.  Indeed, it would be most undesirable for the raw model forecast to be reflected in the official outlook, because the numbers would often swing wildly from day to day.  The question is, does the NWS have the right balance?

It's possible to answer this question using a history of NWS forecasts that I have collected for Fairbanks airport since November 2011.  First, here is the basic "skill" of the forecasts for lead times of 1-6 days, i.e. the forecasts for "tomorrow" through "6 days from now".  Averaged over all seasons, the average error of the high and low temperature forecasts is similar and rises from just over 4 °F to nearly 8 °F over the six days.  Not surprisingly, the errors are much larger in winter, but it is interesting to see that the winter low temperature forecasts improve more significantly at shorter lead times, whereas the winter high temperature forecast error remains over 7 °F even for "tomorrow".


Here's a similarly-formatted chart showing the bias of the forecasts, i.e. the mean difference between the forecast and the observed temperatures.  Negative values indicate that the forecasts were too cold on average.  We see that the winter high temperature forecasts have been several degrees too cold on average in the past 3 years, even at shorter lead times, but the bias is much smaller for the low temperatures.  It would be interesting to investigate this further in search of a possible explanation.


Let's now consider the scaling of the temperature forecasts.  I've examined this by calculating the mean absolute error (MAE) that would result if the NWS forecast anomaly (departure from normal) were multiplied by values ranging from 0 to 2.  On the low end of this range, the forecasts would deviate very little from climatology and the forecast would just show normal values each day; but on the high end, the forecasts would show greater deviations from normal than they currently do.  The chart below shows the results of this experiment for day 7 temperature forecasts from all seasons of the year.


The data from the last 3 years show that (on average through the year) the high temperature forecasts are perfectly scaled at day 7, i.e. there is no way to improve the MAE by arbitrarily reducing or increasing the forecast anomaly.  We conclude that the NWS shows just the right amount of variance on average in the day 7 high temperature forecasts; this is not to say that we can't improve on any given forecast using additional information, but we can't reduce the error by simply adjusting the departure from normal across the board.

The day 7 low temperature forecasts are not quite optimally scaled, according to these results, as the NWS shows marginally too much variance.  In other words, the forecasts would be marginally (but only very slightly) better if they showed smaller departures from normal.

There is one other aspect of the problem that interests me, and that is whether we can show that the forecast variance is too small when the computer models show a large anomaly (as opposed to any size anomaly) and/or when the computer models agree with each other.  I'll return to this idea in a subsequent post.