Tuesday, November 24, 2020

Inversion Season

Fairbanks has seen some notably strong temperature inversions lately, thanks to an abundance of clear skies and windless conditions with high pressure aloft.  This is, of course, the time of year when valley level weather tends to become persistently colder than conditions aloft, even during the middle of the day; the sun provides very little daytime heating now.

Here's a chart showing the seasonal cycle of afternoon temperatures at the surface and at the 925mb level, which is about 1800-2000' above valley level (but varies).  I've used data from 1992-2019 for the calculation, because the Fairbanks balloon soundings didn't regularly report 925mb conditions before 1992.  Click to enlarge the figure.

Fully one-third of the year (November through February) sees a temperature inversion, on average, at the 3pm observation time.

At 3am, on the other hand, an inversion is typically present between these two levels throughout the year.

Notice that the mid-winter temperature profiles look about the same at 3am and 3pm; there's not much systematic diurnal temperature range, especially above the surface.

It's interesting to consider how these curves vary with El Niño and La Niña; we're in a La Niña this winter, so might this explain the recent strong inversions?  The answer seems to be no; La Niña winters are often colder, but perhaps counter-intuitively, the inversion is not stronger - see below.

Here's the corresponding chart for El Niño: slightly warmer than normal temperatures, but the departure from normal is not as large as during La Niña.

A direct comparison of the surface-925mb temperature differences reveals that the inversion actually tends to be stronger in El Niño winters - see below.  It seems this is because El Niño winters tend to be drier, with more southerly flow over the Alaska Range owing to a strong Aleutian low; so with more clear skies over Fairbanks, inversions are more often pronounced in the El Niño pattern.  In contrast, La Niña tends to bring colder air but also more cloud cover from the west and northwest; temperatures aloft are considerably colder, but there's not as much opportunity as one might expect for inversions to amplify the cold.

Finally, here are the recent 3am observations in comparison to normal.


Last week's surface-925mb temperature difference of 39°F is an elite-level inversion; this is only observed on about 1% of days in November through February, and the earliest it's ever been observed is just a couple of days earlier, on November 16, 2014 (with data back to 1992).  The 1992-present record is 53°F on February 10, 2018; see this post for discussion of that event and a climatology of inversion strength at all of Alaska's upper-air observation sites.


Thursday, November 19, 2020

Arctic Impacts Controversy

Work and life have been a little too busy for posts lately, but earlier this week I saw a brief new article published in Nature Climate Change on the topic of Arctic warming and its possible impacts on mid-latitude climate.  Here's a link for reading (it's very brief):

Weakened evidence for mid-latitude impacts of Arctic warming 

The authors (Blackport and Screen) are in the camp that has pushed back against the much-publicized idea that rapid Arctic warming may be significantly affecting weather patterns at lower latitudes; the hypothesis is that rapid Arctic warming is producing greater "waviness" in the jet stream and more frequent mid-latitude cold outbreaks in winter as Arctic air is discharged to the south.  My impression is that this hypothesis gained a lot of credence until quite recently, but it seems the pendulum is now swinging back the other way.  This new piece, and a review article earlier this year by Cohen et al. that argues in the other direction, add fuel to the fire of controversy.  A pdf copy of Cohen et al. can be found here.

It may be a little presumptuous to weigh in on a topic that is attracting so much attention from very competent researchers, but I've been looking at this for work, and a couple of issues do seem worthy of comment.  First, there's no question in my mind that Arctic "blocking" has simply not increased in parallel with the dramatic loss of Arctic sea ice.  In contrast, there's a clear case to be made that the winter jet stream has often been stronger and more uniformly westerly in recent decades than before the era of strong Arctic warming.  The chart below shows the Arctic Oscillation index since 1950 for winter (blue) and summer (red), and it's clear that the December-February index values have been generally more positive since 1988 than before.  If we focus only on 1988-present, as Cohen et al. did, then we might claim a downward trend through about 2013, but the larger context tells a different story.


The North Atlantic Oscillation, which is closely related to the AO but focuses on the jet stream behavior over the North Atlantic sector, shows a similar picture; it's been 10 years since there was a significantly negative NAO phase in winter (see below).  I see no evidence of increased winter blocking (more negative NAO), but rather the reverse is true for the full period since 1950.  However, it certainly is interesting to see that the summer NAO has frequently been significantly negative in recent years.  This reflects an association between summer weather patterns and sea ice loss - but which causes the other is difficult to say.  I discussed the summer ice/weather connection back in September.


If we look at the strength of the winter-time westerly winds at 60°N (a latitude that's commonly used to monitor the status of the stratospheric polar vortex), there is zero trend from 1960-present in the lower stratosphere (100mb).  At the mid-stratosphere level of 10mb, the ERA5 reanalysis data suggest a slight decrease in winter westerly flow, but the trend is nowhere near statistically significant.  At 500mb, in the mid-troposphere, there's a slight increasing trend, but again not significant.

In view of this data, I agree with Blackport and Screen that the evidence doesn't support the purported mechanism for increased mid-latitude volatility; the winter-time jet stream and polar vortex have not weakened, and if anything the large-scale circulation modes (AO and NAO) have become less favorable for mid-latitude cold outbreaks in winter.

Second, I also concur with Blackport and Screen that there's very little reason to believe that mid-latitude land areas have seen "almost no warming" (to quote Cohen et al.) in winter during the era of Arctic amplification (i.e. the last 30 years or so).  Here's a chart showing mid-latitude land area temperature trends for December-March from various sources (December-March was used by Cohen et al.); click to enlarge.


Here I've calculated trends for 1993-2016, which is the period for which model forecasts are available from the seasonal dynamical models included in the EU's Copernicus program.  I'll comment on these models below.  For now, notice that the smallest warming trend is found in the NCEP global reanalysis ("R1"), and this is the source that was used by Cohen at al. to support their statement that "the observations show that temperatures across the midlatitude continents have remained nearly constant".  Unfortunately, the NCEP reanalysis is a 25-year-old model that runs at a very coarse resolution and simply doesn't represent the state of the art for climate reanalysis.

In contrast, the modern ERA5 and JRA-55 data sets show greater warming trends and agree closely with each other.  These also agree quite closely with data from NOAA's surface temperature analysis, which is derived from surface observations rather than estimated from a model.  It's clear that ERA5 has tended to be warmer in recent years, and cooler in earlier years, than NCEP R1 (with both series having the same zero-anomaly baseline here).  If we had measured the temperature trends ending in 2013, we might have tentatively concluded that the data was hinting at more cold air discharge to the mid-latitudes, but the last several years have greatly weakened that hypothesis, in my view.

Having said all that, it is interesting to see that the observed mid-latitude warming has not been as great as the Copernicus models expected in their November-issued forecasts for December-March (as illustrated by the green trend line above).  Compare the two maps below, showing the spatial distribution of trends in the Copernicus and ERA5 data.  The Copernicus forecast models show considerably more warming in central and eastern Canada and the contiguous U.S., and there's also a much broader zone of warming in western and central Russia.  ERA5 even shows a few areas of cooling, but these aren't captured in the Copernicus forecasts.


I think it's fair to say, then, that mid-latitude temperature trends in the past couple of decades have not conformed to model expectations, as warming has not been as widespread and pronounced as the models predicted.  This much is consistent with Cohen et al., and so I think we can't yet rule out the possibility that Arctic amplification has a systematic effect that dampens warming in the mid-latitudes.  However, if this is happening, it's not because Arctic blocking has increased or the polar vortex has weakened, so I believe the fundamental mechanism proposed by Cohen et al. is not correct.

In my view, the most likely explanation for the relatively small mid-latitude warming is that natural variability of weather patterns has produced a trend on the low side of what might be expected.  With only about 30 years of data to work with, sample size is obviously a huge problem for assessing whether the models are "right".  Time will tell, of course; but I suspect we will eventually dismiss the counter-intuitive idea that Arctic warming causes mid-latitude cooling.

For the sake of completeness, here are the temperature trend maps for NCEP R1 (very unrealistic cooling over Asia), JRA-55, and NOAA.


And here's a chart of high-latitude trends, for both land and ocean:

In this case the reanalysis products show more rapid warming than the Copernicus models - the opposite of the situation in the mid-latitudes.  As noted by Cohen et al., the models show warming "more equitably distributed between the Arctic and midlatitudes"; they argue that this is because Arctic amplification favors greater "meridional exchange of air masses" than expected by the models, but I'd argue that the lack of increased blocking means this cannot be the case.


Saturday, November 7, 2020

Cold Then Snow

It's been a dramatic week for weather in central Alaska, with near-record-breaking early cold followed by a new November record for 24-hourly snowfall yesterday in Fairbanks.

The cold snap deepened further after I posted on Monday, and on Wednesday morning the temperature fell to a remarkable -29°F at Fairbanks airport; this level of cold so early in the season was only exceeded in 1975, which reached -30°F on the same date.  The Smith Lake sensor at UAF recorded -35°F, and the North Pole 1N co-op site apparently reached -41°F (although this seems a little low; the other North Pole co-op only reported -32°F).

Here's a 7-day temperature trace from Smith Lake.  With cloud, snow, and a massive influx of warm and moist air aloft, the temperature rose more than 65°F in two and a half days.


The mid-atmosphere map from early Friday morning shows a long fetch of strong flow from the west-southwest, which is the classic direction for sustained heavy precipitation in the Fairbanks area.


Up on Munson Ridge, the SNOTEL instrument measured 2.3" of new snow water content over two days, and the liquid equivalent in Fairbanks was a hefty 0.93".  Snow depth at valley level is now up to 19".  Here's some context for the snowfall; this was a big one.


I'll add some more on this soon, but heavy snows in Fairbanks are more common during La Niña; the frequency of 8" snow storms is more than twice as high compared to El Niño.


Monday, November 2, 2020

Cold Snap

Winter has suddenly made its presence known with sharply lower temperatures across much of the interior in the past few days, and last night saw widespread -20s Fahrenheit for the first time this season.  Click to enlarge:


The perennial cold spot of Chicken saw the state's first -40° this morning, and this is notably earlier than usual.  In Chicken itself it is the earliest -40° on record, but data only extends back to 1997; and in 2008 it was -39°F on October 28.

It's interesting to note that the first -20°F in Alaska was only 4 days ago (in Wiseman), and the first -30°F was just yesterday at Chicken.

In Fairbanks-land the usual cold spots did their thing (-28° near Goldstream Creek, -26° at Smith Lake, and -31° over at Salcha), but it was surprisingly cold in the hills too: for instance, -14° at 2150' elevation to the east of Eielson AFB.


Despite the cold, the Tanana River is not quite frozen up at Nenana; patchy ice was still flowing past the webcam today.


However, the Yukon froze up yesterday at Dawson City:


Saturday, October 31, 2020

Sea Ice Update

I haven't mentioned Arctic sea ice since its seasonal minimum a month and a half ago, but in recent weeks an extraordinary situation has been unfolding on the Russian side of the basin, with a rapidly growing ice deficit as freeze-up is delayed across large areas.  The latest graphics from NSIDC illustrate this clearly: ice free waters still exist all the way from the Barents Sea across to the Chukchi and Bering Seas.


In the last several days, the Arctic-wide ice extent has been more than 10% below the previous record low for the time of year, which was in either 2016 or last year, depending on the date.  Here are the October 30 ice concentration images from those two years.  (Note that NSIDC's extent number comes from the area with at least 15% concentration.)


Perhaps most remarkably, the ice extent is now more than 5 standard deviations below the 1981-2010 normal for the date; it crossed this threshold for the first time on record just 3 days ago.  The time-series chart above shows why: the 1981-2010 range of variability tightens up a lot during October, so a much-delayed freeze-up like this year becomes increasingly anomalous compared to that range.

Here's a chart of the annual range of standardized daily ice extent anomalies.  The top of each column is the highest anomaly in the year, for example just below -1 standard deviation this year; the daily ice extent has not been above the daily normal since the spring of 2012.

It's interesting to see the rather steady progression of lower minima every few years; 2007 set a record minimum for ice extent at the time, 2012 set the record that still stands, and 2016 was another very low ice year (especially in the spring and autumn, like this year).  The downward march of ice loss extremes highlights the ongoing trend more clearly than, say, the September ice extent, which arguably has not had much trend since the big meltout of 2007.


Saturday, October 24, 2020

First Zero

The Fairbanks airport thermometer dropped to 0°F for the first time this season yesterday morning; this is a few days earlier than usual.  The chart below shows the date of this annual occurrence, which usually happens after the establishment of permanent winter snow cover (but not in about 10% of years, including 2016, 2017, and 2018).


To me, the interesting aspect of this chart is not so much the lack of long-term trend (as illustrated by the dashed line), but the reduction in variance in recent years.  Since 2009, the first 0°F has not occurred earlier than October 22 or later than November 6, a span of only 16 days; but earlier decades were much more variable.  In fact, fully half of all years from 1930-2009 saw the first 0°F outside the Oct 22 - Nov 6 range; and so the chance of not falling outside that range for 12 straight years is extremely small based on random chance alone.

What might explain the lack of variance in the past decade?  Perhaps the weather patterns have been fundamentally less variable at this time of year; it would take some work to examine whether that is true.

I suspect rather that it's a combination of two factors: first, the overall warming trend, which is very pronounced in the Arctic at this time of year (related to low sea ice), would tend to prevent 0°F being reached at an early date; it's just not cold enough in the atmosphere at large.  For instance, perhaps the +3°F on October 16 this year would have been 0°F in earlier decades.

But a contrary influence may be in play as Arctic weather patterns change in response to the drastic reduction in October sea ice extent; it's possible that late Octobers of the last decade have not produced the kind of weather that keeps temperatures up until a later date.  There's a hint of evidence for this if we look at the average pressure and 500mb height from the last 10 years at the critical time of year:


In general, late October and early November of the past decade have tended to see low pressure over the Chukchi Sea and a ridge over Alaska, and I would interpret this as favoring generally clear skies and calm conditions in Fairbanks - which in turn would favor colder overnight low temperatures at this time of year.  It seems plausible that the Chukchi Sea trough is related to excess warmth and open water there, so the persistent pattern may be developing at least partly in response to the Arctic changes.  I wouldn't want to be definitive about this; but it does seem unlikely to be a coincidence that this particular nuance of Fairbanks climate has changed so noticeably at the very time of year when sea ice reduction might produce its largest effect.


Friday, October 23, 2020

Freezing Drizzle

The Fairbanks scene finally gained a more wintry decoration on Monday, with a couple of inches of snow produced by a weak upper-level disturbance.  But by Wednesday, as strong high pressure developed overhead, a different kind of wintry precipitation developed: freezing drizzle.  According to the airport instrument, drizzle occurred for about 7 hours, with temperatures in the mid 20s.

Here's a previous post on the topic of freezing drizzle.  As noted there, the phenomenon tends to occur more often in early winter than mid-late winter in Fairbanks, and this is consistent with the fact that the saturated lower part of the atmosphere needs to be entirely above about -10°C.  If any part of the cloud is colder, then ice is usually present, and solid hydrometeors always grow preferentially over liquid ones in a mixed phase cloud.

The soundings from Fairbanks at 4am and 4pm Wednesday confirm that the low-level cloud layer was shallow, with temperatures no lower than -10°C, and with dry air above the cloud.


Below are the surface and 500mb analyses from 4pm Wednesday, courtesy of Environment Canada.


With cold air aloft (-34°C at 500mb) and a strong anticyclone in place, one might have expected colder conditions at valley level, but all the moisture kept temperatures relatively high.  This is typical of freezing drizzle situations: in 34 days with freezing drizzle at Fairbanks since 1998, the daily mean temperature was above normal in 32 of 34 cases.

Here's a chart showing the number of hours each winter with freezing drizzle reported by the ASOS instrument at the top of the hour.  This is now the 8th consecutive winter with at least one occurrence.


Saturday, October 17, 2020

A Chill in the Air

What a difference a week makes.  Interior Alaska temperatures quickly dropped off from a high temperature of 51°F last Saturday, and thermometers marched steadily down through the week, with each day colder than the last until today.  Yesterday was remarkably cold in some spots; here's a round-up of low temperatures yesterday morning (click to enlarge).


The -11°F (actually -12°F) at Smith Lake on the UAF campus is quite impressive for the date, although the sensor is in a serious cold spot.  Fairbanks airport only made it down to +3°F.

Here's a look at the seasonal plunge over the last 3 weeks as registered at the Smith Lake site.


The Salcha RAWS measured -9F, and not surprisingly the river there is already iced up.  Here's a beautiful photo from this morning, courtesy of Twitter user NateoftheNorth.  You really should click to enlarge this one.


Despite the cold, measurable snow still hasn't arrived in Fairbanks, with just a trace reported on Wednesday and Thursday.  It's interesting to consider the coldest conditions that have ever occurred prior to measurable snow: back in 1941, the temperature dropped to -6°F on October 14, and snow wasn't measured until 4 days later.  This year's +3°F ties with 1969 for second coldest prior to having snow on the ground.

If we look at accumulated cold as measured by total freezing degree days, then this year is so far in 3rd place for cold prior to any snowpack.  2016 also had a decent freeze prior to the October 20 first snowfall, but most years have little or no freeze-up prior to snow; the median FDDs is zero.


Saturday, October 10, 2020

Warmth Will End

Exceptionally warm weather has continued across interior and northern Alaska, with Fairbanks currently sitting at the 3rd warmest start to October on record (1930-present); only 1969 and 2003 were warmer.  As of today, the normal daily high temperature is 36°F, but the coldest day so far this autumn was only 42°F back on September 24.  The average high temperature so far in October has been 56°F.

Fairbanks airport also hasn't seen even a flake of snow, and we're two and a half weeks past the date when that normally happens.  The median date for first snow is September 22, and about 85% of years receive measurable snow on the ground by October 10.  However, it looks like the white stuff will arrive next week, so the record for latest first flakes (October 20 in 2018) won't be threatened.

One might be tempted to think that such a warm spell in late autumn would portend a mild winter, but in fact there's a slight inverse correlation between September and subsequent November-March temperatures in the interior.  And as I mentioned a couple of weeks ago, with La Niña under way in the tropical Pacific, a cold winter is more likely than a warm one in interior, southern, and southeast Alaska.

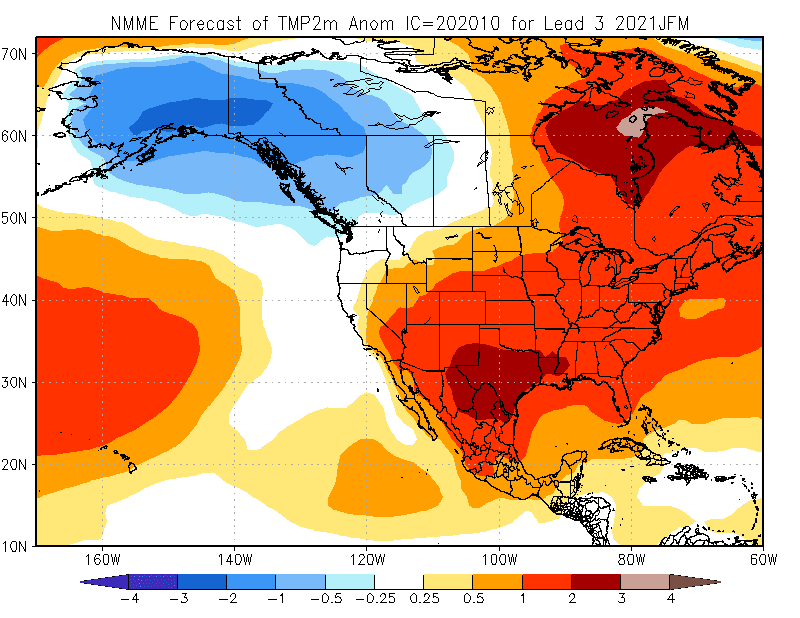
Speaking of La Niña, the latest guidance from long-range forecast models has become considerably more bullish, and it's looking increasingly likely that this La Niña will end up as one of the stronger events of recent decades.  The models have also come into dramatically better alignment on expected cold for much of Alaska; here's the latest multi-model ensemble mean anomaly for January-March, which has the coldest 3-month period in the forecast.


The inter-model agreement is unusually good, as all of the models are now being heavily influenced by the La Niña forcing (see below).  One comment on this: confidence in the forecast is not as high as this agreement would suggest, because much depends on the evolution of the Arctic Oscillation and other high-latitude patterns, and these are much less predictable than the standard La Niña influence.  The models are good at showing the overall influence of La Niña, so they inevitably look similar in these situations, but other aspects of the winter circulation pattern can easily modify the outcome at middle and high latitudes.

It's really very interesting that the forecast for the upcoming late winter period (January through March) looks very similar indeed to the outcome last year across most of the extratropical Northern Hemisphere - compare the two maps below.  There's remarkable similarity across the North Pacific domain in particular, but of course the tropical Pacific is much different: last winter wasn't a La Niña at all, as we noted at the time (see here), but it looked a lot like a La Niña outcome in Alaska.

For reference, here's the January-March temperature anomaly in 10 strong La Niña events of the past.


Finally, the maps below show the monthly progression of NMME forecast maps.  Note that the cold signal doesn't come into play at all until December, and it peaks in February.  But as noted above, this is just the model signal, influenced mainly by the La Niña forcing; don't put too much faith in it, as there will inevitably be much more variability from month to month.