Showing posts with label Seasonal Forecast. Show all posts

Wednesday, May 6, 2026

Big El Niño Coming

Most readers are probably well aware that El Niño is on the way for next winter; the forecasts have been well-publicized.  Normally one would be wise to take El Niño forecasts with a grain of salt at this time of year, because there is a notorious "spring barrier" of predictability in Northern Hemisphere spring, but in this case the signals are so strong and coherent that there's little doubt of the outcome.

The most compelling evidence that a major El Niño is about to emerge can be seen in the profile of subsurface temperature anomalies in the equatorial Pacific.  The figure below is a couple of weeks out of date, but it shows a very intense warm anomaly below the surface, and this is migrating eastward and upward.  As the warmth continues to emerge at the surface, East Pacific equatorial surface water temperatures will become much warmer than normal, consistent with a strong El Niño signature.


The warmth produced by the subsurface anomaly will add to the substantial surface warming that has already occurred in the last few months, so it seems inevitable that the equatorial SST anomalies are going to become quite extreme in the next few months.  The canonical Niño3.4 SST index is already near 1°C above normal, although this includes a contribution of about 0.5°C from long-term warming in recent decades:


Here's a chart showing the recent progression of Niño3.4 SST anomaly forecasts from ECMWF's seasonal model.  The red line is the latest forecast; the model has been adjusting warmer with every run in recent months.


If the forecast is correct, the Niño3.4 anomaly may approach +3°C by autumn, with the modern record being +2.7°C in November 2015 (relative to a 1991-2020 baseline).

What does this mean for Alaska?  We'll discuss prospects for next winter another time, but for summer the history of past years with strong El Niño conditions (see below) suggests a heightened probability of above-normal temperatures, driven by relatively high pressure (ridging) from Alaska to the Canadian Arctic.  The top analog years also show dry summer conditions in Southeast Alaska and hints of dryness in southern interior and western Alaska.  Note that this is based simply on the 10 years since 1950 with the most positive Multivariate ENSO Index in June through August.


However, not all El Niños are created equal, and analog years show a lot of variability.  To illustrate this, here are temperature percentile maps for six summers when a robust El Niño developed by autumn following La Niña-like conditions the previous winter.  Where possible, I've used a preceding 30-year baseline for a fair comparison across the decades.


More recently, 2015 produced a very strong El Niño, but that episode didn't emerge from a cool phase in the previous winter.  There was also a robust El Niño in 2023, although its oceanic warm signature was inflated by unusual global warmth.


Not surprisingly, temperatures from the northern Gulf Coast to southwestern Alaska tend to be linked to the PDO phase, which was positive in 1957, 1986, (especially) 1997, and 2015, but negative in 1965, 1972, and 2023.  Elsewhere, variability is large among the analog years, although there isn't much cool to be found in northern and western - or southeastern - Alaska.

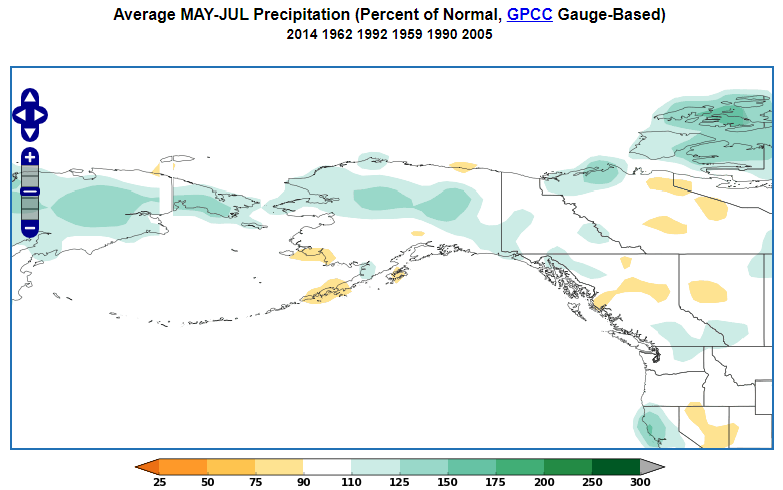
Similar maps for precipitation are included below.


It's difficult to pick out any consistent moisture signals on the maps, but interestingly ground-truth data from Fairbanks shows that none of the top 6 El Niño analog years had above-normal rainfall for May through September.  Click the figure below to enlarge (2014 is included only to show the record wettest summer):


Juneau also shows distinct indications of a (relatively) dry summer when El Niño develops in a similar way:


Summer rainfall can go either way in Anchorage, however:


For a more comprehensive look at all the seasonal climate guidance for this summer, I highly recommend tuning in to Rick Thoman's briefing on May 22:

https://uaf-accap.org/event/may2026-climate-outlook/


Monday, June 27, 2022

Prediction of Extremes

[Warning: technical discussion]

Lately I've been spending some time exploring forecasts of short-duration extreme events on the seasonal forecast horizon, i.e. months ahead.  Seasonal forecasts are usually presented in terms of the shift in probabilities for seasonal-average conditions, for example total rainfall or average temperature over the course of a summer, but it's interesting to consider whether we can say anything about the chance of short-duration extreme outcomes within that seasonal window.

To look at this problem, I'm using forecast data from the ECMWF and UK Met Office seasonal models, available via the EU's Copernicus service.  The models produce daily data out to 6 months in the future, and as usual there is an ensemble of different outcomes to sample the uncertainty.  Moreover, in addition to the realtime forecasts, the models are run in hindcast mode for 1993-2016, so that we can calculate things like model bias and model skill.

Here's the result that grabbed my attention and prompted this admittedly technical post: notice the wet signal over interior Alaska.  Qualitatively, this shows an enhanced risk of an extreme 3-day precipitation event some time during the July-September period.

Bear with me on the explanation of this map, as it's not entirely simple.  There are two steps involved in the calculation.

First, use the hindcasts to find the threshold for a once-in-24-year precipitation event in the model climate for this time of year.  The 24-year recurrence interval is arbitrary, but it makes the calculation easy with 24 years of hindcast data and corresponding observations.  On average, 1 in 24 model ensemble members show a 3-day precipitation event of this magnitude at some point in the July-September window.

Second, count the number of ensemble members in the current forecast that show 3-day precipitation above this threshold; and divide by 1/24 to get the increase in risk relative to the model climate.  For instance, if 5/51 members show the extreme, then the risk is about 2.4 times normal (240% of normal on the map).  If only a single member (1/51) shows it, then the risk is about 50% of normal.  Of course, all of the probabilities are small: 5/51 members is still only a ~10% chance.

The spatial patterns in the map above are fairly consistent with the model's standard forecast for 3-month total precipitation, as you'd expect, although the extremes-focused calculation provides some interesting nuance.  Here's the Copernicus map for July-September total precipitation anomaly, i.e. departure from normal.


The Climate Prediction Center's seasonal forecast (see below) also has a slightly enhanced probability of significantly above-normal precip for much of interior Alaska, and of course by itself this does imply an increased risk of a short-duration extreme event.  It's certainly possible to see upper-tercile seasonal total precipitation without any particularly extreme events (e.g. summer 2015 in Fairbanks), but there's obviously a correlation in general.


How about the UK Met Office model?  Interestingly this highly-regarded model also shows a signal for increased risk in the southern interior, although the forecasts are fairly dissimilar otherwise.


The burning question here, of course, is whether the models have any demonstrable skill in anticipating extremes.  This is a very challenging question, because by definition we only have a single extreme outcome at each location in the 24-year hindcast history.  Running any meaningful statistics requires aggregating the data over a large area, and therefore smoothing out potentially important local variations in the model skill.

We also have to reckon with the fact that gridded reanalysis data, which is typically used as "ground truth" in this kind of work, is undoubtedly deficient when it comes to representing short-duration precipitation extremes.  A quick calculation based on ERA5 "observations" suggests that skill may be very marginal or non-existent over Alaska at this time of year, but it's actually possible that real-world skill is better.

In any case, it's an interesting result, and food for thought regarding the best way to make these forecasts.  Let's see what happens in the next 3 months.


Saturday, October 10, 2020

Warmth Will End

Exceptionally warm weather has continued across interior and northern Alaska, with Fairbanks currently sitting at the 3rd warmest start to October on record (1930-present); only 1969 and 2003 were warmer.  As of today, the normal daily high temperature is 36°F, but the coldest day so far this autumn was only 42°F back on September 24.  The average high temperature so far in October has been 56°F.

Fairbanks airport also hasn't seen even a flake of snow, and we're two and a half weeks past the date when that normally happens.  The median date for first snow is September 22, and about 85% of years receive measurable snow on the ground by October 10.  However, it looks like the white stuff will arrive next week, so the record for latest first flakes (October 20 in 2018) won't be threatened.

One might be tempted to think that such a warm spell in late autumn would portend a mild winter, but in fact there's a slight inverse correlation between September and subsequent November-March temperatures in the interior.  And as I mentioned a couple of weeks ago, with La Niña under way in the tropical Pacific, a cold winter is more likely than a warm one in interior, southern, and southeast Alaska.

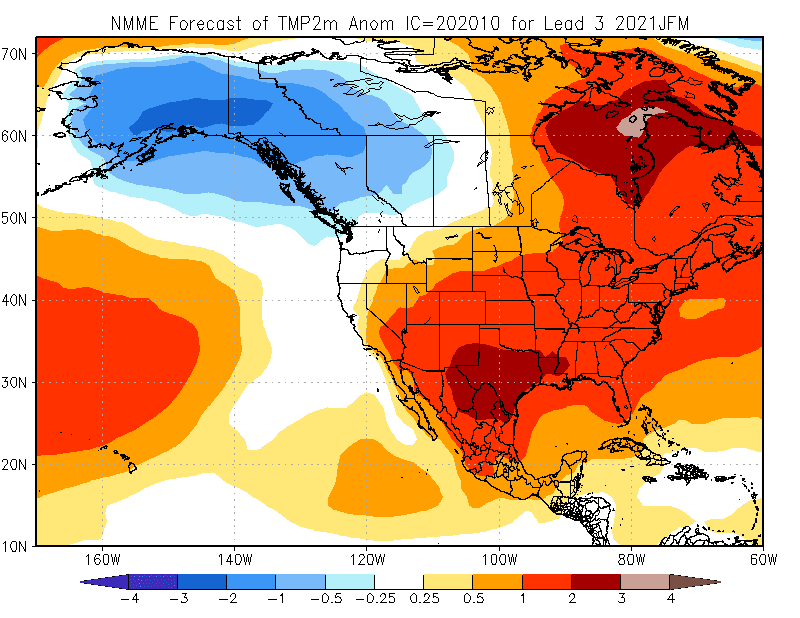
Speaking of La Niña, the latest guidance from long-range forecast models has become considerably more bullish, and it's looking increasingly likely that this La Niña will end up as one of the stronger events of recent decades.  The models have also come into dramatically better alignment on expected cold for much of Alaska; here's the latest multi-model ensemble mean anomaly for January-March, which has the coldest 3-month period in the forecast.


The inter-model agreement is unusually good, as all of the models are now being heavily influenced by the La Niña forcing (see below).  One comment on this: confidence in the forecast is not as high as this agreement would suggest, because much depends on the evolution of the Arctic Oscillation and other high-latitude patterns, and these are much less predictable than the standard La Niña influence.  The models are good at showing the overall influence of La Niña, so they inevitably look similar in these situations, but other aspects of the winter circulation pattern can easily modify the outcome at middle and high latitudes.

It's really very interesting that the forecast for the upcoming late winter period (January through March) looks very similar indeed to the outcome last year across most of the extratropical Northern Hemisphere - compare the two maps below.  There's remarkable similarity across the North Pacific domain in particular, but of course the tropical Pacific is much different: last winter wasn't a La Niña at all, as we noted at the time (see here), but it looked a lot like a La Niña outcome in Alaska.

For reference, here's the January-March temperature anomaly in 10 strong La Niña events of the past.


Finally, the maps below show the monthly progression of NMME forecast maps.  Note that the cold signal doesn't come into play at all until December, and it peaks in February.  But as noted above, this is just the model signal, influenced mainly by the La Niña forcing; don't put too much faith in it, as there will inevitably be much more variability from month to month.


Tuesday, November 12, 2019

Summer Forecast Verification

This is just a quick follow-up to a post from way back in May, where I showed the Climate Prediction Center's summer forecast and commented on a possible connection between equatorial winds in the stratosphere and summer rainfall in parts of Alaska.  Here's the post:

https://ak-wx.blogspot.com/2019/05/seasonal-outlook.html

Let's see how well the CPC forecast did.  First, for temperature: compare the maps below.  The second map shows the estimated summer temperature anomaly (departure from 1981-2010 normal) from the new start-of-the-art ERA5 reanalysis.  The forecast was a strong success, with the very high (>60%) chance of significantly above-normal temperatures in southern and western Alaska being fully justified by the exceptionally warm summer that actually occurred.


Second, for precipitation.  The ERA5 verification map indicates that the wet tilt to the forecast verified as correct for the North Slope, but most of the interior, south, and west was near normal or below normal for summer rainfall.  The expectation for widespread above-normal precipitation was therefore not correct, although the tilt in the probabilities was small and this would be considered only a minor forecast bust.


The ERA5 reanalysis is, of course, only a model, so let's take a second look using gridded precipitation data based solely on surface observations (available only over land).  This shows a wet summer on the Seward Peninsula, which is confirmed by Nome's 10" of summer rain - it was one of the wetter summers in Nome's history.  So this certainly provides some vindication for the CPC forecast.


In my earlier post I suggested that the phase of the equatorial Quasi-Biennial Oscillation (QBO) might produce a drier tendency over northwestern Alaska than the CPC was expecting.  While it did indeed turn out drier in much of the interior, neither of the two locations I cited as showing a QBO influence - Bettles and Kotzebue - had a dry July-August period.  So I won't make any bold claims about this being a success, but it is possible that consideration of the QBO phase might have improved the CPC precip forecast slightly.

Saturday, April 28, 2018

North Pacific Forecast

A couple of months ago I wrote a post on the very unusual warmth that the seasonal forecast models were expecting across the North Pacific this summer.  It was a long-range forecast at the time, but as summer draws nearer the models are not backing off.  The two maps below show a comparison of the February (top) and April (bottom) forecasts for June-August mean sea surface temperature departure from normal; the message is very similar, with the models expecting very anomalous warmth in the north-central and northwestern North Pacific.


As noted in the previous post, the forecasts are consistent with a strongly positive phase of the North Pacific Mode (NPM); here's a chart showing the NPM index values that the models are expecting.


 We've seen in the past that the NPM phase is correlated with winter precipitation patterns across interior and northern Alaska, with above-normal snowfall often occurring when the NPM is positive.  But what can we say about potential impacts for the next few months?  Looking at Fairbanks first, the charts below show the historical relationship of the NPM index with May-July mean temperature and total precipitation.


There's a slight but barely significant tilt towards cooler temperatures at this time of year when the NPM is more positive, but the precipitation chart is perhaps more interesting as it hints at a non-linear relationship.  It appears that the positive NPM phase tends to favor either very wet or very dry weather in Fairbanks, as the 6 driest years and several of the wettest years (in May-July) occurred with a positive NPM phase; but near-normal rainfall is somewhat more likely when the NPM is negative.

Recent years have borne out the wide variation in summer rainfall amounts during a positive NPM phase, as 2013 was very dry (and extremely warm), but 2014 brought record summer rainfall.  Both summers had a strongly positive NPM phase.

The map below shows the typical 500mb height pattern for positive NPM years when dry weather prevails in Fairbanks; not surprisingly the most common location for high pressure is over the eastern interior.


In contrast, years with a positive NPM phase but wet May-July weather in Fairbanks have the ridge axis located farther to the southwest, and importantly these years have an active trough over the Chukchi Sea; so this pattern favors strong westerly flow that brings wet frontal systems across the state.


From a North Pacific-wide perspective, the two patterns are rather similar, but the differences are crucial for rainfall in interior Alaska.  The maps below show the precipitation patterns associated with the two sets of positive NPM years.


So which pattern should we pick to accompany this summer's expected North Pacific warmth?  Well, the seasonal forecast models are clearly choosing the wet option, as a rather strong majority of the NMME ensemble members are showing significantly above-normal precipitation across western and northern Alaska.


The Climate Prediction Center is also going for wet, and the signal is a strong one for western Alaska; it's unusual to see 50+% probabilities of upper-tercile precipitation in the seasonal forecast.


There seems to be little reason to disagree with the strong model signal - it's usually unwise to do so - but just for fun I pulled up the May-July patterns that occurred in past years when Bering Sea ice was very low in the preceding winter (although nowhere near as low as this year): see below.  The sea-level pressure pattern (top map) supports the idea of low pressure over the Arctic waters north of Alaska, but there's also a high pressure signal over most of the state, and interestingly these years were more dry than wet in the interior.


There's obviously more work that could be done to pick apart the varying ways that North Pacific SSTs interact with Alaska's climate at this time of year, but I expect we'll learn something just from watching the pattern unfold in the next few months.  A wet summer seems more likely, but the historical NPM analysis suggests that it could go the other way - and so I think there is a bit more uncertainty about the forecast than the models and CPC would suggest.