Objective Comments and Analysis - All Science, No Politics
Primary Author Richard James
2010-2013 Author Rick Thoman
Friday, February 20, 2026
La Niña Ending Soon
Friday, November 7, 2025
Ocean Temperatures and Halong
In an earlier comparison of ex-typhoon Halong versus other historic autumn Bering Sea storms, I noted an intriguing similarity: Halong, Merbok, and the major storms of 2011 and 1974 all occurred during prolonged La Niña episodes in the tropical Pacific. It's worth digging into this a bit more to see what might be going on.
Looking back at historical data since 1950, there have been 11 years - including this year - when La Niña occurred in late autumn for the second or third consecutive year. (It's not uncommon, by the way, for major La Niña episodes to extend over multiple years, in contrast to El Niño, which tends to be "one and done".) Here's the average sea surface temperature (SST) anomaly pattern in September through November of those years (relative to the long-term trend):
For comparison, here's the September-October SST anomaly this year:
There's a lot more warmth in the northeastern Pacific this year compared to the historical pattern, but there is a similar contrast between a cool tropical Pacific and warmth extending eastward from Japan. The warmth from Japan eastward is very characteristic of a negative PDO phase, and indeed the PDO has been strongly negative in recent months.
Zooming in on the North Pacific, it's interesting to see that Halong and Merbok both passed over very warm ocean water (relative to normal) to the south of the Aleutians before moving up into the Bering Sea. Based on the analysis above, that region of warm water is typical of persistent La Niña and negative PDO regimes.
The storm of 2011 also originated over a region of warm water, although the North Pacific as a whole was much cooler back then.
It's tempting to speculate that the extra warmth and moisture available from the unusually warm ocean to the south of the Aleutians provided more fuel for these storms than would be derived from cooler oceans. Rick Thoman mentioned to me that modeling research is already under way to quantify the role of the unusually warm SSTs for Halong, with preliminary results showing a significant impact.
Another aspect of the persistent La Niña/negative PDO SST pattern is that the north-south ocean temperature gradient is greater than normal near the Aleutians, and this gradient tends to enhance the North Pacific jet stream, providing more upper-atmosphere support for strong extratropical cyclones. Here's the average 500mb height anomaly in the same "persistent La Niña" years; notice the strong trough from the East Siberian Sea to Alaska.
Again, this is not too dissimilar to what we've seen this autumn so far:
It's worth noting that autumns in which La Niña is just developing do not have the same magnitude of warmth to the east of Japan, and they lack an upper-level trough near the Bering Sea that would support (and reflect) strong storm activity. The PDO tends to be less negative.
Part of the reason for the difference is that La Niña favors high pressure ridging over the central North Pacific that gradually produces warmer ocean temperatures over time, and so the warm anomaly east of Japan becomes more amplified by the second or third consecutive La Niña winter. In contrast, an initial La Niña is often developing after El Niño, and so the mid-latitude North Pacific SSTs tend to be cooler owing to the lingering El Niño influence (lower pressure with more wind and cooler conditions to the south of the Aleutians).
An interesting corollary to this discussion is that the long-term trend seems to be favoring more frequent and persistent La Niña and negative PDO conditions in the Pacific; and this therefore seems to raise the risk of more frequent severe Bering Sea storms in autumn. Last year's UAF ACCAP report "Alaska's Changing Environment" indeed documented a recent increase in Bering Sea storms, but also indicated that no clear long-term trend has yet emerged. It will be interesting to see how this assessment evolves in the coming years.
https://uaf-accap.org/alaskas-changing-environment/
Saturday, January 27, 2024
Cold Snaps in El Niño
The cold snap appears to be reaching its nadir this weekend for the western and northern interior. This morning's temperatures bottomed out in the -50s Fahrenheit for many locations from as far south as Nikolai up to the Kobuk River valley and eastward to the Yukon Flats. The coldest spots in Fairbanks-land dropped to near or just below -50°F, although the airport only made it to -40°.
With more than a month having passed since the solstice, afternoon sunshine allowed for temperatures to recover somewhat this afternoon, but less so in the northern interior, and Bettles saw a high temperature of -47°F. It's fairly late on the calendar for this: the latest date in Bettles with such a cold high temperature is February 3rd (1993).
This morning's 500mb chart from Environment Canada shows the mid-atmosphere situation, with a deep, cold trough over central and northern Alaska.
This afternoon's 500mb height of 4950m on the Fairbanks sounding is the lowest in 7 years.
I mentioned the other day (prompted by Rick Thoman's comment) that really significant cold snaps are relatively uncommon during El Niño winters. Here's a look at some data to illustrate that point: the chart below shows each winter's lowest weekly (7-day) mean temperature for Fairbanks and Bettles combined (i.e. the average of the two sites). The colors indicate El Niño or La Niña winters, as defined by the December-January Multivariate ENSO Index being above +0.5 or below -0.5 respectively.
It's clear that for the seven decades as a whole, La Niña winters have tended to produce colder cold spells, although admittedly the evidence is only compelling from about 1980 through 2010. In the 1950s, 60s, and 70s there were some nasty cold spells with El Niño, and in recent years La Niña hasn't produced anything like the cold that it used to.
The result is similar if we classify years based on the Oceanic Nino Index, which uses only Niño3.4 SSTs as an index of ENSO strength.
Either way, we find a difference of about 5-6°F on average between the coldest weeks in El Niño versus La Niña winters; but there is obviously a lot of variability between winters, and from decade to decade.
The disappearance of the most severe cold in recent decades is remarkable. Here's a chart showing all winters:
The current cold snap will break the sharp uptrend, but perhaps only marginally; we'll see.
The Fairbanks urban heat island is certainly a factor here, but the trend is only about 20% greater for Fairbanks than it is for Bettles (+1.8°F/decade vs +1.5°F/decade for the coldest weekly temperatures).
Saturday, March 4, 2023
February Regime
As noted in my last post, February was quite snowy again this year in Fairbanks, and it's worth following up on this. With 21.1" of snow, last month makes 5 of the last 7 Februarys with over 20", and all 7 have seen above-normal snow.
In the preceding 87 years (1930-2016) there were only 7 Februarys with 20" or more, so the probability of randomly getting 5 of 7 years above that mark is extremely small indeed (less than 0.00001, assuming no year-to-year correlation). Obviously this indicates that "something has changed"; the global circulation and the February weather patterns around Alaska have behaved differently in the last 7 years than in earlier decades.
Here's the average sea-level pressure anomaly for February in the last 7 years.
On average, SLP has been more than 10mb higher than normal over the mid-latitude North Pacific to the south of Alaska. That's a very large departure from normal, and it signifies a stronger than westerly component to the flow over southern Alaska. The map below shows the departure from normal of the wind vectors (speed and direction).
The more westerly flow regime is favorable for importing Pacific and Bering Sea moisture to interior Alaska, and the pattern also tends to set up a (cloud/snow-producing) frontal zone across southern Alaska. Here's the lower-atmosphere temperature anomaly: it has tended to be colder than normal in western Canada and northern Alaska, but warmer than normal across the northern Pacific.
The pattern is substantially similar to a typical La Niña winter pattern, except that the North Pacific ridge often extends more strongly to the northwest across the Bering Sea during La Niña. In contrast, recent Februarys have seen low pressure in the western Bering Sea and a ridge axis farther to the east over Alaska itself (see the SLP map above). This means that there has been far less cold for Alaska than you would expect during La Niña.
Of course, we have indeed seen a preponderance of La Niña in the past 7 winters; 4 of the 7 years had bona fide La Niña conditions in February. Winters 2018-19 and 2019-2020 were more El Niño-like (although not strongly so), and it may be no coincidence that the two recent Februarys with under 20" of snow in Fairbanks were those ones.
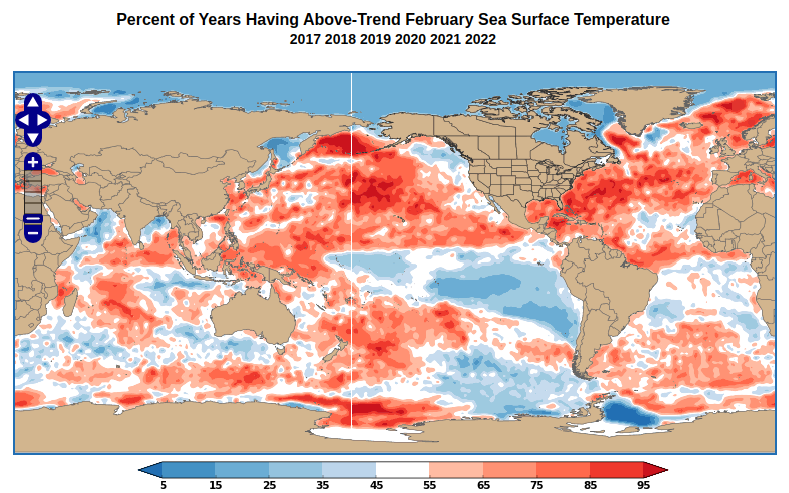
However, the recent state of affairs is not as simple as a recurring La Niña regime causing excess snow in Fairbanks; some of the strongest La Niña's of the past have been dry, not snowy, winters in Fairbanks. Compare the sea surface temperature maps below; the first shows the typical SST pattern for La Niña in February, and the second shows the pattern from 2017-2022. (The ERA5 data for February this year isn't available yet, but I've included an ERSSTv5 map for last month as well.)
What strikes me here is that recent Februarys have seen much more warmth in both the Bering Sea and the western Atlantic Ocean than is typical for La Niña. It seems clear that the western Bering Sea warmth is associated with the recurrent low pressure there - which again is not typical of La Niña - and both the flow trajectory and the excess of moisture (from excess evaporation) have favored abundant snowfall in Fairbanks.
Evidence of excess atmospheric moisture upstream of Fairbanks can be seen in the anomaly of precipitable water for the last 7 Februarys: it has been above normal over the Bering Sea.
As for the abundance of warmth in the western Atlantic, this has helped reinforce (and has been reinforced by) the U.S. East Coast ridge that is part and parcel of the continental-scale flow regime. Here's the global 500mb height anomaly for February in recent years.
The connection between the North Pacific ridge and the East Coast ridge is an example of a long-distance "teleconnection", and the pattern has been pronounced in recent years. It's not coincidental, then, that the southeastern U.S. has seen unusual February warmth for - you guessed it - the past 7 years, and this February was one of the warmest on record.
To illustrate, here's a scatterplot of Fairbanks February snowfall versus February temperature at my location in northeast Georgia. There has always been a relationship, with a snowy Fairbanks often corresponding to a warm Georgia, but the joint anomaly has been very striking in recent years.
When will the pattern change? It's impossible to say, of course, but next winter has a good chance of seeing El Niño, and so the North American pattern should be significantly different.
Monday, February 13, 2023
What Happened to La Niña?
A few days ago, reader Gary commented on the relatively warm winter that Alaska has had so far, and asked about the status of La Niña. It's worth considering this, because La Niña is still ongoing in the equatorial Pacific Ocean, and La Niña tends to produce cold winters in Alaska (but not always, of course).
The current La Niña - which is now waning and is likely to dissipate this spring - has been a strong one, and this is the third La Niña winter in a row. The chart below shows the Multivariate ENSO Index since 1950; the MEI is the single most comprehensive index we have to measure the behavior of La Niña and El Niño:
Neither of the two past winters was particularly cold for Alaska as a whole: only November was notably cold last winter, and February was the only month with significantly unusual cold in winter 2020-21. Both winters ended up close to the 1991-2020 average, judging by the November-March average for the state overall.
But this winter we've seen not just an absence of cold but a considerable degree of warmth, particularly in January. It was the 4th warmest January since 1990, and the 2nd warmest since 1950 for a La Niña winter (based on MEI data since 1950).
Here's a chart of November-January statewide average temperatures since 1950, with the ENSO classification indicated by colors. For the classification, I simply divided the Nov-Jan MEI index into equal thirds.
There are several remarkable things to notice here. First, this winter so far (the right-most blue marker) has indeed been much warmer than the average La Niña winter of the past 70 years, although winter 2000-2001 was much warmer still; it's not unprecedented for La Niña's cold signal to "fail" completely.
Second, the linear trend lines denote the changing "normal" for the three ENSO categories, and we see that this winter (through January) has been as warm as the typical El Niño winter would be in the current climate. (Note that last winter was cold for Nov-Jan, but warmth in March largely reversed that anomaly for the overall winter average.)
Third, it's very interesting to see that neutral ENSO winters seem to have warmed much less than either El Niño or La Niña winters. We see the same result in a chart for November-March (of course this winter is not yet plotted here):
According to this analysis, neutral ENSO winters are now just as "cold" as La Niña winters. Interestingly, there's also a suggestion that neutral ENSO winters used to be the warmest of the three categories, although the uncertainty is large on these linear regression estimates because of the small sample size in each category, and the large year-to-year variance.
The surprising difference in the neutral-ENSO trend is accentuated even more if we only use data since the 1976-77 Pacific climate shift, when Alaska winters suddenly warmed up in association with the PDO phase reversal. In this short and highly uncertain trend analysis (see below), the neutral-ENSO trend is negative, but that's clearly because the very warm winters of the late 1970s and the 1980s saw a lot of ENSO-neutral conditions. We would probably wish to avoid attributing the warmth back then to the neutral ENSO state, because the persistently positive PDO regime likely had more to do with it.
The temperature data from Fairbanks tell a very similar story: November-January this winter was as warm as a "typical" El Niño winter; winter 2000-2001 was much warmer still; and neutral-ENSO winters have warmed much less than either El Niño or La Niña winters.
Incidentally, it's interesting also to see the consistency between the independent trend estimates for La Niña versus El Niño winters. There's a hint that El Niño winters have warmed slightly more than La Niña winters, but there's not much in it.
Here are some other climate ranking maps for January: it was relatively wet for the eastern and northern parts of Alaska, significantly less windy than normal in much of the south and west, and cloudier than normal almost everywhere.
Sea-level pressure was below-normal across the Bering Sea and most of Alaska, which explains the relatively cloudy, damp, and warm weather. La Niña winters more typically see above-normal MSLP in the Bering Sea and Aleutians.
La Niña also more commonly brings low MSLP to the Arctic, and therefore a
positive AO phase, but the AO remained negative in January (although
much less so than in December). The enhanced north-south pressure
gradient produced above-normal winds for the Arctic coast: Utqiaġvik appears to have had one of its windiest Januarys on record.
Monday, December 19, 2022
Serious Cold
Last week I mentioned the big contrast in temperatures that always accompanies a major upper-level ridge, with warm southerly flow drawn up on the west side of the ridge axis, but cold northerly flow on the east side (in the northern hemisphere). La Niña tends to bring the cold side of the equation to much of Alaska, and that's exactly what we're seeing now, with - in this case - a really huge ridge ballooning north through the Bering Strait in the past couple of days.
Here's the mid-atmosphere 500mb height analysis as of 3am this morning, courtesy of Environment Canada:
A 500mb height of 5620m at 72°N is extreme for the time of year, and it's going even higher in the next few days, perhaps breaking the 1950-present record for the winter months over the East Siberian Sea. The regional record to beat was set in January 2011 - see Rick Thoman's comments in several posts from the time. (There's that 2010-2011 analog showing up again: strong La Niña, with very strong Arctic ridging/blocking that brought severe cold to the mid-latitudes, just as we're seeing this winter.)
Under clear skies and calm winds, the Arctic air mass has allowed temperatures to plummet in the eastern interior. Here are today's minimum temperatures in degrees Fahrenheit as of about 7pm (click to enlarge):
In the Fairbanks area, the North Pole 1N co-op station reported -50°F. Of course Chicken was the Alaskan cold spot: -57°F this morning, and a daily maximum of -50°F for yesterday. A daily high of -50°F is about normal for the coldest day of the winter in Chicken, but it nearly always happens in January; this is in fact the earliest in the winter that a daily high of -50°F has been observed in Chicken (data since winter 1996-97).
Saturday, June 11, 2022
Early Fire and May Climate Data
Last week I commented about the dampening effect of La Niña on Alaska's wildfire season, and that theory is being put to an early test only a week later. Extremely warm and dry weather in southwestern Alaska has produced an early and aggressive start to this year's fire activity, with statewide fire acreage jumping to over 300,000 acres today. This is more than burned in either of the last two years over the entire summer.
Rick Thoman has been posting lots of great information on Twitter, with a focus on the threatening East Fork Fire that has burned over 100,000 acres on tundra just to the northeast of the town of St Mary's on the lower Yukon. This is remarkably far down the Yukon for a large fire, and it's easily the largest fire on record for the Yukon-Kuskokwim delta region:
The East Fork wildfire near St. Mary's Friday AM analyzed at 71,320 acres (28,862ha) by @BLM_AFS, the largest tundra #wildfire on record in the Yukon-Kuskokwim region. Next largest is the 2020 Ingakslugwat Hills fire north of Newtok at 54,099 arces (21,893ha) #akwx @oliviaebertz pic.twitter.com/TfVw94SfDU
— Rick Thoman (@AlaskaWx) June 10, 2022
Rick also posted a nice satellite view of the smoke plumes yesterday afternoon: click to enlarge.
Very dry land surface conditions have developed over the past couple of months in southwestern Alaska, owing to a dry and warm spring. April was warm and dry relative to normal, and it's worth noting (I missed it at the time) that over 10,000 acres burned in April near Kwethluk and Bethel:
May was also very dry for southwestern Alaska; here are my usual NOAA and ERA5 precipitation rank maps:
Temperatures were above normal in the Y-K Delta region and from the Bering Sea coast to Alaska's south-central region.
Sunshine and wind were both above normal across the southwestern mainland in May, and the dewpoint was below normal:
The result: the month of May had the lowest soil moisture in at least 30 years (in May) for the Y-K Delta, according to the top subsurface model level in the ERA5 data:
And that's before the exceptional warmth so far this month: until today, every day so far in June has been at least 73°F in Bethel. It's easily the warmest start to the month on record, and with almost no rain to relieve the situation.
The analysts at the U.S. Drought Monitor agree that the situation is significantly abnormal over a wide area:
Does this portend a big fire year despite what I said in last week's post?
Not necessarily. Of 7 other years since 1995 that had burned over 100,000 acres by this date, only 3 of 7 ended well above normal for statewide fire acreage. The two years that were already ahead of this year (2002 and 2010) both ended up with over a million acres burned, but 2011 and 2014 both saw only minor fire activity after this date.
As for La Niña, it's interesting to note that there has been significant disruption to La Niña in the past several weeks, caused by vigorous atmospheric waves that have been traveling around the globe along the equator. La Niña has been weakened - probably temporarily, but circulation patterns have been affected in extratropical regions, and this could explain why the weather has been more or less opposite of the typical June-July La Niña pattern for southwestern Alaska. Let's hope we soon get back to business as usual.