Friday, October 29, 2021

Disappearing Halloween Snow

Rick Thoman pointed out today on Twitter that this Sunday will - in all likelihood - be the 5th Halloween in the past 6 years to have less than an inch of snow on the ground in Fairbanks.  For a span of 75 years - 1941 through 2015 - only one year managed the same feat.  (Incidentally, that year was 1962, which bears more than a passing resemblance to this year in terms of alignment of various aspects of the global climate system.  Interesting.)

The disappearance of Fairbanks snowcover at Halloween is consistent with a downward trend in October 31 snow depth that seems to have started more than two decades ago; it's been 24 years since more than 6 inches was on the ground, but prior to 2000 about a third of all years had at least that much snow.

Here's Rick's excellent graphic:


Total October snowfall in Fairbanks also shows the same kind of decline.  Before 2009 it was quite normal to have 10" or more of snowfall in October; this happened in nearly 50% of all years.  But amazingly it hasn't happened for the last 13 consecutive years.  Based on the 1930-2008 climate, and assuming each year is independent of the last, the chance of less than 10" happening 13 straight times is less than 1 in 1000.  So this appears to be a highly statistically significant change.


Interestingly the ERA5 reanalysis captures the preponderance of low snow accumulations in October over the last 12 years; the map below uses a 1951-2010 median as the baseline "normal".  According to this data, the anomaly has been most significant over the Bering Sea, but it extends across southern Alaska to the Canada's west coast and northwestern regions.


The lack of October snow does not principally reflect dry weather, at least not in the Bering Sea region; ERA5 actually shows more wet than dry weather in this area, and since 2009 Fairbanks has seen above-median liquid-equivalent precipitation in 5 of 13 years, including 4 very wet Octobers (2012, 2017, 2019, and this year).


Rising temperatures are a much more plausible explanation for the loss of snow; the ERA5 map below uses a 1951-2010 average for the climatological baseline.  In Fairbanks, all but 2 of the last 12 Octobers have been warmer than the 1930-2008 mean, and more than half have been over 5°F warmer than the old normal.


Alaska isn't the only place to have seen a paucity of October snow in the past decade or so.  Here's the ERA5 map for a global domain: note the similar low-snow signal from eastern Canada across the northern North Atlantic and in much of Russia.


Saturday, October 23, 2021

Changing Ice

A couple of items of follow-up today.  First, all semblance of similarity to the early cold of 1992 has long since been lost this autumn in Fairbanks, with above-normal temperatures persisting now for more than two weeks, and a near-record high of 48°F yesterday.  It was the highest temperature for more than a month, which in itself is quite remarkable at this time of year, when the seasonal normal is dropping so quickly.  There's been no meaningful drop in this year's daily mean temperatures since late September.


The warmth has pushed back freeze-up of rivers; the Tanana is mostly ice-free at Nenana, as is the Yukon River across the border at Dawson, and the Salcha shows plenty of open water (photo below from Thursday, courtesy of Twitter user NateoftheNorth).


Second topic: following up on my post last week on a very different facet of the cryosphere - Arctic sea ice - I proceeded to examine both the opening and closing dates of the Northeast Passage in the past two decades, and the chart below is the result of this effort.  This is based on the NSIDC sea ice index images, which show the estimated daily location of ice concentration above 15%.


The note for 2013 highlights the fact that there was well over a month of open passage to the north of Severnaya Zemlya, but the near-shore route adjacent to the mainland (Taymyr Peninsula) was closed for nearly the entire season.  The more northerly route is pretty far north (north of 80°N) and I'm unsure if this would be considered an open Northeast Passage, but I allowed it for the chart.

Besides the striking trend towards a more navigable route, it's interesting to see the difference between this year and last.  This is largely the result of contrasting weather patterns, with 2020 having exceptionally warm conditions across the Arctic Ocean, but summer 2021 being relatively (but not extremely) cool and cloudy.  Obviously the window for open navigation is sensitive to the details of where the ice is located, with Severnaya Zemlya being - as this year - the most common bottleneck; Arctic-wide sea ice was not that much higher this summer than in recent years.

Sunday, October 17, 2021

Sea Ice Update

It's been a while since I posted anything on Arctic sea ice, but it's worth looking back at the melt season now that freeze-up is well under way.  It was a relatively cool and cloudy summer with lower pressure than normal across the Arctic Ocean, and sea ice melt was somewhat reduced compared to the past decade or so.  Here's the September sea ice extent, courtesy of NSIDC: this year's seasonal ice minimum was notably higher than the lowest values of the modern era, but of course still much lower than earlier decades.

On a regional basis, sea ice melted out extremely early this year in the Laptev Sea, but the summer weather pattern - with an unusual trough of low pressure to the north of Alaska - allowed ice to last much longer than in recent years in the Chukchi and Beaufort Seas.  NSIDC's write-up also notes that last winter saw increased transport of old, thick ice into the Beaufort Sea, and that ice is resistant to summer melt.  Here's a paper on last winter's unusual ice transport.

Rick Thoman nicely illustrated the recovery in Chukchi Sea ice as follows:


It's also interesting to note that the Northeast Passage appears to have been open for only about five weeks this year, which is a huge change from last year.  Judging from daily ice extent images from NSIDC, August 22 - September 27 was the window in which there was an opening in the ice next to Russia's Taymyr Peninsula.  Last year the window for open navigation was approximately July 15 - October 29, or well over three months!

Looking back at recent years, the last time the Northeast Passage closed up as early as this year was 2013, and all other years since 2007 saw open water along the entire route into October.  2007 was the last year in which there was no opening all summer, again judging from the NSIDC images (which can be found here).

Here's my estimate of the closing dates for the Northeast Passage, i.e. the last date with an open route from the Atlantic to the Pacific near the coast of Russia, based on NSIDC sea ice extent (defined as ice concentration greater than 15%).

2021  Sep 27

2020  Oct 29

2019  Oct 16

2018  Oct 20

2017  Oct 5

2016  Oct 18

2015  Oct 14

2014  Oct 5

2013  Sep 27

2012  Oct 14

2011  Oct 10

2010  Oct 2

2009  Oct 9

2008  Oct 3


Monday, October 11, 2021

September Climate Anomalies

First, to follow up on the last post - the answer is no, the snow didn't survive in Fairbanks - at least not at the official snow monitoring site, which I believe is now at the university farm (location of the longest-running continuous climate record in Alaska).

Several days with daytime temperatures in the low 40s, and a lot of rain, doomed the early attempt at establishing snow cover.  The first 10 days of the month have now seen 1.28" of liquid-equivalent precipitation in Fairbanks, which is the 4th highest on record; and the top two spots are held by 2017 and 2019, so this is the 3rd time in 5 years with a very wet start to the month.

Looking back at September, here are the temperature and precipitation rank maps from NOAA/NCEI's climate division data: most of the state was in the lower tercile of the 1991-2020 distribution, and areas from Bristol Bay to south-central were much colder than normal.


Here's Rick Thoman's usual graphic showing the absolute temperature anomalies: note the remarkable -5.5°F anomaly at King Salmon.


And here's the ERA5 view of the month: it was yet another cloudy month in the northwest, but unlike during summer the winds were relatively light across western Alaska.


As an aside, I previously noted that the NCEI data seemed much too cold for the North Slope in July, but the value has been adjusted since then, and the latest result for July is much more reasonable - see below.  So it seems we should treat NCEI's preliminary monthly numbers with some caution.


Wednesday, October 6, 2021

Will The Snow Survive?

The heavy, wet snow that fell at the weekend left several inches on the ground in the Fairbanks area, which of course is unusual for the time of year.   Fewer than 1 in 5 years have snow on the ground at valley level in the first few days of October, although it doesn't take much of a memory to recall the remarkable late September snowfall in 2015.  Back then over 13" of snow fell, which is more in line with what happened this time at locations to the southeast of Fairbanks.

It's interesting to ask whether this very early snow cover will last through the winter.  In 2015 it didn't: it was all gone by the middle of October.  It's tough to keep a relatively shallow early snow cover, as the temperature in Fairbanks reaches at least 45°F after October 5 in most years, and 50°F or higher is not at all uncommon.  In fact, if this year's snow does last, it will be the second earliest onset of the winter snow pack on record (1930-present); 1992 holds the record of September 13, but that was a very extreme outlier.

If we look at years that had at least 3" of snow on the ground by October 5, we find that it disappeared 8 out of 13 times.  For 4" or 5" on the ground this early, the survival rate is about 50%, although the sample size is small.  However, if we look at years with at least 3" on the ground between October 6 and 10, the odds of it surviving are much higher: about 80%.

So from a statistical perspective it looks like there's now a decent chance the snow will last, but it's obviously highly contingent on the weather.  Above-normal temperatures of any magnitude will probably doom the early snow cover, and rain - which is in the forecast for the next couple of days - may also prove fatal.

Here's the afternoon river view at Nenana, with the relatively unusual situation of having ice (snow) on the ground but not on the river.  Most of the year has ice cover on both or neither, and typically April - and sometimes much of May - has ice only on the river.


Saturday, October 2, 2021

Major Snow Storm

--------------------------------------

Public Information Statement

National Weather Service Fairbanks AK

348 PM AKDT Sat Oct 2 2021

...Snow Continuing Through Sunday Across The Eastern Interior...

A strong low in the Northern Gulf of Alaska is causing heavy snow across the Interior south and east of Wickersham Dome. The snow started Friday afternoon, and by the time it tapers off Sunday afternoon storm totals of 6 to 12 inches can be expected, with 10-16 inches closer to the Alaska Range. There are winds gusting 25-40 mph through Alaska Range passes and along the Alaska Highway causing low visibility in blowing snow that will last through tonight.

As of Saturday afternoon, between 4 and 8 inches of snow have fallen across much of the Interior south and east of Wickersham Dome, with areas in the Alaska Range reporting up to 10 inches.

Another 3 to 6 inches of snow is expected through Sunday across most of the same area, with another 6 to 9 inches along the Eastern Alaska Range. The snow is expected to taper off Sunday afternoon north of the Alaska Range, and Sunday evening along the Alaska Range.

In Fairbanks, 5 inches of snow have fallen as of 3 PM Sat, with another 3 to 6 inches expected through Sunday.

From North Pole south to Salcha, 6 inches of snow have fallen as of Sat afternoon, with another 6 inches expected there through Sunday.

--------------------------------------

Splendid photos from the Salcha River by Twitter user nateofthenorth:


Thursday, September 30, 2021

Cold Deepens

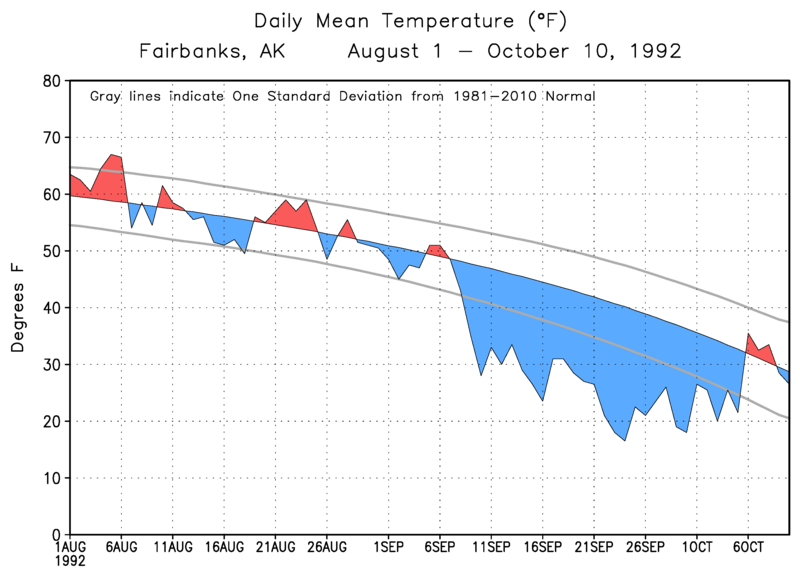
Faint echoes of September 1992 have been heard in the past week as cold has deepened over interior and southern Alaska, but despite the dramatic drop-off in temperatures, it really is only a shadow of the outrageous early cold that developed 29 years ago.  Here's a comparison of daily mean temperatures at Fairbanks:


Nevertheless, any comparison to 1992 is bound to fall short, and it's fair to say it has been notably cold for the time of year.  Yesterday Fairbanks failed to reach the freezing mark, and that's the first time a sub-freezing day has occurred in September since 1992.  In two recent years - 2015 and 2018 - it didn't happen until a full month later.

The week ending yesterday is also the coldest week in September since 1993 (not 1992), with a 7-day average temperature of 31.6°F in Fairbanks.  Judging from photos on Twitter, ice has formed on slow-moving sections of rivers.

The well-known interior cold spots of Chicken and Salcha (RAWS site) both saw their first 0°F readings on Tuesday.  Neither station was reporting in 1992, but for both sites this ties the earliest on record.

And here's a notable item from the north end of the Alaska Peninsula:


Here are the statewide temperature extremes this month: notice the expansion of the temperature range as cold develops over interior snow cover while southeastern maritime areas remain relatively mild.


Thursday, September 23, 2021

First Zero

I may start posting these NWS-Fairbanks information statements regularly, as they often provide nice summary tidbits, and those not on Twitter may not always see them.  (Note that the temperature later dropped to -4°F, -20°C, at Toolik this morning.)

--------------------------

Public Information Statement

National Weather Service Fairbanks AK

1207 AM AKDT Thu Sep 23 2021

...Fall Arrives In Northern Alaska With Below Zero Temperature...

The first day of fall, on Wednesday, was greeted by a temperature of 1 degree below zero at the Toolik Lake Field Station, on the North Slope of Alaska, just north of the Brooks Range. Toolik Lake was also reporting over 3 inches of snow.

--------------------------

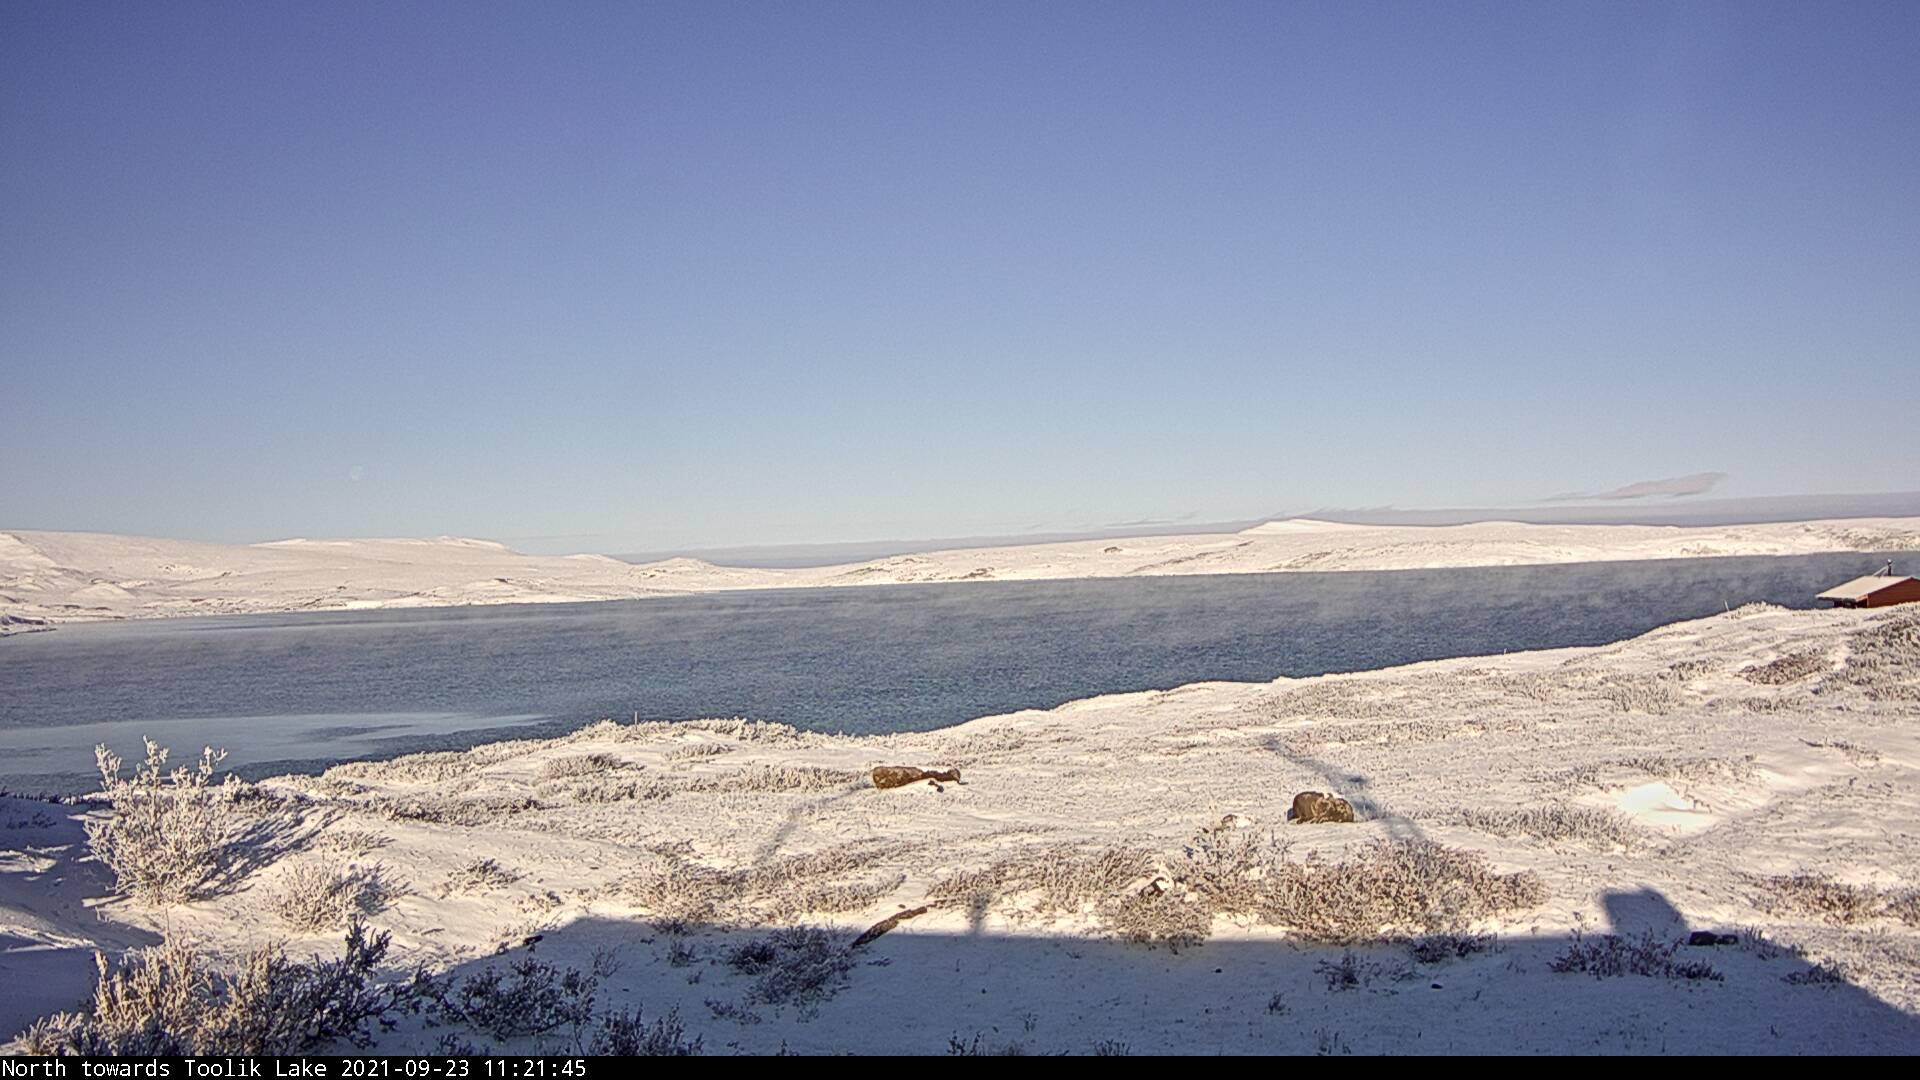
The current webcam view shows some steam fog over the lake, and what looks like a patch of newly formed ice.  What a beautiful scene!


Wednesday, September 22, 2021

Snow Totals

Eastern interior locations from the Tanana to Yukon valleys were the big winners in the early snowfall of the last couple of days, with as much as 9" reported in Tok.


According to the NWS, this morning's reported snow depth of 7" in Eagle is the highest on record for this early in the season, although Rick Thoman notes that the depth seems a bit too high for a 2-day accumulation of 7.5"; one would expect more compaction than that.

Here's a map of reported snow depths today across the southeastern quadrant of the interior.


And courtesy of Rick Thoman, snow cover is suddenly quite extensive, although it's unlikely to last in valley-level locations south of the Brooks Range.


Returning to the cold in Bettles, the high temperature on Monday was only 32°F, which is quite notable for so early in the season, although the rate of seasonal cooling is extremely rapid.  1992 and 1996 saw freezing days about a week earlier (September 14), and 2013 was also notable for early cold (32°F high on the 21st).  Typically it takes until about the first week of October to see a sub-freezing day in Bettles.


Monday, September 20, 2021

First Snow

The dramatic pace of seasonal change is making itself felt across interior Alaska today, with noon temperatures not far above freezing in many valley locations, and light snow showing up in some places.  A light accumulation was observed at UAF this morning, and it appears that a more significant snowfall is occurring just east of Fairbanks today.


Temperatures dropped into the single digits Fahrenheit in the Brooks Range this morning, including +3°F at Anaktuvuk Pass and +4°F at Toolik Lake.


Bettles is sitting at 27°F at 1pm, and it will be interesting to see if they make it above freezing today.  The earliest date in September that failed to do so was the 14th, in the great September cold snap of 1992.  There's no snow on the ground yet at Bettles, but it looks like Coldfoot has a modest snow cover already.


Saturday, September 18, 2021

Simulated Rainfall Extremes

A couple of months ago, I was involved in a discussion with several UAF climate scientists on the topic of "black swan" climate extremes for Alaska.  We saw the incredible heat wave unfold in late June across southern British Columbia and Washington state, and the question arose: can we estimate what kind of conditions would occur in Alaska if a similarly rare climate extreme occurred - whether in terms of heat, cold, or precipitation.  We're talking about truly rare extremes that shatter previous records by large margins.

One way to tackle the problem is to use simulated climate data from models, and so I've taken a look at rainfall data from a long history of simulations using NOAA's flagship GEFS ensemble model.  To help determine bias and skill in the model, NOAA has helpfully provided 20 years of retrospective forecasts, with 11 ensemble members initialized once per week in 2000-2019, and running out to 35 days in the future.  I used the portion of the forecasts for lead times greater than 10 days so that there's not much correlation between the 11 members, and this amounts to 20*52*11*25 days of synthetic climate, or about 785 years.

Based on all this data, here's the largest 24-hour precipitation total in the entire 785 years.  Note that the data is available at 6-hour increments, so this could be e.g. 6am-6am, or midnight-midnight, but peak 24-hour amounts would be a bit higher if hourly data were available.


The maximum is about 3.7" in Fairbanks, which is only slightly higher than the actual (historical) calendar-day maximum of 3.42" in August 1967 (3.28" at the Ag Farm).

Here's the largest 7-day total, with coincidentally again a very close match between the 785-year simulated maximum (6.1") and the August 1967 values (6.1" the airport, 6.2" at the farm).  Of course the GEFS model is not simulating the 1967 flood, it is simply creating lots of scenarios for the 2000-2019 climate.


With 785 years of synthetic climate, we can estimate a 100-year recurrence value by taking the 8th highest value.  Here's a comparison with the historical period-of-record maxima for 2-day and 7-day totals at four climate sites that have approximately 100 years of observed data.

2-dayGEFSObserved
Fairbanks3.4"4.3"
Utqiaġvik1.7"1.4"
Nome4.2"3.0"
Yakutat12.5"13.7"

7-dayGEFSObserved
Fairbanks5.1"6.1"
Utqiaġvik2.3"1.9"
Nome6.3"5.3"
Yakutat18.5"20.6"

All in all, the comparison is quite favorable, suggesting that the model's representation of precipitation extremes may be fairly realistic.  This then suggests that perhaps the 785-year maximum values may not be too far off what we might expect in the current (recent) climate for a return interval of about 800 years.

In turn, we might conclude that the August 1967 flood in Fairbanks may well have been something close to a 1000-year flood.  The 2-day and 7-day GEFS 785-year maxima are 4.7" and 6.1" respectively, compared to 4.3" and 6.1" for the observed period of record.

Interestingly, the NOAA precipitation atlas shows 500-year recurrence values of 5.3" and 6.9" for 2-day and 7-day totals in Fairbanks, which represents somewhat higher extreme values than the GEFS data shows.

Next up - I hope to look at extreme maximum and minimum temperatures in the GEFS model data.  What would a "black swan" heat wave look like in today's climate?  Stay tuned for an answer.

Sunday, September 12, 2021

August and Summer Climate Anomalies

Time continues to elude me for more frequent posts, but here's a look back at statewide climate anomalies during August and for the summer as a whole.

First, the NCEI climate division data indicate that August was the coolest summer month - and the coolest relative to normal - since August 2015.  The statewide average temperature of 49.4°F was about 1°F below the 1991-2020 normal, but would have been slightly above normal prior to the 1980s.  Precipitation was significantly above normal statewide, but unlike June and July the wet anomaly was across the interior and southeast, not along the west coast.


Here's the same view from the ERA5 reanalysis:


And here are Rick Thoman's excellent station-based graphics for comparison:


This month there isn't a major discrepancy between NCEI and ERA5 for the North Slope (see last month's post for discussion), and the NCEI numbers for July have been revised.  The updated map shows a much warmer July for the North Slope, although still not as warm as ERA5:


The maps below show the ERA5 ranks for several variables for the summer as a whole.  The big story is the excessively cloudy and wet conditions in much of western Alaska, although it wasn't terribly cool compared to the long-term normal.  The pattern was caused by a very persistent trough that was stuck between a pair of high pressure ridges over Siberia and over southwestern Canada and the western lower 48.