Showing posts with label Extremes. Show all posts

Tuesday, March 3, 2026

Statewide Cold

The widespread cold of the last week in Alaska has been really exceptional for this late in the winter.  Only a quick glance at UAF's statewide temperature index is needed to confirm this - see the chart below.  The index has been nearly pegged at the bottom of the scale since last Wednesday.

Recall that the index scale is designed to indicate the departure from normal in terms of frequency, so an index value near -10 corresponds to near-record cold for the time of year (compared to the 1991-2020 climate).

The calculation behind the UAF index is actually the average standardized temperature anomaly across 25 observing sites, taking into account the reduced climatological variance at more maritime locations and the greater variance in the interior.  Last Friday (Feb 27), the average anomaly was 3.1 standard deviations below normal, which is the lowest daily value since the remarkable cold snap of April 2021.  Prior to that, the only dates in the past 20 years with such anomalous statewide cold were in April and May 2013 - the year of the record late breakup at Nenana.

If we only look at December through February, it's interesting to note that only ONE other event since 1991 produced a daily statewide anomaly below -3 SD, and that was early February 1999.  The cold back in December and early January this winter didn't reach anywhere near the same intensity, peaking at only 2.3 SD below normal on January 3 (the persistence of the cold was a more unusual aspect on a statewide basis).

Therefore in the context of normal Alaska climate at the end of February, the last week has been very extreme, a rare cold outlier.

Fairbanks exemplifies this: the low temperature of -49°F on Sunday was the coldest in March since 1911, and it tied the monthly record for the 1930-present era.  It's also the first time since 1932 that 5 consecutive nights have dropped below -45°F after mid-February.  In fact, until this winter such a string of cold nights hadn't happened at all since the New Year's cold snap of 1999-2000.

More on this winter's achievements in Fairbanks in a subsequent post.


Thursday, January 8, 2026

More Snow and Cold

Back on December 18, I commented that the extreme cold then affecting northwestern Canada and far eastern Alaska looked likely to shift westward in the coming weeks, and that trend has played out nicely.  Not only had Fairbanks "not seen the worst of it yet", but severe cold has now developed in southwestern and south-central Alaska.

This morning was remarkably cold for many locations across the south and southwest; here's a selection of minimum temperatures since midnight last night (click to enlarge):


The -33°F in Bethel and the -12°F in Homer are both the coldest since 2012, and the astonishing -35°F in Kenai is the coldest since February 1999.  Today's high temperature in Homer has been only +1°F, which is also the lowest since 1999.

Anchorage airport (-17°F this morning) was colder (-21°F) in 2024, but the high temperature so far today is only -6°F.  January 7, 2009 was the only day this century with a colder maximum temperature (-9°F).

As for snowfall, Anchorage received a hefty dump on Monday and Tuesday this week, with 19 inches in the two days.  This is the highest 2-day snowfall since March 2002, and the 5th highest on record (data back to 1953).  It's also a record for highest 2-day snowfall in January, the previous record being just 2 years ago; prior to that the greatest 2-day total in January was only 13.7" (in 1987).

The combination of cold and snow in the past week is extremely anomalous for Anchorage.  For instance, the temperature rose to only 18°F during the snow storm earlier this week, and that makes it the largest 2-day snow with a 2-day high temperature below 20°F; the previous was 16.6" with a high of 14°F, again in January of 2024.

Here's a scatterplot of weekly temperature and snowfall for Anchorage in winter; I've highlighted the latest week and the very analogous week in 2024.


Anchorage has had weeks in the past with either more snow or lower temperatures, but the combination of cold and snow right now is virtually outside the bounds of the historical climate, just as it was 2 years ago.

The interesting thing about the 2024/2026 similarity is that 2023-24 was a strong El Niño winter, but this winter we're in a La Niña.  As I've commented before, this winter resembles a "traditional" La Niña for Alaska, whereas 2023-24 was quite atypical for El Niño.

CPC's latest 6-10 day forecast indicates that the cold is likely to continue shifting westward in the coming days, and Southeast will likely continue to warm up as the flow orientation changes.  There's a lot of uncertainty after the middle of the month, however, and I wouldn't be at all surprised to see a new round of cold across northwestern Canada for the second half of January.


Sunday, January 4, 2026

Why So Cold?

First, before discussing again the extreme interior cold, I would be remiss not to mention the remarkable snowfall in northern Southeast Alaska during the final days of December.  Driven by a persistent influx of moisture aloft, and a very cold air mass locked in at the surface by high pressure to the north, extreme snow accumulations occurred from Juneau northward.  Juneau airport measured a snow depth of 50 inches on the 31st, easily the highest on record (data back to 1949).

Reported multi-day totals in late December were widely near or above 40" at sea-level locations: click to enlarge the following.


Rick Thoman has lots more detail in his post on the event:

https://alaskaclimate.substack.com/p/southeast-alaska-extreme-snowfall


Now back to the headline topic: the generational cold snap that will come to at least a temporary end tomorrow for the central and eastern interior.  Yesterday's high temperature of -44°F in Fairbanks, and the daily mean temperature of -46.5°F, were the lowest values since New Year's Eve 1999; it has been 26 years since this intensity of cold occurred in Fairbanks.  Today's high temperature may be as low as -46°F, the coldest since December 13, 1977.  [Update: it was.]

Here's another remarkable statistic: the 9 straight days (and counting) with a low temperature of -46°F or lower hasn't occurred since December 1975 in Fairbanks.  If it's still -46°F at midnight tonight, we'll have to look back to December 1961 to find an equally long streak of 10 such days.  [Update: the streak reached 10 days.]

Of course, there have been other harsh cold spells since 1975, but none with quite the sustained intensity of this one.  January 1989 is top of the list, with 12 days having lows below -45°F, but the streak was broken by one slightly milder day in the middle (-40°).  The New Year's cold snap of 1999-2000 saw 7 days with -45°F or lower; and early January 2009 produced 8 such days.

What do all these cold snaps have in common (1961, 1975, 1989, 1999, 2009)?  Like this winter, all occurred during La Niña in the tropical Pacific.  La Niña hasn't always produced extreme cold in Alaska, especially in recent years, but extreme cold is much less likely without it.

The more immediate cause of the astonishing cold spell is a sustained confluence of the ingredients that are required for deep cold in interior Alaska, i.e. a cold air mass, clear skies, minimal solar heating, and calm winds.

The first ingredient is the starting point: the circulation pattern has persistently transported cold air from the north and northwest into Alaska, and this pattern has involved a ridge (high pressure) over the Bering Sea and a trough (low pressure) over eastern Alaska and northwestern Canada.

Here are a couple of simple animations to illustrate the flow pattern in the last week: 500mb height (i.e. mid-atmosphere pressure) in the top animation, and 850mb temperature anomaly (about 4000 feet above sea level) in the lower.  Notice the persistent ridge over the Aleutians and Bering Sea, with northerly or northwesterly flow over central Alaska.


The following figure shows the resulting temperatures in and above Fairbanks: the black line shows 850mb temperature, and the blue line shows surface temperature.


The feature to notice here is that while temperatures aloft (850mb) have certainly been cold in the past 10 days, they haven't been that much colder than earlier in December; but surface temperatures have bottomed out, reflecting a strong and sustained temperature inversion.  This occurs when heat energy is persistently lost to space under clear skies (with no real solar heating by day), and when calm winds prevent less-cold air aloft from mixing with the severely cold surface layer.  Yesterday the Fairbanks airport reported zero wind for well over 24 hours, and the sky was clear above the ground-level ice fog, so there was nothing to disturb the cooling process or provide a warming influence.

This exact confluence of circumstances is obviously rare, particularly in terms of the longevity of the event.  And thinking in terms of the ingredients for cold, it seems the key aspect that has been especially unusual and has allowed this event to become so severe is the absence of wind since December 27.  The cold air aloft has not been particularly unusual or extreme; clear skies are not especially rare in Fairbanks; but typically the active jet stream pattern that brings deep cold to Alaska also tends to produce significant pressure gradients across the state, leading to episodes of wind that preclude or break up a strong inversion.  In other words, I suggest that prolonged calm is unusual when the circulation pattern favors cold.  An example (admittedly extreme) of a more typical style of cold was the northerly blast about a month ago:

https://ak-wx.blogspot.com/2025/12/cold-outbreak.html

It will be worth digging into this idea further in a future post: what distinguishes a "normal" cold pattern from one that includes strong inversions and therefore severe valley-level cold?  And how did the pattern manage to persist so long in this case?

These and other questions will be fuel for fruitful comment once all the data is available for a full post-mortem.

Friday, September 12, 2025

August 1974

Here's a quick follow-up on the question I posed a few days ago: has anywhere in Alaska ever previously observed a temperature rebound to high summer warmth/heat after a really severe early autumn freeze (e.g. less than 20°F)?  This recently happened at Chicken: they dropped to 14°F on August 30, but rebounded to 80°F only 5 days later.

I sent the question over to former blog contributors Rick Thoman and Brian Brettschneider, both of whom have encyclopedic knowledge of Alaska's climate history.  Among the various candidate events they proposed, here's one that looks legitimate and was even more extreme than the recent Chicken temperature swing: in August 1974, the Mile 41 Steese co-op site reported a low of 16°F on the 22nd, followed by a high of 85°F on the 30th.  That's a rebound of 69°F, exceeding the recent 66°F change in Chicken.

Here's a chart of the data, courtesy of xmACIS2:


There's no doubt the freeze was severe in parts of the interior; the 17°F in Allakaket was the earliest date on record for a low below 20°F (data from 1908 through 1982).  At Bettles the 22°F still stands as the earliest below 25°F, and in the Fairbanks area there was a 22°F at North Pole (only 1°F shy of the record minimum for August).  Here are maps of low temperatures reported on the 22nd and 23rd (click to enlarge; the Mile 41 Steese site is in the middle of the maps, just to the north of Fairbanks):


The heat wave less than 10 days later was the real deal too; Fairbanks airport reached 83°F, and the university farm reached 84°F; both stand as the second latest on record for such warmth (after early September 1957).  Here are the regional maxima on August 30 and 31:


The sequence of mid-atmosphere circulation anomalies is quite interesting: a cold upper-level low dropped into eastern Alaska from northwestern Canada, but as it swung back into Canada, a strong ridge developed in its place.


The recent event at Chicken was different: the severe freeze was more localized, being a "Chicken special" in terms of how extremely cold it was in the valley.  The cold air mass wasn't all that extreme for the time of year (see my post here).  Here's the map sequence:


Thursday, January 30, 2025

Storm Notes

Rick Thoman posted a comprehensive write-up of the very warm and stormy weather this month, and I'll add some more notes below.  But first it's worth noting the dramatic change since the weekend: this morning's cold was impressive across the western and northwestern interior.  The temperature dropped below -50°F at quite a number of locations generally near the Koyukuk River valley, and even Selawik in the northwest reached -49°F.  Click to enlarge:


Looking back at the weekend warmth, Fairbanks was continuously above freezing from 7am on Friday through 8pm on Sunday, i.e. 61 hours, and this is certainly the longest such stretch recorded in January - only one other day (January 15, 1981) had a daily minimum temperature above freezing.  No such days have been recorded in February, and the only ones in December occurred during the great chinook/thaw of early December 1934.  The recent warmth can't quite compare to that historic event for overall warmth (highs in the 50s back then), but there are no other events in the depths of winter that have produced the duration of thaw seen in Fairbanks over the weekend.

The historic nature of the warmth was also illustrated by 43°F at Tanana, a new record for the month of January (120 years of data!), and 49°F at Tok.  The situation at Tok was truly record-shattering, with a low of 39°F on Sunday; this means the daily mean temperature was 44°F, a full 6°F warmer than any other day in December through February, with data back to the 1950s.

The sustained flow of moisture-laden air from the southwest produced prodigious precipitation in many places.  The map below shows estimated 7-day totals in terms of liquid equivalent.  The SNOTEL instrument at McGrath reported 3.8" of precipitation, which far exceeds the record for 3-day precipitation total in winter (2.10" in 1990, data back to 1939).  Near Talkeetna, 3-day totals of 4-5" were measured at relatively low elevation, and of course much more in the mountains.


Up on the southern slopes of the Brooks Range, snowfall was very heavy - in Wiseman, for example, where snow depth is just about at a record level for the time of year.


Here's a map of reported snow depth today, courtesy of the NWS:


One more aspect that I noticed: as cold moved into northwestern Alaska on Sunday, and Fairbanks remained in a thaw, the difference in daily mean temperature between Fairbanks and Kotzebue reached +46°F, and this is also a record for the time of year.  Typically of course Fairbanks is colder in January, and in the past such a large positive temperature difference has only occurred on rare occasions in late winter through spring.


We'll be able to do more analysis on the weekend's historical context when the ERA5 data is available in a couple more days (I'm particularly interested in the moisture content/precipitable water).


Wednesday, February 21, 2024

More Context for Cold

Another round of downslope/chinook warming brought another widespread thaw to the Tanana River valley and Fairbanks-land yesterday.  Temperatures above 40°F were widespread, including 45°F at Fairbanks airport, the highest February temperature in 20 years.  The year-to-date average temperature in Fairbanks is now only 2.2°F below normal.

Looking back again at the late January and early February cold snap, I was curious to see how the lower atmosphere (not surface) temperatures compared to past cold spells on various time scales.  However, with NWS weather balloons no longer going up during severe cold, there's some missing data for the recent event; so I extracted data from the ERA5 reanalysis.  I looked at Fairbanks 850mb temperatures and 1000-500mb thickness, with the latter being an excellent measure of the average temperature of the lower half of the atmosphere.

Here's the annual (winter) minimum for 3-day average 1000-500mb thickness:


On this time scale, the recent event was one of the coldest since 2000, but it was nowhere near as cold as the more extreme events of earlier decades.  The complete absence of seriously cold events after 2000 is quite remarkable, and suggests that the cold tail of the distribution has been dramatically curtailed since then.

Below is another perspective, showing annual minimum values of 3-day 850mb temperature (y-axis) versus 1000-500mb thickness (x-axis).  The values are quite highly correlated, of course, but there's some variability in the extent to which cold is concentrated at lower atmosphere levels like 850mb.  On a 3-day basis, the recent event was relatively less unusual in terms of 850mb temperature, with several other events being colder in recent years.


The 7-day and 14-day charts below show quite similar findings on these time scales, with the recent event being a bit more anomalous overall on a 14-day basis, as I noted before; but it was still not in the least unusual compared to earlier decades.


The two "granddaddy" cold spells of 1989 and 1999 stand out clearly here; those two events were much more extreme than anything in recent years, and also worse than anything that happened in the otherwise colder 1950s, 60s, and 70s.


Finally, it's interesting to observe that two quite extreme cold spells occurred in the last 20 years when we look at a 30-day average: late February and early/mid March of 2007, and January of 2012.


I hadn't previously realized how anomalous that 2007 event was, but in fact ERA5 shows the event having the lowest 30-day average temperature since 1950, by both metrics (thickness and 850mb temp above Fairbanks).  Given that it was so late in the winter, the surface temperatures were nowhere near as low as they would have been a few weeks earlier; but nevertheless March 2007 was the second coldest on record in Fairbanks, and 27 of 31 days had a low of -10°F or lower (the highest such number for the month).

Here's a look at the 500mb height pattern for the 30-day period: what a classic!


The 500mb height anomaly:


And the 850mb temperature anomaly, according to the older (but still basically reliable) NCEP reanalysis:


Saturday, August 26, 2023

Copious Moisture

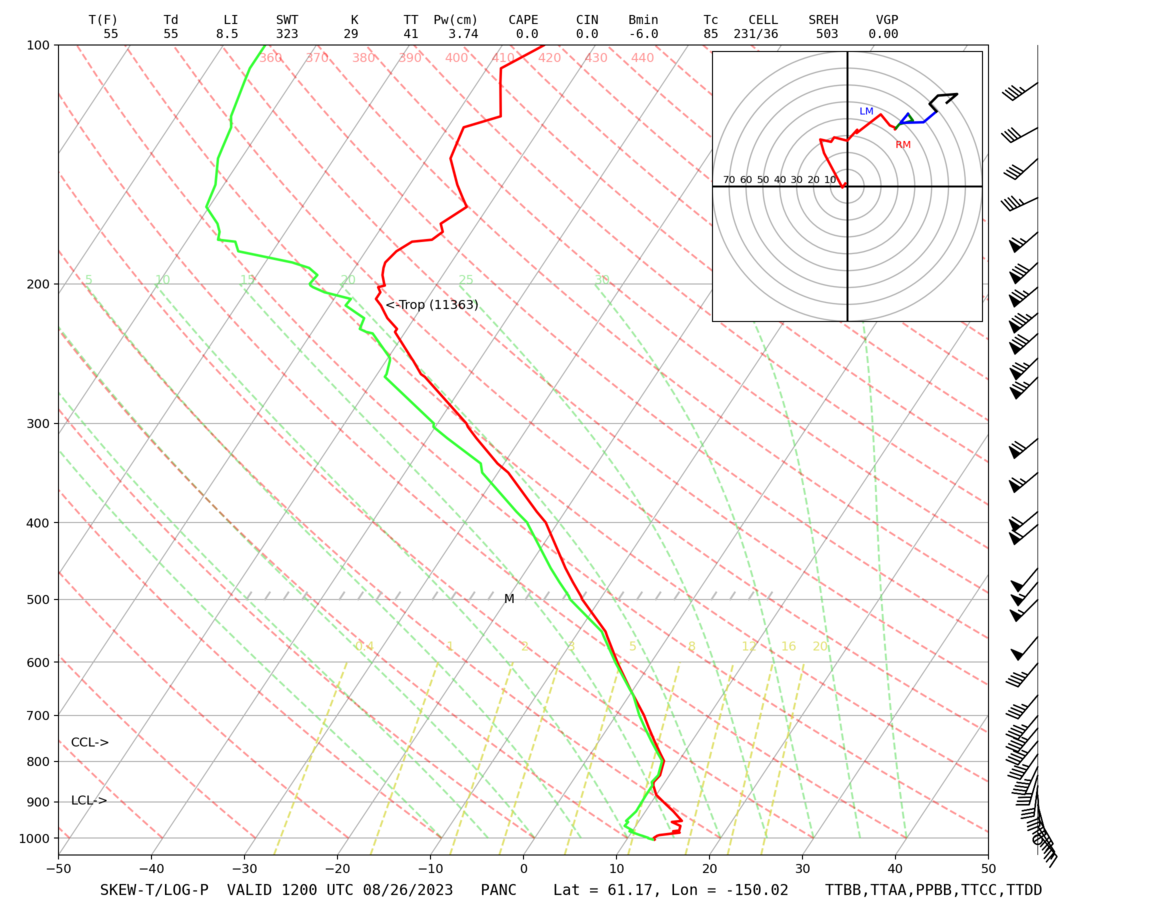
Flood watches are in effect from the Alaska Range eastward to the Canadian border, as a strong storm system drops moisture from a southwesterly flow originating in the tropics.  Here's a surface analysis from 4am today: note the storm tracking into southwestern Alaska from the central North Pacific (click to enlarge):


This morning's sounding from Anchorage measured nearly 1.5" of precipitable water (total vertical water content), which is extremely high by historical standards.  Here's the sounding: note the very deep saturation (dewpoint nearly equal to temperature) and strong southwest winds through most of the column.


Yesterday afternoon's sounding at Kodiak had even a bit more moisture, as is typical.


The highest precipitable water (PW) ever recorded by an Alaska sounding was 1.90" out at Shemya, on the other side of the Date Line, last August.  This is according to the IGRA database, which calculates PW from the surface up to the mid-atmosphere level of 500mb (the air above that level typically holds very little moisture because of its low temperature and pressure).  The western Aleutians are relatively far south, at less than 53°N latitude, and are often exposed to typhoon remnants with high moisture levels.

Excluding data from Shemya, Cold Bay holds the record for highest PW: 1.75" in July 2016.  I'm ignoring data from before 1960 because of low confidence in the measurements.

It's interesting to look at the history of annual maximum PW for each of Alaska's 14 currently-operational sounding sites.  There's a clear trend towards higher annual extremes at the northernmost sites, as we might expect with amplified Arctic warming.  (Note that the charts below use only June-September data so that I could require less than 10% of days missing in each year plotted.  Virtually all of the annual maxima occur in June-September.)


Sites farther south don't show a pronounced trend, but it's interesting to see that the mid-August 2019 rain event involved the all-time record PW at Anchorage and Bethel, and second-highest at Fairbanks:


Results for Cold Bay and Kodiak:


Yakutat and Annette Island both set new post-1960 PW records in late July last year, and the data from Annette shows very high PW in both 2021 and 2022.  This is very likely related to extreme North Pacific warmth in both summers, leading to higher moisture content in the air masses coming off the ocean.