Showing posts with label Heavy Rain. Show all posts

Tuesday, February 10, 2026

Alaska Landslide Inventory

Back in November a study was published that looked at historical news reports to create a new inventory of landslides in Alaska dating back to 1883.  Many other inventories have been produced over the years for specific purposes, but this approach focuses on the human exposure to landslides.

https://link.springer.com/article/10.1007/s10346-025-02663-z

As one would expect from increased population and better reporting, the number of reported landslides has increased tremendously over time, although the number of landslide-caused fatalities has not increased (largely because of the 1936 Juneau landslide).   The authors argue that a major part of the increase in landslide numbers is related to warming of the climate, which is hypothesized to cause a higher frequency of freeze-thaw events, rain-on-snow events, and rainfall extremes.

Extreme rainfall events in mid-high latitude areas are often produced by "atmospheric rivers", and there's a lot of interest among climate scientists in historical and future trends in these events.  To cite one example, the following study indicates that mid-latitude atmospheric rivers have become more frequent in Northern Hemisphere winter (as defined by moisture transport in the ERA5 reanalysis data).

https://www.nature.com/articles/s41612-025-01191-w

The following figure from the paper (click to enlarge) shows a region of increased frequency in the Gulf of Alaska, adjacent to landslide-prone Southeast Alaska.


Extreme precipitation events have increased widely across southern and southeastern Alaska, according to this data:


Just for fun, I pulled out the ERA5 precipitation amounts for each landslide identified by Darrow and Jacobs as having been triggered by excessive rain.  The chart below shows the rain excess above normal for the 7 days ending on the landslide date, at the ERA5 grid cell closest to the landslide location.


Of course, ERA5 is thoroughly incapable of reproducing local rainfall variations in complex terrain, which is no doubt a critical factor in many cases, so this analysis is very crude.  Nevertheless, it's mildly interesting that the fraction of events with a rain excess above +4 inches more than doubled from pre-1990 (10%) to post-1990 (22%).

One other comment - the increase in atmospheric river events near southern Alaska in recent decades is related to a greater frequency and persistence of La Niña-like (and negative PDO-like) anomalies in the Pacific, with increased warming in the tropical West Pacific:

https://www.science.org/doi/epdf/10.1126/sciadv.adq0604


Friday, August 22, 2025

Wet Forecast

The upcoming wet pattern is coming into better focus in the latest model forecasts, and indeed it looks very wet from southwestern Alaska across the western interior to the central Brooks Range.  Both the traditional and AI-based ECMWF models are showing widespread amounts above 3-4 inches in the next 10-15 days, with higher amounts locally.


The strong west-east gradient across the interior reflects the fact that the flow will turn more southerly by the middle of next week, shutting off big rain potential for locations downwind of the Alaska Range; but lots of moisture will continue to flow northward across western Alaska.  Here's a sequence of 500mb maps at 48-hour intervals beginning Saturday afternoon.


I picked out Kobuk as a location to illustrate the potential for very persistent rain that may eventually cause flooding issues - see below (note especially the two ECMWF models in the top panels).  However, the NWS notes that most rivers in the Koyukuk and Kobuk basins currently have low flow, so it won't be a problem immediately.


Tuesday, August 19, 2025

Looking Wet

Higher elevations of the Brooks Range had a taste of wintry weather this morning, with snow falling and accumulating for some hours.  Here's a webcam view from Anaktuvuk Pass, which saw about 8 hours of snowfall with temperatures near or just below freezing.


Snow isn't on the horizon just yet farther south, but rain most definitely is - and probably a lot of it.  The figure below shows one perspective based on ensemble forecasts from 4 models, including the new AIFS ensemble, which I mentioned the other day.  The black line shows the median predicted accumulation of precipitation in Fairbanks over the next 15 days, and the red and blue lines indicate the 75th and 25th percentile of each model's ensemble (i.e. a range of scenarios).  All 4 models show median expectations above 2 inches, with most of it falling around Sunday through Tuesday.


Ensemble-mean maps from the ECMWF (IFS) and AIFS systems show widespread amounts of 2-3" or more across much of the interior (although not in the east).  For reference, Fairbanks averages 2" for the whole month of August.


Here's the upper-level pattern responsible: as is typical in these events, strong west-southwesterly flow caused by a strong north-south pressure gradient.  Let's hope the moisture influx isn't too extreme.


Thursday, July 25, 2024

Extreme Weather in McGrath

The heatwave is on the way out, and Fairbanks didn't reach 90°F after all, but McGrath did - and it's a much more unusual event down there.  McGrath tends to have a more maritime influence, being closer to the sea and to the west of the Alaska Range.

With data back to 1941, McGrath has only reached 90°F on 5 days: once in 1969, on 3 consecutive days in 2013 (reaching an amazing 94°F), and once in 2019.  All were in June.  However, July and August have both seen 89°F, most recently on July 8, 2019.

To dispel doubts about the accuracy of yesterday's measurement, the AWOS instruments measured 88°F upstream (on the Kuskokwim River) at Nikolai and 86/87°F downstream at Sleetmute and Aniak.  As usual, RAWS thermometers in the area were higher, but they should be disregarded.

However, the heat is only half the story.  Shortly after the temperature peaked at 6pm, a very intense rain shower developed, dropping over an inch of rain in a very short time.  Brian Brettschneider notes that the rain rates exceeded the estimated threshold for a 1000-year recurrence interval!  Here are the precipitation frequency intervals from NOAA's Atlas 14 (click to enlarge):


Between 7:23 and 7:53pm, the ASOS reported 0.78" of rain (compare to 0.73" for a 30-minute event with a 1000-year recurrence interval), and 1.22" fell in 1 hour 24 minutes.

The notion of return interval is based on historical statistics and the assumption of a stable climate, which is of course never quite true, and we do expect more frequent heavy precipitation events in a warming climate with more atmospheric water content.  Nevertheless, this was clearly an extremely rare event for McGrath.

Putting the two aspects together, the combination of rare heat and rare heavy rainfall was obviously way outside the historical climate record for McGrath.  For instance, the warmest day in the past 84 years with a daily precipitation total of 1" or higher was only 72°F.  There have only been 3 days with a high temperature above 80°F and a daily rainfall above 0.5" (most recently - again - in 2019).

Thursday, July 18, 2024

Weather Notes

Large parts of Alaska have been much wetter than normal recently; here's a map of estimated 14-day precipitation totals (NOAA data) and the "percent of normal" (click to enlarge):


Several longstanding climate observing sites saw near-record rainfall over the weekend, including:

Bethel 1.98" on Friday-Sunday: the highest 3-day rainfall total in the month of July since 1955.

Anchorage  2.28" on Saturday-Sunday: the second highest 2-day total in the month of July; only 2001 had more (July 4-5).

Sitka  2.35" on Saturday, the highest calendar day total in July since 1948.

Of course all these numbers would be less notable in August, when heavy rain storms are less rare.

Wet and unsettled weather is common across southern Alaska in summer when the PDO (Pacific Decadal Oscillation) is strongly negative, as it is now.  Here's a map showing the percent of years with above-normal sea-level pressure in summers with a bottom-10 PDO index since 1950:


And the PDO is certainly entrenched in the negative phase: here's the daily index for the last several years.


Sea surface temperatures are much lower than normal in the eastern Bering Sea, which is both cause and effect of the atmospheric trough (low pressure) that is tending to recur in that area.


The weekend rainstorm was produced by a strong trough over that very location; here's the 500mb chart from 4pm AKDT on Saturday afternoon (click to enlarge):


The deep, strong southerly flow into south-central Alaska is amply illustrated on the 4pm balloon sounding from Anchorage: observe all the wind barbs pointed out of the south on the right side of the profile.


Also notice the very high freezing level - over 11,500 feet above sea level - and the high water content (precipitable water) of well over an inch (PW=3.02cm).  No wonder it rained a lot.

The combination of cloud, rain, and a chilly ocean nearby also produced unusually low daytime temperatures: Anchorage and Bethel haven't seen back-to-back days with such low daily maximum temperatures in July since 1970 (54-55°F in Anchorage) and 1971 (48-49°F in Bethel).  Guess what: the PDO was significantly negative back then too.


Monday, December 27, 2021

Historic Winter Rain

In the recorded history of Alaska climate, January 1937 has often stood out to me as an amazing extreme of winter precipitation in Fairbanks.  In that month, 6.7" of liquid-equivalent precipitation fell, making it by far the wettest winter month on record, and one of the wettest calendar months for any time of year.  An onslaught of both rain and snow occurred in two waves that month, with the second round dropping 3.2" of precipitation in 3 days.

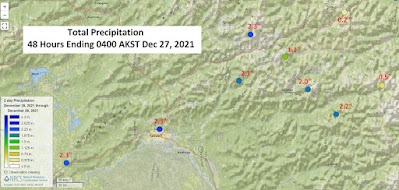
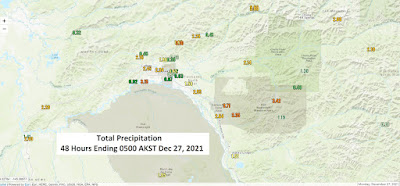
Prior to the events of the last two days, the January 1937 outcome was almost unimaginable, but remarkably after 85 years we have now seen something of a similar order of magnitude.  There will be much to write about, but for now the 48-hour precipitation totals speak for themselves - see below, and click to enlarge.  If only one or two sites had reported totals like this, they would have been dismissed out of hand, with an assumption of instrument malfunction; but it seems to me that the consistency between ASOS and SNOTEL tipping buckets as well as the high-quality CRN weighing gauge (3.10" in the bottom image below) provide a strong case for the extraordinarily large amounts being real.

More blog posts to come, and I invite readers to comment with any and all personal observations, measurements, or experiences from the storm.


Tuesday, July 27, 2021

Heavy Rain

I'm on the road and unable to do justice to the story at present, but heavy rain in western and interior Alaska is the big headline this week.

First, the east-central interior from the Alaska Range to the White Mountains saw a very notable episode of heavy rain on Friday evening and early Saturday; here are rain totals courtesy of the NWS:


Most of this fell in little over 12 hours.  Here's a map sent by Rick Thoman for Fairbanks-land:


Following hot on the heels of this event, a big rain is unfolding for the Seward Pensinsula and northwestern Alaska, with forecasts suggesting multi-day totals that could break longstanding records:


It's only been a few weeks since we were talking about heavy rain in the northwest, so this will add to the already substantial seasonal anomaly.

Here are the NWS estimates of total rainfall over the past several days:


Saturday, June 8, 2019

Peak Rainfall Rates

Intrigued by the extreme rainfall rate that was reported last Sunday at Fairbanks airport, I procured the history of 1-minute precipitation observations from the Fairbanks ASOS; this data goes back to 2000 and now provides a nearly two-decade history of high-resolution rainfall data in the warm season.  I had to pick out about 40 obviously erroneous data points, and it's likely I didn't find all the problems, but I checked the most extreme events of each year in the remaining data and they all look fine.

There is a lot of interesting analysis that could be done on the data, but the charts below provide the perspective for last week's rain.  The greatest 5-minute rainfall amount was 0.36" on July 4, 2005, and the top 10-minute and 15-minute totals occurred on July 21, 2010.  Both of these events saw peak 1-minute rates of 0.09", or 5.4"/hour, and that's also the highest observed for a 1-minute total.

The 1-minute data is only updated once a month, so we won't know for a few more weeks whether the recent event broke these records, but the realtime data from the ASOS does suggest so: 0.55" in 8 minutes is greater than the 10-minute record of 0.53".

What's perhaps even more striking is that the 10-minute record for June is only 0.22"; it's much more common (relatively) for extremely heavy rain to fall in July.  There have been only 6 events in total with at least 0.25" in 10 minutes, and of these 5 were in July and 1 was in August (August 17, 2008).

It's also curious to note something of a discrepancy with the NOAA precipitation atlas: the NOAA frequency estimates indicate a recurrence interval of about 20 years for 0.25" in 5 minutes, but it appears Fairbanks has now seen this happen 4 times in 20 years.


Monday, June 3, 2019

Intense Thunderstorm in Fairbanks

Yesterday evening the Fairbanks area experienced a very strong thunderstorm system that prompted a rare severe thunderstorm warning from the National Weather Service.  Here's the NWS public information statement from shortly after the event:

"Public Information Statement National Weather Service Fairbanks AK 802 PM AKDT Sun Jun 2 2019 ...Strong Thunderstorm Hits Fairbanks... Fairbanks had a thunderstorm move west across the city between 6pm and 7pm this evening. An NWS Weather Spotter in Hamilton Acres reported half inch size hail, and radar indicated hail of up to one inch diameter. There were numerous reports of pea size hail and frequent lightning in the Fairbanks area. The Fairbanks International Airport had 65 hundredths (0.65) of an inch of rain in a period of 21 minutes, which is one of the highest rainfall rates in recent memory in Fairbanks. There have been about 200 lightning strikes in the Fairbanks North Star Borough since the thunderstorms began around 3pm. As of 745 pm this evening, thunderstorms had moved south and west of Fairbanks and North Pole."

As luck would have it, a very intense part of the storm complex occurred over the international airport, and the ASOS instruments reported extremely heavy rain as well as hail of 3/8" diameter.  I have only been able to find a few instances of hail being reported from the Fairbanks ASOS (May 15, 2012, August 9, 2002, and June 9, 1997), and only the 2002 report included a hailstone size observation (1/4").

The ASOS precipitation data also show that 0.65" of rain fell in 21 minutes, and of that 0.55" fell in 8 minutes, which equates to a rate of 4.1" per hour.  This is a truly remarkable rainfall rate for such a high latitude, and I suspect it may contend for an all-time record for Fairbanks; more investigation would be justified.

According to the NOAA precipitation atlas, the estimated recurrence interval for a 0.55" rain amount is near 200 years for a 10-minute interval and over 500 years for a 5-minute interval, so this event lay somewhere in between.  In the graphics below, the black lines represent the recurrence interval estimates, and the green and red lines show the limits of the 90% confidence interval.


Here's a sequence of radar images showing the evolution of the storm system; its development was really explosive.  It's remarkable to see radar reflectivities of well over 60 dBZ, which is strongly indicative of hail.  This would be more typical of, say, the western Plains in Kansas or Nebraska at this time of year.


Looking at the balloon sounding from Fairbanks just a couple of hours earlier, the standard metrics don't show a particularly notable amount of instability (see below).   However, the northerly winds aloft produced a modest amount of wind shear (favorable for organized thunderstorms), and it was a moist environment.  Moreover, yesterday afternoon the NWS forecasters noted an upper-level wave that was expected to kick off some storm activity:

"Central and Eastern Interior: A shortwave moving to the south over the area will bring some scattered showers this afternoon and evening. The shortwave will be moving over an area with decent instability thanks to relatively moist antecedent conditions. The current GFS is showing surface based CAPE values of 300-500 J/kg across much of the Interior south of Livengood with weakly negative LI values. This swill be sufficient for some isolated thunderstorms across the area. Some thunderstorms may produce small hail or gusty winds."


Finally, here's a simple animation of the radar imagery.  An impressive event, indeed!


Friday, July 20, 2018

Hourly Rainfall History

Recently I have spent a good bit of time digging into the history of hourly precipitation data from Fairbanks, with a focus on the warm season months of May through September.  NOAA's hourly precipitation data set ostensibly covers 1949-2011, although there is inexplicably a long gap from 1952-1962 in Fairbanks; so I have filled this in by transcribing numbers from the historical LCD forms (a somewhat painstaking effort).  I also brought the data up to the present using hourly ASOS observations.

Now that I'm in possession of a reasonably complete data set, there are a number of questions that can be answered.  For instance, is there evidence that short-duration heavy rain events have become more common in Fairbanks?  We might expect this in a warming climate with increasing moisture content.  The chart below shows annual counts of days (May through September) with at least 0.5" of rain within a two-hour interval.  I used a two-hour period so that the analysis captures events that crossed the top of the hour, and the chart starts in 1956 because we have essentially complete data since then.  (But see a note at the bottom on the 1997 event.)


A striking result is the remarkable cluster of heavy rain events in 2005-2010: there were 8 separate events in 6 years, but the previous 50 years had seen only 10 such days in total.  If we assume a Poisson distribution based on the first 50 years, it is extremely unlikely (p<0.0001) that 8 events would occur in 2005-2010 by random chance, so "something" in the climate was different (perhaps a remote climate influence).  Interestingly, however, the last 7 years have seen only one of these heavy rain events.

The overall 62-year mean frequency of these events is 0.31/year, or a return period of 3.3 years, and this is nicely consistent with the NOAA precipitation atlas (https://hdsc.nws.noaa.gov/hdsc/pfds/):


For more analysis on heavy precipitation events in Fairbanks, but at a daily time scale, see this post from last October:

http://ak-wx.blogspot.com/2017/10/heavy-rain-frequency.html

And regarding the 1997 event that is included in the chart above: 0.75" of rain was reported for the daily total on June 8, 1997, but the hourly totals were not reported owing to a rain gauge malfunction.  There's no way of knowing for sure, then, whether 0.5" fell in two hours at the airport, but it turns out this event was a well-documented severe storm and there's little doubt that it qualifies for the analysis here.

Here's a write-up on the storm by one of the NWS staff in Fairbanks:

http://worldagweather.com/richmond2007_fairbanks_storm_june_1997.pdf

Looking at the hourly METAR reports, a key observation was made at 8:58pm on the 8th, stating that hail and rain had begun at 8:13 along with a peak wind of 50 knots (perhaps the rain gauge was blown over!).  Apparently hail fell for 18 minutes and rain for another 22 minutes.  None of the other hourly observations from that day reported more than light rain, so it appears that most of the 0.75" fell in less than one hour.

It just so happens that the Pedro Dome radar was offline for most of the day, but a scan from 8:55pm showed a strong storm southwest of Fairbanks - see below (image courtesy of weather.us).  As the storm was reported to be moving south in the METAR data, this is almost certainly the cell that brought chaos to the city.


Sunday, June 26, 2016

Strong Thunderstorms

This is just a quick post to document the strong storms occurring in the vicinity of Fairbanks today, as noted by reader Gary.  The sequence of radar images below, at one-hour intervals, shows the widespread development of thunderstorm cells that showed a tendency to merge into larger thunderstorm clusters.


The radar-estimated total precipitation is above 2" in a number of places and even exceeds 4" west of Fairbanks, which would be enough to cause serious local flooding problems.


The 4pm Fairbanks sounding shows a very high 61°F dewpoint at the surface (see below), although the airport ASOS didn't report anything higher than a 57°F dewpoint - but even so, that's quite a lot of moisture.