Showing posts with label Record. Show all posts

Thursday, April 2, 2026

March Record Cold

Rick Thoman has a nice blog post about the remarkable cold for many locations in March:

https://alaskaclimate.substack.com/p/record-setting-cold-march-in-alaska

With Fairbanks being near the epicenter of the cold anomaly, it's worth drawing attention to some of the remarkable highlights there.  The monthly mean temperature of -9.0°F at the airport was 19.6°F below normal, the most anomalously cold month since February 1990.  It was the coldest March on record, approximately equal to an average January in terms of mean temperature.

Rick Thoman makes the interesting point that there is actually a statistically significant trend towards greater variability in March mean temperatures from year-to-year:


Overnight minimum temperatures (mean of -26.3°F) were even more unusual at 22.9°F below normal and 5.4°F below the previous record.  Remarkably, there are not that many calendar months with such low minimum temperatures at any time during winter: only 4 months this century prior to this winter.  There are also only a couple of months in Fairbanks history with mean maximum or minimum temperatures so far outside the historical range: the extreme warmth of January 1981, and the extreme cold of September 1992.  Here's a chart of March average daily minimum temperature:


Daily maximum temperatures were not quite as extreme in terms of their monthly mean, but the overall monthly maximum of only 30°F was a record; Fairbanks has not previously been observed to stay below freezing the entire month.


The last time the temperature was above freezing at the Fairbanks airport was October 31, and that means the entire climatological "cold season" of November through March was at or below freezing (32°F was reached on January 16).  Again that is a first in Fairbanks.


Here's an interesting (to me) perspective on when the monthly mean temperature records were set in Fairbanks.  Summer and winter cold records mostly occurred around 1950-1980, but record-setting cold has occurred more recently in autumn (1990s) and March-April (2013 and this year).  Warm records clustered in 1975-1981.


Only March, April, and October have their cold records occurring after their warm records.  The February records occurred in back-to-back years in 1979 and 1980.

I'll be on the road for the next week or so, but more discussion of the March extremes will be forthcoming when all the usual climate data is available.


Friday, March 27, 2026

Juneau Seasonal Snow Record

Excessive snow has been a recurring topic here this winter, and another big headline has now emerged: Juneau has broken its seasonal snowfall record, exceeding 200 inches for the first time since records began (1948).  The previous record occurred in 1964-65.

The chart below shows that Juneau's snowfall this winter (blue line) occurred mostly in December and in the past month or so, with a lengthy spell of nearly zero snow for much of January and February.


Remarkably, Juneau's calendar month snow records have been broken for both December and March this winter.  It's the first time a single winter has broken two calendar month snowfall records at one of the "big three" cities (Juneau, Anchorage, Fairbanks).

Recall that although January was quiet in Juneau, the monthly snow record was broken in Anchorage, and last month came in second place for February snowfall in Fairbanks.  See this post for the most recent discussion of events earlier this winter:

https://ak-wx.blogspot.com/2026/02/fairbanks-snow-onslaught.html

Interestingly, although Fairbanks has had some snowy times in recent winters, a monthly record hasn't been set since 1992 (both May and September - but in different "winters").


Wednesday, May 21, 2025

Flood of 1948

On this date 77 years ago, Fairbanks was experiencing the worst flood in the short history of the city up to that time.  It would go on to be exceeded by the August 1967 flood, but May 1948 remains the second worst flood, and the worst springtime flooding event.

The event was not a breakup flood, although breakup was very late that year, occurring on May 10 on the Chena River in Fairbanks, and May 13 on the Tanana River at Nenana.  Rather, the flooding arose about a week later from tremendous snowmelt runoff in the hills.

The stage was set a month or more earlier, as very heavy precipitation occurred from late March into April.  Valley-level temperatures were marginal for snow during the sustained precipitation of April 7-14, but it would have been cold enough in the hills for snow to continue accumulating.  Here's the data from the Fairbanks climate record:


Notice the cold that developed in mid-April, preserving the snowpack at a time of year when it would normally be starting to diminish, depending on elevation.  Overnight temperatures were still falling below 20°F in early May - hence the late breakup - but then spring finally emerged on May 9, and there was no looking back.

It's difficult to say how much snow may have actually been on the hills above Fairbanks by the time the big thaw arrived.  The preceding winter was quite warm until February, and not particularly wet, so it seems unlikely there was a big snowpack going into March; but the 3" of new precipitation in Fairbanks in late March and April would have added at least 4-5" of liquid to the elevated snowpack, perhaps much more.  There have been other years since with snowpacks that were greater, but back in 1948 the combination of sudden melt and a lack of modern flood defenses produced a very unfortunate outcome.

Here's a silent clip from the Alaska Film Archives documenting the event.


Monday, October 28, 2024

Flood Follow-Up

A few different items of comment today.  First, a significant snowfall is under way across the south-central region today, signaling the start of winter proper for many valley locations in that area.  If Anchorage's snow cover hangs around in the coming weeks, it will mark an earlier than normal onset of permanent snow pack; the normal date is about November 9th.  Of course Anchorage occasionally lacks snow cover even in the depths of winter, but it's unusual, occurring most recently in 2015-16 and for a few days in late December 2019.

As for Fairbanks, the normal date for establishing permanent snow cover is October 18, and it was right on time this year.  However, the most recently reported snow depth of 10" is the highest for the date since 1992, and more fell today.  (But 11" was on the ground in September 2015.)

Looking back at last week's historic west coast storm, it's worth highlighting blog comments by Rick and Gary.  Rick Thoman confirmed that long-time Kotzebue residents reported the highest water in living memory, which is why it was such a devastating event for some in the community:

https://www.adn.com/alaska-news/rural-alaska/2024/10/26/after-flood-kotzebue-residents-take-stock-of-damaged-homes-and-property-and-take-care-of-one-another/

Although the meteorology was different, we might say this was Kotzebue's version of ex-Typhoon Merbok, which caused such havoc for coastal locations farther south about two years ago:

https://ak-wx.blogspot.com/2022/09/more-on-ex-merbok.html

The article highlighted by Gary indicates that flooding was not quite as bad this time around from Nome down to Unalakleet:

http://www.nomenugget.net/news/high-winds-cause-erosion-and-flooding-region

Rick also commented that storms in November 1973 and 1974 may be the most analogous events in the modern climate record.  Certainly the storm of November 10-11, 1973, shows a rather similar sequence of events: low pressure over the Chukchi Sea created strong winds out of the south early on the 10th, and then the winds went around to the west and blew fiercely with a strong north-south pressure gradient, pushing water into Kotzebue Sound.  Here are MSLP maps:


Compare to the recent event:


Interestingly, the wind speed itself was not particularly unusual with last week's storm, and there have been many past events with equally strong, or stronger, winds from a westerly direction in Kotzebue.  I think therefore it was the very low pressure, the large size of the storm, and the long duration of southerly fetch that allowed such a large surge to develop before the winds turned westerly and pushed the water onto the coast.

Wednesday, October 23, 2024

Kotzebue Flood

In yesterday's post I remarked that I hadn't yet seen specific reports of storm impacts for the west coast, but it turned out that the worst was yet to occur in the northwest, and specifically in Kotzebue:

https://www.adn.com/alaska-news/rural-alaska/2024/10/23/after-severe-flood-displaces-80-people-kotzebue-begins-recovery/

Stormy weather began way back on Saturday in Kotzebue, and the highest winds (gusts to 55 mph) occurred on Monday morning, but it wasn't until yesterday that flooding became severe as the winds went around to the west.

I think what happened here is that a prolonged and very strong southwesterly flow built up a considerable surge of water in the southern Chukchi Sea while the storm's center was at its most intense over Russia's northeastern coast on Monday.  When the circulation finally pushed east towards the North Slope on Tuesday, and the winds went around to the west in Kotzebue Sound, that elevated water rushed into the Sound and inundated the city rapidly.  The "shockingly fast" rise of the water sounds very much like a classic storm surge event that is more commonly seen in landfalling tropical cyclones.

Below is a sequence of model analysis maps showing the pressure and winds at 6 hour intervals from 10am on Monday through 10pm last night.  Judging from the severe impacts, it seems this was essentially a worse-case scenario for Kotzebue flooding.


Tuesday, October 22, 2024

Record Rain and Snow

Fairbanks schools and borough offices are closed for the second day today, as record-breaking rain and wet snow has produced difficult travel conditions in the area.  The airport's two-day liquid-equivalent precipitation total of 2.28" is within the top 10 for any time of year (1930-present), and of course most of the heaviest precipitation events occur in the warm season in Fairbanks.  Only two cold season events have seen higher two-day totals: the Christmas storm of 2021 (2.45", blog post here) and January 19-20, 1937 (which was actually a three-day event totaling 3.21"). 

More superlatives: yesterday's calendar day precipitation total of 1.99" is the third largest of any day since 1930 in Fairbanks, the only wetter days being July 27, 2003, and August 12, 1967 (the great Fairbanks flood).  And according to Rick Thoman, the peak 24-hour total (Sunday evening through Monday evening) of 2.07" is the highest on record for the cold season, and the first to exceed 2".  The previous cold season record for 24 hours was 1.93" in the 2021 storm, and before that 1.84" in 1937.

Higher amounts were reported elsewhere: a CoCoRaHS site near the airport measured 2.96" in the two days, and the Keystone Ridge site came in at 3.27".

At least half of the precipitation fell as plain rain, according to the airport ASOS data, and owing to temperatures persistently below 20°F late last week, the cold ground led to lots of ice formation.  There's a window for some thaw today, but temperatures will drop back below freezing tonight and stay there, so some of that ice is going to be around all winter, unfortunately.  It's a theme we've seen repeatedly from winter rain events in Fairbanks in recent years.

Here's a snapshot of the atmosphere's vertical profile at 4pm AKDT yesterday; it was still raining at the airport, but rain had switched back to snow on Keystone Ridge:


Check out the wind speeds aloft: over 150 mph at 34,000 feet.  The southwesterly flow direction through much of the lower and middle atmosphere is what brought the moisture into the central interior without it being squeezed out by the Alaska Range to the south.

As for storm impacts elsewhere in Alaska, the west coast has been very windy, strong winds affected south-central areas yesterday, and Bering Sea coastal flooding has undoubtedly been significant, but I haven't seen detailed reports yet.

Far to the west over Chukotka's Arctic coast, the storm's central pressure bottomed out at around 956 mb according to Environment Canada.  As noted in Friday's post, this is very likely an October record for that location, but we'll have to wait a few days for the ERA5 data to be sure.  Here's the surface analysis from 4am AKDT yesterday.


Wednesday, September 18, 2024

Summer Wind

Here's a bit of follow-up on the remarkably windy summer that occurred over parts of western Alaska.  According to ERA5 data, the June-August average 10m wind speed was the highest since at least 1940 for areas shaded in red below:


The east end of Norton Sound was perhaps the epicenter of the anomaly, including communities like Shaktoolik and Unalakleet.

To confirm that this isn't just a model artifact, here's the history of June-August wind speed measured at the Unalakleet airport since 1991:


The airport instruments have been classified as an AWOS platform since 1991, so I have some confidence that the wind measurements are relatively consistent since then.

The seasonal mean wind speed of just over 11 mph may not seem like much, and indeed it isn't much compared to winter wind speeds in Unalakleet: the average wind speed is over 15 mph in February.  But it's historically very unusual for the time of year: 8 separate days had a daily mean wind speed over 20 mph, compared to a previous (post-1990) record of 5 days, and over 30 days this summer saw peak sustained winds over 20 mph (normal is 16 days).

Here's a chart of daily average winds compared to a 20-year normal, for an ERA5 grid cell very close to Unalakleet.


Most of the wind action was in July and August, with the early July event standing out dramatically: that was when the pattern suddenly changed to westerly, as we noted at the time:

https://ak-wx.blogspot.com/2024/07/big-pattern-change.html


Thursday, February 1, 2024

Cold Snow

There's been a lot of interesting weather across Alaska in recent days - as demonstrated by the sudden uptick in blog posts - and here's another one that merits attention.

Back on Sunday, as the upper level trough pivoted over western Alaska, heavy snow developed in the frontal zone over Anchorage, even as temperatures at the surface remained uncharacteristically low.  Sunday's high temperature was only +2°F even while prolonged snowfall occurred in the afternoon and through the overnight hours, leading to an accumulation of 9.9" by midnight and another 6.7" the next day (adjacent to the airport).

Such a large snowfall at such a low temperature is unprecedented in the Anchorage climate data back to 1953, and not by a small margin: check out the following chart showing the joint distribution of daily high temperatures and daily snowfall.


The explanation for this outcome involves the rare combination of strong mid-atmospheric lift along the frontal zone, combined with an unusually cold airmass at the surface.  Here's the Anchorage airport sounding at 3pm on Sunday:


Notice the cold layer at the surface, with northerly winds of over 30mph at about 2500' above ground.  But higher up the winds were out of the southeast and south, and the sounding shows a deep layer of saturated (humid) air near or just below -10°C, which is a temperature conducive to growth of dendritic snow crystals.

Here's a map of 850mb temperatures (shaded) at the same time, showing the extremely cold air to the north and west, and much warmer air to the southeast of Anchorage; the snow occurred in the strong gradient between the two.


And the 500mb height analysis at the same time:


It's interesting to note that Fairbanks and Bettles also saw accumulating snow to an unusual degree for such cold weather.  In Fairbanks the daily total was only 0.6" - also on Sunday - but nevertheless this tied the record for most snow with such a cold high temperature (-27°F).  In Bettles 4.9" fell on Monday, with a high temperature of -13°F.


Wednesday, January 24, 2024

Huge Snows in Juneau

Back in November, Anchorage saw a remarkable snow onslaught (38" or so) that amounted to the 3rd greatest on record for a time scale of 10-14 days:


https://ak-wx.blogspot.com/2023/11/a-few-notes.html

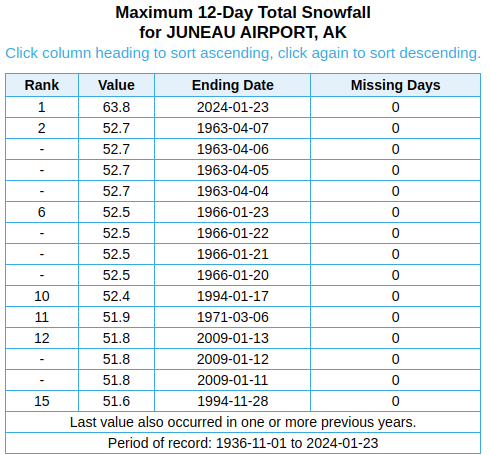
Juneau has now countered with a yet more extreme snow situation, with two huge storms in the space of 10 days, and a 12-day total of 64".  This is the greatest snow accumulation on record for windows of 11-18 days, and it's well ahead of the previous record for 12-day snowfall:


The latest 3-day total of 34.5" at Juneau airport is itself the 3rd greatest on record, exceeded only by storms in 1963 and 1966.  Even higher amounts were reported from other locations, including 48" around the corner on Taku Inlet.

According to the NWS, "Juneau Docks and Harbors Department reported several boats capsized or sunk by weight of the snow".

The key aspect of the weather setup seems to have been a near-stationary frontal zone draped across Southeast Alaska: below are the surface analysis charts from 3pm Sunday, Monday, and Tuesday respectively.  Notice the long stationary front marked on the top image and resurrected on the last image, with broad areas of low pressure over the Gulf and modest high pressure to the east and north.


A slow-moving weather situation is obviously a prerequisite for prolonged periods of heavy precipitation.  It also seems clear that the relatively weak nature of the Gulf low pressure was a key factor, because the warm southerly flow wasn't strong enough to drive out low-level cold air, and precipitation remained in the form of snow longer than expected.  A stronger, more dynamic Gulf storm would have quickly swept warm air into the Panhandle and produced rain instead.

From the NWS Juneau discussion on Tuesday afternoon:

Southeast Alaska Forecast Discussion
National Weather Service Juneau AK
332 PM AKST Tue Jan 23 2024

.SHORT TERM...Winter weather continues for places north of the
Icy strait corridor while places to the south continue to see
rain. Temperatures this afternoon have been slow to warm up,
especially those still under the influence of outflow winds. Model
guidance continues to try and warm up locations that are
currently seeing snow but observations continue to show cold air
remains. A wave moving up from the south has started to enter the
panhandle bringing a reinforcing shot of moisture to the area.
This wave could also bring a surge of warm up form the south to
the north as well. The big question with this remains are the
winds associated with it strong enough to mix out the surface
inversion that has allowed us to see snow. Current thinking is
that we will see a slight warm up with this wave but that it will
not be strong enough to mix out the cold air. With that being the
case, the Juneau area is expected to continue to see snow. If the
wave does succeed in mixing out the surface inversion, the snow
will switch over to rain fairly quickly. The current forecast
tried to reflect this possibility of staying snow for longer and
the winds failing to mix out the inversion until tomorrow.

Sunday, September 3, 2023

Record August Warmth

Just a quick note to re-emphasize how extraordinarily unusual the warmth of the last 6 weeks has been for the central and eastern interior, and particularly in terms of daily minimum temperatures.

Here's the leaderboard for average daily low temperatures in Fairbanks from July 16 through the end of August:

2023   55.2°F

2016   52.7°F

1990   52.5°F

2004   52.3°F

1974   52.3°F

2017   52.2°F

2021   52.0°F

This year stands out like a sore thumb.  The departure from normal represents a 3.3 standard deviation anomaly compared to the 1991-2020 distribution.  This is an extreme climate event, with a "return period" of many hundreds of years assuming a stable climate.

Accordingly, it's perhaps no surprise to see that there is *still* very little color in the foliage, based on Nenana and Cleary Summit webcam views from yesterday afternoon:


Here's a chart of Fairbanks airport daily minimum temperatures since June 1:


Looking at monthly statistics for August, Eagle had its warmest August on record (1905 is warmer in the books, but the minimum temperatures look much too high).  Northway was also the warmest on record, while Fairbanks was 3rd warmest overall, but warmest for daily low temperatures.  Gulkana also had its warmest August for daily low temperatures.

But change is in the air: snow was falling in the hills above Fairbanks yesterday morning.  Here's a view from Wickersham Dome, before the sky cleared out later in the day.


Saturday, April 8, 2023

Record Cold in Spots

Cold has intensified for western and northern Alaska, with -30°F being reached in a number of spots this morning.  Most notably, Nome was one of those spots, and this ties the record for the month of April and is also the coldest on record this late in the winter.  The only previous instances of -30°F in April were April 5, 1918, and April 7, 1968.

The maps below show the lowest hourly-observed temperatures since midnight, and the minimum temperatures (e.g. as measured by ASOS instruments) can be a bit lower than these hourly numbers, as at Nome.  Click to enlarge.


Here's a roundup of some other notable low temps:

-37°F  Noatak

-36°F  Umiat RAWS

-33°F  Selawik 28E CRN

-32°F  Kivalina

-28°F  UtqiaÄ¡vik

A couple of days ago Bettles had -31°F, and Wiseman saw -32°F.  This is verging on record territory for the time of year, but it doesn't seem all that remarkable after the 2021 cold snap, which was much colder for the interior.  Read more about that here.

Reader Andy makes a good point about the increasing risk of flooding at break-up because of this cold weather, as there is a healthy snowpack across much of interior Alaska.  Rick Thoman just wrote about the snowpack on his Substack newsletter - check it out if you haven't already:

https://alaskaclimate.substack.com/p/spring-2023-snowpack


Tuesday, December 6, 2022

Utqiaġvik Record Warmth

Following hard on the heels of the remarkable episode two weeks ago, the last few days have again seen extremely unusual warmth surge northward across western Alaska and the North Slope.  Freezing rain and even plain (above-freezing) rain was observed widely, leading to loss of snow cover and significant ice accretion in places.


From the perspective of the long-term climate record, most remarkable of all was UtqiaÄ¡vik's 40°F yesterday morning on strong southerly winds.  This temperature was measured by both the airport ASOS and the CRN site outside town, and it's the highest temperature ever recorded in winter in UtqiaÄ¡vik.  Continuous climate observations have been made there since 1921.  Here's a graphic (click to enlarge):


There will be more to say about the rain and freezing rain when I've had a chance to look through the observations more carefully.  For now, it suffices to say that rain has occurred at most or all of the automated sites across northwestern Alaska and North Slope, and even as far east as Toolik.


The excessive high-latitude warmth hasn't been confined to Alaska: it's been raining in Greenland too.


Here's part of the reason why: the Arctic Oscillation has turned sharply negative, which means that MSLP is above-normal in the Arctic, leading to cold in the mid-latitudes and warmth up north.  But of course that doesn't explain the new all-time temperature record; for that, we might suspect that the cause lies in the widespread unusual warmth of the North Pacific.  I suggested as much back in October: "The very warm ocean (relative to normal) ... will certainly boost warmth for Alaska whenever the flow comes from the southwest this winter." 


Sunday, September 18, 2022

Record Bering Sea Storm

The extreme Bering Sea storm of the past three days has now decayed to a weaker low pressure system near Point Lay, and west coast communities are beginning to clean up where they can.  Storm surge flooding was devastating in some villages and caused major damage in Nome.  Without question, this was one of the most intense and damaging storms in living memory for the coast from Hooper Bay up to Nome, and recovery will take a long time.

From a meteorological standpoint, the situation was remarkable and extreme.  The ECMWF model analysis indicates that the storm's central pressure was easily the lowest on record for September in the northern Bering Sea (data since 1950); but more remarkably it appears to have been the lowest for any time of year along part of its track leading up to St Lawrence Island.  The ASOS instrument at Savoonga reported a minimum MSLP of 953.2mb, which matches the ECMWF analysis very well.  Rather remarkably, the storm's center appears to have passed over the island, although extratropical cyclones don't have the calm, well-defined center that tropical storms do.  ERA5 has a 1950-2021 record low MSLP of about 956mb at Savoonga.

Here are maps of the ERA5 September record low MSLP and all-time record low MSLP, with the ECMWF 6-hourly minima annotated:


One word of caution here: the current ECMWF model isn't the same version as the ERA5 reanalysis model, so we'll need to wait a few days to confirm the records in the self-consistent ERA5 system.

Looking back at the formation of the storm, the main culprit was certainly not the size or strength of Typhoon Merbok.  It was only marginally a Category 1 storm in the tropics, with maximum sustained winds of 80mph and minimum pressure of 965mb.  This is almost a non-event as far as West Pacific typhoons are concerned.

The reason that the storm transitioned into such an intense extratropical cyclone was the fortuitous ("unlucky") interaction of not one but two upper-level disturbances with the decaying, northward-moving tropical storm.  Both upper-level disturbances originated in the mid-latitude jet stream over southern Russia, which was unusually strong because of a sharp gradient between a strong trough over the Russian Arctic and a strong ridge from Mongolia to the Sea of Okhotsk.

The first map below (courtesy of Tropical Tidbits) shows the situation a full week ago, with the three key features highlighted: the one to the left is Merbok, and the middle one is a subtle feature that intensified significantly as it moved off the coast of Russia.  Here's the progression at 24 hour intervals:


The first mid-latitude disturbance set up the initial round of extratropical transition and re-intensification for decaying Merbok, but this was quickly followed by another interaction with the third (rightmost) feature when the storm neared the Aleutians.  The one-two punch of mid-latitude jet stream "energy" is what took ex-Merbok to its extreme intensity over the central Bering Sea.  Here's the continued progression at 24 hour intervals up to Saturday afternoon.


More to come on the impacts of ex-Merbok in a subsequent post.