Showing posts with label North Pacific. Show all posts

Tuesday, September 23, 2025

First Snow, and North Pacific Warmth in Winter

Fairbanks saw its first snowflakes of the season today, just a few days earlier than normal.  Temperatures were above freezing and no accumulation occurred in town, but the scene looked a lot like "late autumn" in the hills.  Here are a couple of webcam views from Cleary Summit on the Steese Highway shortly after 9am today:


On another topic, reader AlexG asked whether this summer's extreme North Pacific warmth is likely to have an effect on winter in Alaska.  It just so happens that I gave a talk related to this question 10 years ago at UAF, and here's a link to the slides from that occasion:

https://s2s.worldclimateservice.com/wcs/uaf_sep2015_north_pacific_sst_blob.pdf


The winters of 2013-14 and 2014-15 both saw a tremendous amount of warmth in the northeastern Pacific, and that sea surface temperature anomaly became known colloquially as the North Pacific "blob".  In a 2015 paper, Dennis Hartmann of the University of Washington discussed a mode of natural variability - the North Pacific Mode - that resembled the "blob" pattern, and my 2015 talk looked into its connection to Alaska winter climate.

The bottom line from this work of a decade ago is that a positive North Pacific Mode (warm ocean) is linked to unusual winter warmth in most of Alaska except the Southeast, and it also favors wet rather than dry conditions in most areas.  The link with winter precipitation is strong in interior Alaska, because a positive NPM is associated with stronger westerly flow and less chinook flow from the south.

The other major mode of North Pacific temperature variability is of course the Pacific Decadal Oscillation (PDO), which is also closely linked to precipitation across interior Alaska and to temperatures statewide.  A negative PDO phase, which is what we have at the moment, tends to bring wetter winters to the interior (like the +NPM) but colder temperatures statewide (generally opposite to the +NPM).

Here are the canonical sea surface temperature (SST) patterns associated with positive NPM and PDO phases:


Note that the PDO and NPM are independent of each other, so a positive NPM can readily coincide with a negative PDO, as this year.  Also, a negative PDO doesn't necessarily imply cooler than normal SSTs in the northeastern Pacific; the mode expresses the spatial contrasts/gradients in SST rather than the absolute values.  This year's negative PDO phase has been very much driven by extreme warmth near and east of Japan, rather than cool water along the coast of North America.

If we look at previous winters with the +NPM/-PDO combination in the North Pacific, we see - as expected - a strong indication of above-normal precipitation across most of Alaska to the north of the southern coastal regions (where it tends to be dry), and there's also a fairly robust cold signal that apparently reflects the dominance of the PDO influence.  The fundamental circulation anomaly involves unusual high pressure (or equivalently, less low pressure) over the Aleutians, producing a stronger component of westerly flow across central Alaska.


Of course we don't yet know whether the North Pacific SST patterns will remain similar until winter and throughout winter, and indeed there's a good chance they won't.  It's therefore worth examining past years when the +NPM/-PDO combination occurred in summer, rather than assuming it will persist unto winter.  Here's the result:


Interestingly, the precipitation signal is very similar, but the cold signal is much weaker in the summer "analog".  This seems to be because several of the summer matching years ended up with El Niño and/or a near-neutral PDO phase during the subsequent winter, thereby changing the remote influences on the circulation patterns near Alaska.  In contrast, most of the winter +NPM/-PDO matches involved La Niña during winter, reinforcing the cold signal.

And for this winter?  Best estimates are that La Niña will probably prevail during autumn and early winter before fading over the course of the winter; El Niño is very unlikely.  But that doesn't mean it will be cold.  Arguably the most similar recent year in terms of the tropical and North Pacific setup is 2022-23, and that was a warm winter for Alaska (except for Southeast), while the precipitation anomalies matched the +NPM/-PDO pattern very well.


Saturday, July 12, 2025

June Climate Data

June was an interesting month for global climate, and Alaska's weather reflected the larger-scale patterns that unfolded.

One of the most striking aspects was that unusually strong ridges developed in the mid-latitudes of the Northern Hemisphere - particularly across the North Pacific from Japan to the US West Coast, and across the North Atlantic and southern Europe.  Record heat waves occurred in western Europe and Japan, and it was the hottest June on record in both regions.


In contrast to the mid-latitude ridging, the atmospheric pressure was generally lower than normal in the Arctic, and especially from eastern Russia to the Bering Sea and across the northern North Atlantic and northern Europe.  This "see-saw" of MSLP is typical of the Arctic Oscillation, and June characterized a positive AO phase.


The Arctic Oscillation typically refers to conditions in the troposphere and is not always directly linked to the stratospheric flow above, but in this case the circulation anomaly extended well up into the stratosphere.  In the lower stratosphere, for example at 100mb pressure, there was a similar ring of above-normal heights (pressure) in the mid-latitudes and low heights near Greenland:


In tandem with the pressure anomaly, the 100mb circumpolar westerly winds at 60°N were the strongest on record for June.  Think of it as a vortex of counter-clockwise rotating air aloft that was moving faster than ever observed before (in June) up at about 50-60,000 feet.


What relevance does this have for Alaska?  Well, the low pressure over the Bering Sea involved unusual storminess, so it was a very windy, cloudy, and wet June for Aleutian and Bering Sea communities.  Also, with southern Alaska located squarely in the zone of enhanced westerly winds to the north of the Pacific ridge, the wet weather traveled eastward across the Gulf Coast to the northern Panhandle.  It was also unusually cool in southern and especially Southeast Alaska, with warm air unable to migrate up from the south.  Here are my usual monthly percentile rank maps based on NCEI data (top two maps) and ERA5 data (maps below):


One might expect that low pressure in the Arctic (positive AO phase) would also produce windy and perhaps wet weather for Arctic Alaska, but in fact the classical positive AO setup at this time of year tends to allow a localized ridge to the north of Alaska, and that's what we saw in June (see the first map in this article).  As a result, the North Slope was mostly calm, sunny, and generally warm and dry.  Sunny, warm, and calm conditions also extended over most of the northern and eastern interior - but this refers to monthly averages, and there was also a tremendous amount of lightning during the month.  Here's a map of lightning strikes during the month, showing very widespread activity:


With over 93,000 ground strikes, this was the second most active June recorded by the ALDN (2012-present); the most active June was in 2015, with about 103,000 strikes; but that year the activity was concentrated farther south, and especially in the southwestern interior:


I'll be doing more analysis of this year's lightning activity in a subsequent post.

It's also worth commenting on North Pacific SSTs, which have reached extreme levels of unusual warmth from Japan eastward in recent days (responding to the strong ridge across the North Pacific).  Check out the development of extreme warmth between early June and early July:


This is an enormous marine heat wave, perhaps the most expansive and anomalous on record in recent decades; I'll have to do some objective analysis to quantify this.  The warmth in this region is characteristic of a negative PDO phase, and so the PDO index has plummeted to record negative values in recent days (see below).  We might say this is also part of the reason for the cool June in southern Alaska.


Thursday, May 23, 2024

Early Spring Wet Pattern

I promised to follow up with a few remarks about the wet pattern that has become a recurring theme of early spring (March-April) for western Alaska since 2018.  Rick Thoman pointed out this phenomenon on his blog:

https://alaskaclimate.substack.com/p/is-early-spring-precipitation-higher

As I commented briefly before, it seems pretty obvious that the immediate cause of the wet weather is the vigorous jet stream and storm track into western Alaska caused by a persistent ridge over the North Pacific.  Here's the March-April 500mb height departure from trend, averaged over the last 7 years.


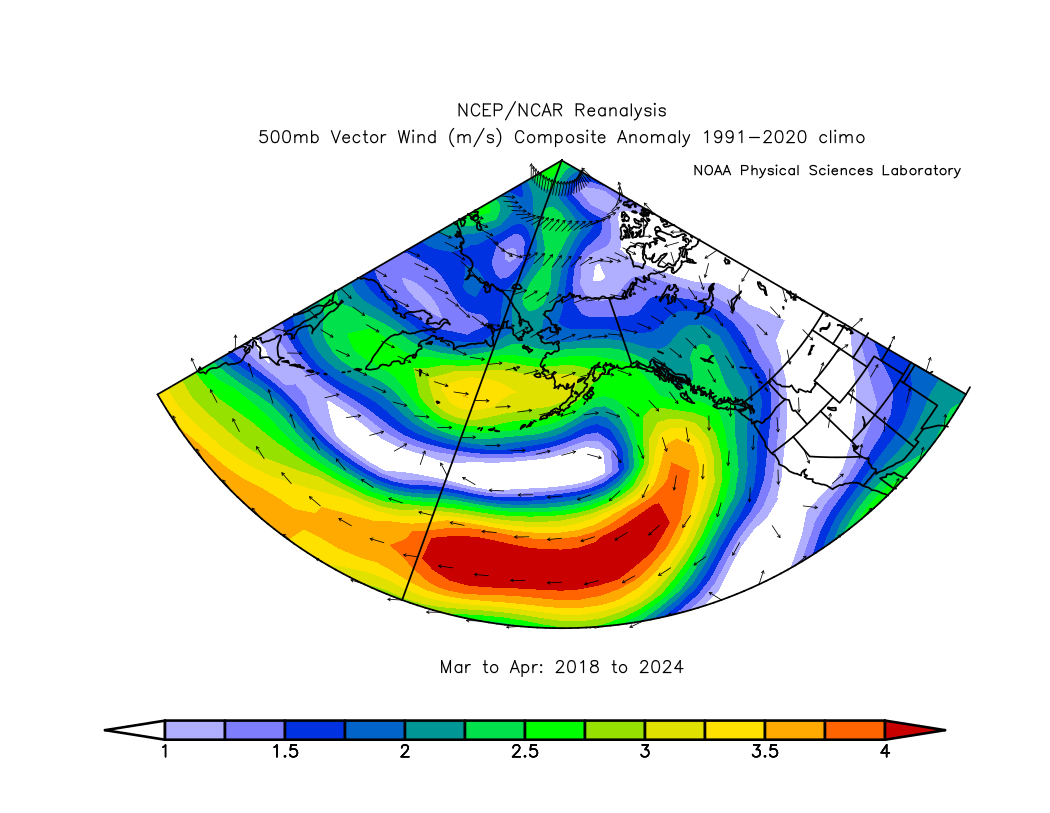
And here's the average 500mb vector wind anomaly (departure from normal): note the stronger than normal westerly flow into southwestern Alaska. 


I decided to look back prior to 2018 for an independent assessment of the relationship between west coast precipitation and North Pacific 500mb height patterns.  Here's the correlation of March-April 500mb height (detrended) with March-April precipitation in Nome:


This certainly supports the idea that a ridge axis from the Sea of Japan to the Gulf of Alaska is favorable for enhanced precipitation in Nome at this time of year.  A trough along the eastern Arctic coast of Russia also tends to be in the mix.  The pattern in the historical analysis implies a southerly wind component across western Alaska, and that corresponds to widespread warmth for western and northern Alaska.


The March-April pattern was slightly different this year, with a more westerly regime and cooler conditions in southwestern Alaska. 


How about sea surface temperatures?  Surprisingly, there's not much historical correlation between Nome precipitation and North Pacific SSTs at this time of year; it seems that early spring precipitation has historically been controlled by the vagaries of the weather pattern much more than by ocean temperatures.


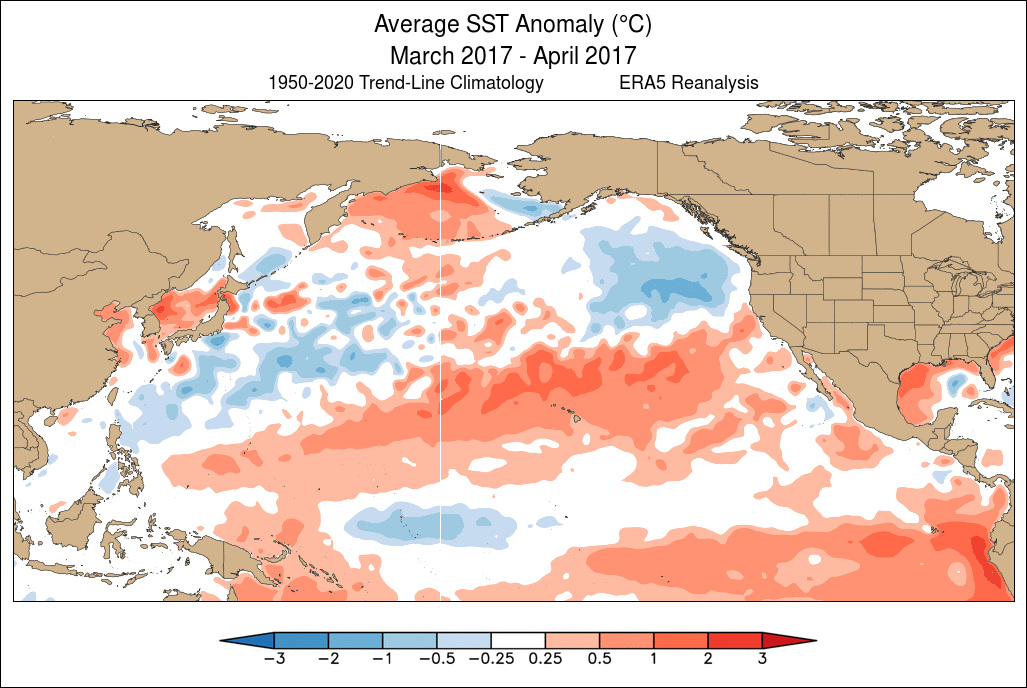
In contrast, however, I think the recurring pattern of the last 7 years is in fact linked to North Pacific SSTs, and strongly so.  Check out the sequence of March-April SST maps below, starting with 2014, when the so-called "blob" of excessive warmth was very much evident in the northeastern North Pacific.  This anomaly was linked to the "ridiculously resilient ridge" over western North America, leading to California drought and other things.  The "blob" pattern evolved into a strongly positive PDO pattern by 2016 in response to the intense 2015-16 El Niño, but then a regime change occurred in 2017-2018 as warmth transitioned to the northwestern North Pacific:


It is remarkable to see how persistent the pattern has become since... yes, 2018.  Here's a summary graphic showing the March-April detrended SST anomaly over the 7 years:


The alignment with the 500mb height anomaly is undeniable:


A really interesting aspect of this is that the warmth from Japan to the waters south of Alaska has persisted more or less unchanged regardless of El Niño and La Niña.  In the sequence of SST maps above, notice the major swings in tropical Pacific SST anomalies.  Normally we expect extratropical SST patterns to respond to ENSO - as in 2015/2016 - but the northwestern North Pacific seems to be marching to a different tune.

As an aside, it's worth noting that the emergence of warmth in the NW North Pacific in 2018 was quite striking at the time, and I commented on it in the North Pacific "blob blog":


Is this just the negative PDO phase that we're seeing in the North Pacific pattern?  Not entirely.  The PDO has indeed been persistently and significantly negative since 2021 - but not in 2018-2019.


A classical negative PDO phase tends to be linked to a trough over Alaska and cool waters from the Bering Sea and Gulf of Alaska to the northeastern Pacific, but the Bering Sea has been generally warmer than normal in recent years (especially in 2018-19), and Alaska hasn't been unusually cold.  Also, a negative PDO is not linked to above-normal precipitation in Nome in early spring.  The following maps show the average March-April pattern when the PDO was strongly negative over the decades.


So what can we take away from this discussion?  I think we can conclude rather confidently that the early spring wet pattern in (especially) western Alaska is linked to the persistent and exceptionally unusual North Pacific warm zone stretching east from Japan that emerged in 2018.  This developed in tandem with atmospheric ridging that both reinforced and was reinforced by the SST anomaly, and the atmospheric circulation anomaly has produced a storm track into western Alaska.

As for the deeper cause of the North Pacific anomaly, we can attribute some of it to the negative PDO phase (i.e. natural multiannual/decadal variability), but the excess warmth from the Bering Sea to the Gulf of Alaska is unexplained.  It feels like a new angle on the multi-year northeastern Pacific warm episode that developed in winter 2013-14, although the new warm zone now has a much greater duration.  I also have a sense that the new regime is related to "Arctic amplification" of the global warming trend, but this is speculation; presumably at some point the North Pacific pattern will shift again.

Finally, a question for next time: how else has the 2018 regime shift affected Alaska climate?  It will be interesting to look for other climate anomalies that developed at the same time, but for other locations and at other times of year.

Friday, February 18, 2022

Cyclone Trends

I'm in the middle of a busy season and unable to post much, but some readers may be interested in a bit of historical analysis that I did the other day in response to a Twitter query about North Pacific low pressure systems.  Are North Pacific winter cyclones becoming stronger?

There are probably dozens of ways to look at this question, but I used the ERA5 reanalysis to add up the number of hours below several MSLP thresholds at each location, by year, from 1950-2021.  I then calculated a linear trend for the number of hours, for example:


This shows that much of the basin has seen an increase in time spent below 960mb, which is a threshold that represents a moderately strong extratropical cyclone for this part of the world.  Gray areas on the map have less than 10 years in which the MSLP dropped below 960mb, so the sample size is much too small to draw a trend.

However, the trends since 1979 are mixed, showing that there hasn't been a robust basin-wide trend in the past 40 years.


For a basin-total view, here's a look at the annual area-time fraction below 960mb, 950mb, and 940mb.  To understand this metric, consider that if the entire area were below 960mb for 50% of the year, the annual area-time fraction would be 50%.  Alternatively, if 50% of the area were below 960mb for 50% of the year, the fraction would be 25%.  The actual values are mostly less than 0.1% for 960mb, and much smaller for lower thresholds.


Clearly ERA5 shows a significant increase in the frequency of strong storms in 1977, which coincides with the well-known change into the positive PDO phase in late 1976 (sometimes known as the great Pacific climate shift).  Since then, it appears there has not been a significant trend, but interestingly the last two years had a relatively high number of 940mb and 950mb storms.

Looking north to the Arctic, and using a higher MSLP threshold of 980mb, it's interesting to see that the same contrast emerges between the trends starting in 1950 versus 1979.  Click to enlarge:


This deserves more investigation: did Arctic cyclones also respond to the PDO shift?  A basin-wide Arctic analysis is hampered by the fact that storms are typically far stronger on the European side of the basin, so I'll have to think about the best way to deal with that.  But in the meantime, a subregion of the Arctic on the Alaska side shows generally higher frequencies since 1979 - see below.


Note that it's distinctly possible that the ERA5 reanalysis has a discontinuity in 1979, because the 1950-1978 data is a "back extension" that does not benefit from satellite data; perhaps that influences the intensity of cyclones in the model, although I suspect it's unlikely to explain the differences seen here.