Objective Comments and Analysis - All Science, No Politics
Primary Author Richard James
2010-2013 Author Rick Thoman
Saturday, May 17, 2025
Wind Trends
Saturday, April 19, 2025
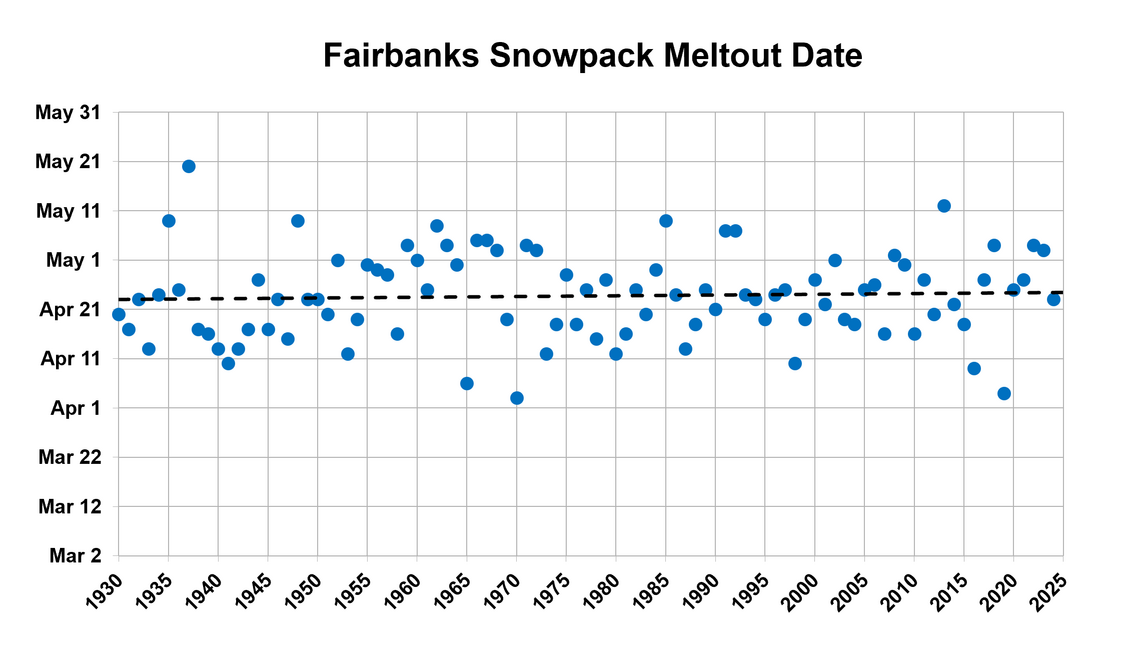
Trends in Meltout Date
The snow is going quickly at valley-level around Fairbanks, more quickly than expected, as there were several very warm days in the past week. Thursday's high temperature of 58°F was nearly a record high for the date, and the daily mean temperature of 46.5°F was very nearly the earliest on record for such warmth. Today's official measurement of snow depth for Fairbanks is 10 inches, down from 21 inches a week ago.
It's interesting to observe that there's no significant long-term trend in the date of meltout in Fairbanks. Meltout is defined here as the first date with zero snow or a trace of snow on the ground, where a "trace" means less than 50% area snow cover OR more than 50% but too little to measure (less than 0.1 inches).
The absence of long-term trend is more than a little surprising in view of the fact that average temperatures have risen substantially at this time of year:
There may be several possible reasons for this discrepancy, but digging into them is a topic for another day. Two obvious possibilities are (a) snowpack water content has increased, offsetting the increased warmth; and/or (b) changes in measurement location and/or method have influenced the meltout dates. The measurement location certainly has changed a few times, most recently just a few years ago when (I believe) the location changed from the airport to the university's West Ridge campus.
But on to the main topic of today's post. I was interested in a spatial view of meltout trends across Alaska, so I used ERA5 reanalysis data to take a stab at this. First I examined whether ERA5 is able to capture year-to-year variability in meltout for two locations with reliable long-term snow depth data: Fairbanks and Bettles. The results are quite encouraging, with correlations of 0.86 (Fairbanks) and 0.89 (Bettles) since 1950.
Note that I used slightly different definitions of ERA5 meltout for the two locations, based on trial and error. For Fairbanks I found that the correlation of ERA5 and observed dates is best when "ERA5 meltout" is defined as the date when ERA5 snow water equivalent (SWE) drops below 0.5cm (liquid equivalent), whereas for Bettles a threshold of 1.0cm works slightly better. Encouragingly, not only are the year-to-year correlations optimized at these thresholds, but the average dates line up too, i.e. the ERA5 dates are not systematically earlier or later than the observations. This in itself is quite surprising; I frankly did not expect the model to do this well.
(Note that using zero SWE for ERA5 meltout is not reasonable, because the ERA5 grid cells are almost 20 miles wide and include higher elevations where snow lingers much longer.)
It's interesting to see that, unlike the official Fairbanks observations, ERA5 shows a substantial trend towards earlier meltout in the Fairbanks area. The ERA5 result is perhaps more like what we would expect in response to the temperature trend; so this does make me wonder about the representativeness of the historical snow cover record from Fairbanks. In Bettles the ERA5 trend is less than at Fairbanks, and it's also closer to the "ground truth" trend.
Finally, having established that 0.5cm SWE is a reasonable threshold for ERA5 meltout, here's a map of the ERA5 trend across the state.
A 75-year trend of 1-2 days/decade is widespread across central, western, and northern regions, corresponding to about 1-2 weeks of change since 1950. However, more rapid trends are evident in southern areas. Note that I have only calculated the trend in locations where the ERA5 snowpack reached at least 0.5cm in every year, and I also excluded locations where meltout did not occur by July 1 in any year; so the analysis is only for areas with a completely reliable late winter snowpack that then always melts out before summer.
Here are maps for North America and for the Northern Hemisphere, using the same 0.5cm SWE threshold for meltout (and I don't know how well that works in other regions). Click to enlarge. There are a couple of small zones with slightly positive trends: in interior northern Canada and in far northern Finland. But overall the picture is one of dramatically earlier meltout, especially in the more southern latitudes.
Wednesday, July 19, 2023
Temperature Comparison at Utqiaġvik
Way back in 2014, I posted some analysis of temperature differences between the airport and CRN sites in Alaska's northernmost town, Utqiaġvik (formerly Barrow). With more than 20 years of climate data now in the books from the CRN site, I thought it would be interesting to revisit this - and in particular, to take another look at the apparent warming trend in the town's temperature relative to the outlying CRN site.
Here are the previous posts:
https://ak-wx.blogspot.com/2014/08/barrow-area-temperatures.html
https://ak-wx.blogspot.com/2014/08/barrow-area-temperatures-part-2.html
The locations of the two thermometers are indicated here:
First, let's confirm the close correspondence between the instruments at the two sites on a monthly mean basis:
No concerns there. As noted and discussed in the previous posts, daily maximum temperatures tend to be most different between the two sites in summer, and for daily minimum temperatures the greatest differences are found in winter. In both cases, the airport is usually warmer than the CRN site. Systematic differences are least in autumn, when there's relatively little land-sea contrast in temperature.
The following charts provide another perspective on the overall relationship between temperature and temperature difference.
Now for the trend over time - see below. Interestingly, there does seem to be a small but statistically significant increase in the temperature difference between the two sites, with the airport ASOS becoming progressively warmer than the CRN site.
How does the trend vary over the course of the year?
Interestingly, the trend in temperature difference is not confined to one season, but appears throughout the year, although with some variability. This seems to suggest it is indeed a systematic trend at the local level rather than a trend caused by changing weather patterns at a certain time of year.
The largest trend has occurred for minimum temperatures in summer, and the charts below provide another perspective. For the minimum temperatures (blue lines), there's a slight but perceptible tendency for relatively cooler CRN temperatures in recent years. The maximum temperatures are less affected, except in June.
What do we make of this? Occam's Razor suggests that the growth of the town is producing a gradually increased urban heat island effect. In my 2014 post, I speculated that urban warming was unlikely to be the cause, because the Utqiaġvik population had decreased in the 2010 census; but the 2020 census reversed that trend, taking the population to an all-time high of about 4900. This is a modest but perhaps significant increase of 8% in 20 years.
How significant is the divergence in temperatures compared to the overall long-term warming trend? Well, two decades is not a long time in climate terms, but based on this limited history, the linear trends in annual mean temperature differ by about 15%.
This difference isn't remotely enough to alter the picture of rapid Arctic warming,
but nevertheless it does illustrate the value of having a long-term climate monitoring program that's designed to avoid problems of instrument and site changes. In other words, I'm a big fan of the CRN program.
Friday, June 23, 2023
Temperature Trend Follow-Up
While the topic is still fresh in my mind, I did some follow-up on Wednesday's question about whether the ERA5 temperature trends are realistic for Southeast Alaska. Specifically, I wanted to compare the ~9km resolution ERA5-Land data to the ~30km ERA5 reanalysis.
According to ECMWF, ERA5-Land "adds value to ERA5 surface fields and provides users with a more accurate dataset for surface applications. The impact can be particularly important over complex terrain, where accurate orography is very important."
This sounds promising for Southeast Alaska. Here's a visual comparison of the 1957-2021 linear trend in 2m temperature from the two sources: ERA5 on top (the data I looked at on Wednesday) and ERA5-Land below.
Clearly the ERA5-Land trend is smaller overall in this region, and it does not reach such high values in some of the areas of high terrain. Also, the ERA5-Land trend values are obviously much lower over the coastal islands of Southeast Alaska.
Here's the elevation versus trend analysis for all grid cells within the Panhandle climate divisions: ERA5 on top, ERA5-Land below.
The highest trends are significantly lower for ERA5-Land than for ERA5, and the lowest elevation grid cells have trends that are quite consistent with the results from the climate divisions (~0.16°C/decade) and from Sitka and Juneau (0.14 and 0.26°C/decade). Contrast this with the area-average ERA5 trends of 0.44-0.55°C/decade for the Panhandle climate divisions, as presented in the new paper by Ballinger et al.
In my view, these ERA5-Land results strengthen the argument that the coarse-resolution ERA5 data produces unrealistic trends for Southeast Alaska as a whole, and especially if we're interested in the low elevations where most people live. Given the obvious shortcoming of the coarse ERA5 data, and the likelihood that ERA5-Land still isn't quite right, I think we should accept the NCEI climate division trends as more representative of reality, especially for inhabited locations; and arguably then inhabited Southeast Alaska may have the smallest warming trend of anywhere in Alaska.
Here's a comparison of the ERA5 vs ERA5-Land linear trends for each climate division: the ERA5-Land trends are slightly higher for the west and interior, but much lower for the Northeast Gulf and Panhandle divisions.
| Division | ERA5 | ERA5-Land |
| North Slope | 0.55 | 0.55 |
| West Coast | 0.37 | 0.39 |
| Central Interior | 0.35 | 0.36 |
| Northeast Interior | 0.38 | 0.41 |
| Southeast Interior | 0.28 | 0.32 |
| Cook Inlet | 0.31 | 0.30 |
| Bristol Bay | 0.34 | 0.32 |
| Northwest Gulf | 0.26 | 0.25 |
| Northeast Gulf | 0.37 | 0.31 |
| North Panhandle | 0.55 | 0.41 |
| Central Panhandle | 0.49 | 0.32 |
| South Panhandle | 0.49 | 0.32 |
| Aleutians | 0.20 | 0.19 |
And finally, a statewide comparison in map form:
Wednesday, June 21, 2023
New Paper on Climate Trends
A new study was published a couple of weeks ago, documenting the changes that have occurred in temperature, precipitation, snowfall, and sea ice around and across Alaska since 1957:
Alaska Terrestrial and Marine Climate Trends, 1957–2021
Rick Thoman, founder of this blog, is one of the co-authors.
The paper provides a nice summary of the main climatic changes over the 65-year period, and I recommend taking a look.
The two key data sources for the analysis are the ERA5 reanalysis and the NOAA/NCEI climate division data, the same two sources that I often use to look at monthly and seasonal anomalies. Both sources have their advantages and drawbacks. In principle, it's more appealing to use "ground truth" data from climate observing sites (the NCEI or "ACD" data), but in practice the scarcity and quality of Alaska's climate observations are so problematic that the ERA5 (modeled) data is sometimes preferable.
In terms of climate trends, one of the more eye-catching discrepancies between the two data sources is the disagreement regarding temperature trends for Southeast Alaska. Here's Figure 3 from the paper (click to enlarge):
Remarkably, ERA5 shows a 65-year temperature trend that's about 3 times the NCEI trend for the Panhandle climate divisions. The paper notes this discrepancy in passing, commenting "topographic complexity presents challenges for regional trend estimates", but no further investigation is performed. The authors seem to accept the ERA5 values as more realistic, as the article's abstract and conclusions cite the very large trends in the North Slope and North Panhandle regions.
I decided to look into this a bit more. The figure below illustrates the discrepancy for the North Panhandle climate division in particular.
The two data sets show a drastic difference in trend, and it's fairly consistent over time, i.e. not obviously caused by a few "bad" years in one of the sources.
Here's a look at the annual data from two key sites in Southeast Alaska: Sitka and Juneau - see below. The trends at these sites tend to support the NCEI (ACD) result, with much less warming than ERA5. In particular, the relatively warm years of the late 1950s and early 1960s are on par with the modern climate, whereas the ERA5 data shows much cooler conditions in the earliest years of this analysis period.
A map of the ERA5 trend gives a hint as to what might be going on.
Notice that ERA5's 2m temperature trend over the Gulf of Alaska is small - less than 0.2°C/decade generally, and around 0.1°C/decade near the Alaska Panhandle. But over the Panhandle itself, the trend is very high - locally in excess of 0.6-0.7°C/decade.
Given that the ERA5 resolution of 31km is far too coarse to resolve the complex topography of southeastern Alaska, the ERA5 temperature represents modeled averages over grid cells with a mean elevation well above sea level. In contrast, the NCEI trends are derived from climate observing sites, most or all of which are very near sea level. Therefore it's hardly fair to expect consistency between the two sources: ERA5 is most definitely not modeling conditions at sea level.
Digging a little deeper still, I pulled out the temperature trends for every ERA5 grid cell that has more than half of its area within the Panhandle climate divisions. The following chart illustrates the relationship between trend and grid cell elevation.
While the overall correlation is not particularly strong, the very lowest elevation grid cells have easily the smallest temperature trends, and all of the trends above +0.6°C/decade are found for grid cells at more than 400m elevation. This supports the idea that sea level sites in the Panhandle have not in fact experienced the drastic warming that the ERA5 data suggests at first glance.
Out of curiosity, I also calculated the ERA5 temperature trends in the "free atmosphere" at 925mb and 850mb, i.e. about 2500 and 4500 feet above sea level, depending on the time of year. (In locations where the land surface is above these pressure levels, the model fills in the data with an extrapolation as if the ground were not there, just for convenience/completeness.)
The temperature trends over Southeast Alaska are much smaller aloft, and there's also much less contrast between ocean and land, as we would expect. Evidently, then, ERA5's very large surface temperature trends in the complex terrain of Southeast Alaska (and nearby western Canada) are not just a reflection of high temperature trends in the free atmosphere aloft.
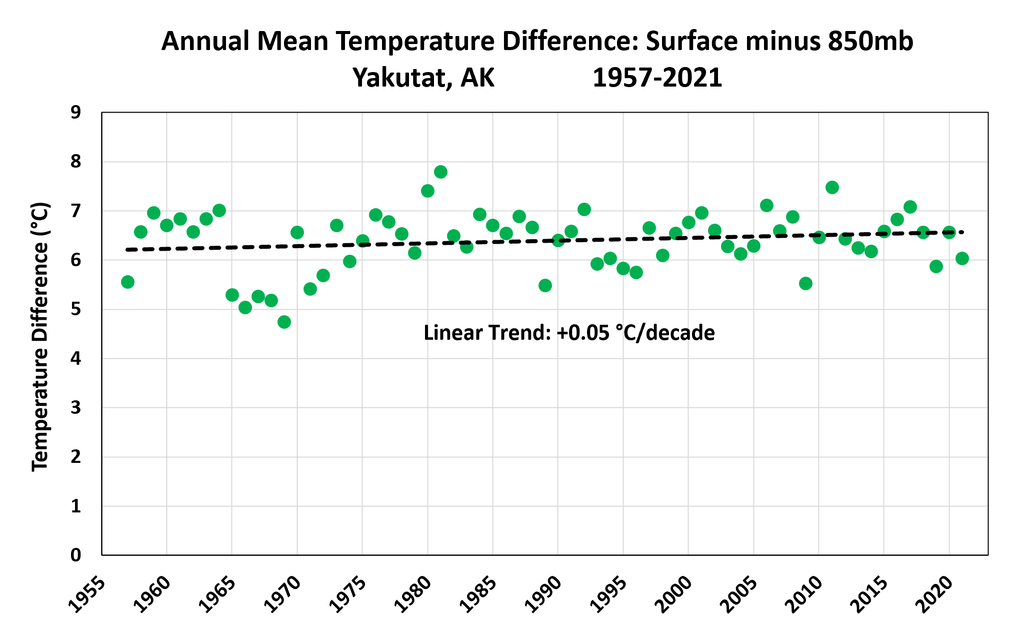
Finally, to confirm that nothing surprising is going on with the trends aloft, I used sounding data from Yakutat to look at the temperature difference between the surface and 850mb. There's a slight but insignificant upward trend:
In conclusion, I think there's a serious question as to whether the long-term temperature trends are realistic in the ERA5 2m temperature data for Southeast Alaska. It is possible that there has been drastic warming at the higher elevations and that ERA5 is capturing that properly with its coarse grid cell averages, but the ERA5 2m temperature trends do not appear to correspond to either sea-level trends or free-atmosphere trends.
Next steps in this investigation might be:
- Look for long-term "ground truth" temperature data at relatively high elevation in Southeast Alaska; there might not be any.
- Examine the ERA5-Land data, which is a downscaled version of ERA5 at 9km resolution. This might have a better chance of reproducing trends in the complex terrain.
Friday, February 18, 2022
Cyclone Trends
I'm in the middle of a busy season and unable to post much, but some readers may be interested in a bit of historical analysis that I did the other day in response to a Twitter query about North Pacific low pressure systems. Are North Pacific winter cyclones becoming stronger?
There are probably dozens of ways to look at this question, but I used the ERA5 reanalysis to add up the number of hours below several MSLP thresholds at each location, by year, from 1950-2021. I then calculated a linear trend for the number of hours, for example:
This shows that much of the basin has seen an increase in time spent below 960mb, which is a threshold that represents a moderately strong extratropical cyclone for this part of the world. Gray areas on the map have less than 10 years in which the MSLP dropped below 960mb, so the sample size is much too small to draw a trend.
However, the trends since 1979 are mixed, showing that there hasn't been a robust basin-wide trend in the past 40 years.
For a basin-total view, here's a look at the annual area-time fraction below 960mb, 950mb, and 940mb. To understand this metric, consider that if the entire area were below 960mb for 50% of the year, the annual area-time fraction would be 50%. Alternatively, if 50% of the area were below 960mb for 50% of the year, the fraction would be 25%. The actual values are mostly less than 0.1% for 960mb, and much smaller for lower thresholds.
Clearly ERA5 shows a significant increase in the frequency of strong storms in 1977, which coincides with the well-known change into the positive PDO phase in late 1976 (sometimes known as the great Pacific climate shift). Since then, it appears there has not been a significant trend, but interestingly the last two years had a relatively high number of 940mb and 950mb storms.
Looking north to the Arctic, and using a higher MSLP threshold of 980mb, it's interesting to see that the same contrast emerges between the trends starting in 1950 versus 1979. Click to enlarge:
This deserves more investigation: did Arctic cyclones also respond to the PDO shift? A basin-wide Arctic analysis is hampered by the fact that storms are typically far stronger on the European side of the basin, so I'll have to think about the best way to deal with that. But in the meantime, a subregion of the Arctic on the Alaska side shows generally higher frequencies since 1979 - see below.
Note that it's distinctly possible that the ERA5 reanalysis has a discontinuity in 1979, because the 1950-1978 data is a "back extension" that does not benefit from satellite data; perhaps that influences the intensity of cyclones in the model, although I suspect it's unlikely to explain the differences seen here.