Showing posts with label Solar Radiation. Show all posts

Monday, August 22, 2022

Late Summer Solar Loss

A couple of days ago, renowned climatologist Brian Brettschneider posted a chart illustrating the rapid loss of solar radiation at high latitudes by this point in late summer.  It's a dramatic difference from lower latitudes and explains the acceleration of the jet stream and a tendency for rainier weather in late summer in much of Alaska (read more on that here).


Brian's graphic uses the Bird Clear Sky Model to estimate the normal solar radiation under idealized clear sky conditions.  This is useful, but I thought it would also be interesting to compare the model to real-world data from Alaska's CRN sites.  See below: the individual points show the drop-off in normal solar radiation from 19 CRN sites that have at least 5 years of data.


There's a fair bit scatter in the CRN results, partly because the seasonal variation in cloud cover differs among the sites, and partly because my estimated normals are based on different numbers of years.  Overall the Bird result is confirmed: solar radiation drops off more rapidly at higher latitude, but it's also clear that the model underestimates the drop-off more significantly for the Arctic sites.  In particular, the Utqiaġvik CRN, with nearly 20 years of data, actually sees a 62% loss of solar radiation, compared to a modeled loss of only 42%.

Why the more drastic loss of radiation in the real world for most of the sites?  Surely a major reason is that cloud cover increases between June 21 and August 21 for most (perhaps all) of the sites; but I think also the very existence of cloud cover means a more rapid loss of energy as solar angle decreases, because of the geometry of cloud shadowing.  For instance, a layer of stratocumulus with, say, 70% sky coverage, would produce cloud shadows over 70% of the land surface when the sun is directly overhead, but nearly 100% when the sun is low on the horizon.

The highly maritime climate of Utqiaġvik then becomes clear when we consider that the seasonal normal temperature has dropped only 2.5°F from its summer peak by August 21.  In contrast, Fairbanks has cooled by over 8°F already, despite losing "only" 39% of its daily solar input.

Friday, May 27, 2022

Radiation Trends

A few weeks ago I wrote about the normal seasonal cycle of infrared radiation that plays such an important role in the climate of Fairbanks (and everywhere else on the planet).  My real goal in looking at the radiation data was to examine the long-term trends: how much has longwave radiation changed in association with the rise in average temperatures?  And are there any notable changes in shortwave (direct solar) radiation?  (Apologies to those who find this an arcane topic, but at least one reader thought the last post was "fascinating"!)

Let's start with shortwave radiation, i.e. sunshine.  Here's a chart of the 12-month running average, both downward (red) and reflected upward (blue), and the net gain at the surface (black).  Recall that we're looking at data from the ERA5 reanalysis: it's a model, not pure observations, but the model is heavily constrained by satellite data and other inputs.


The shortwave annual means tend to jump up and down in summer because that's when solar radiation is by far the greatest; so an unusually sunny or cloudy month in summer can shift the 12-month average quite a bit.

As for trends, there is no significant trend in downward shortwave radiation, but according to ERA5 there is a decreasing trend in the reflected upward shortwave, particularly in the last 15 years or so.  Since 2007, the total upward shortwave radiation has been 7% lower than from 1950-2006.  This is significant, and I'll comment more below.

With incoming sunshine virtually unchanged and a decrease in reflection, the net gain of shortwave energy has increased slightly, but the change is a much smaller fraction of the average gain: only about a 1% increase since 2007 (for example).

How about longwave radiation?  As a reminder, longwave energy fluxes are a lot larger than shortwave, because they occur both day and night.  Longwave radiation is closely linked to average temperature, so it's no surprise to see a clear upward trend in both downward and upward fluxes: see below.  The downward flux is governed by the temperature and humidity of the air, and the upward flux is controlled by the ground temperature.


Notice the big jump in both upward and downward fluxes in 1976, when the Pacific climate regime (PDO phase) suddenly changed and Alaska warmed up dramatically.  Another significant increase in temperature and longwave fluxes has occurred in the past decade.

However, despite highly significant trends in the upward and downward components of longwave radiation, there has been absolutely no trend in the net longwave.  At first glance this is surprising to me: despite a warmer atmosphere aloft, with higher water vapor content and steadily increasing CO2, there has been no net gain in longwave energy at the surface.  This is because surface longwave emissions have increased by just the same amount (due to surface warming).

Let's look at the monthly breakdown of linear trends over the 72-year history of ERA5 data.  Every month has seen an increase in longwave fluxes, with the trends being statistically significant in more than half of the months.  The greatest trend has been seen in December:


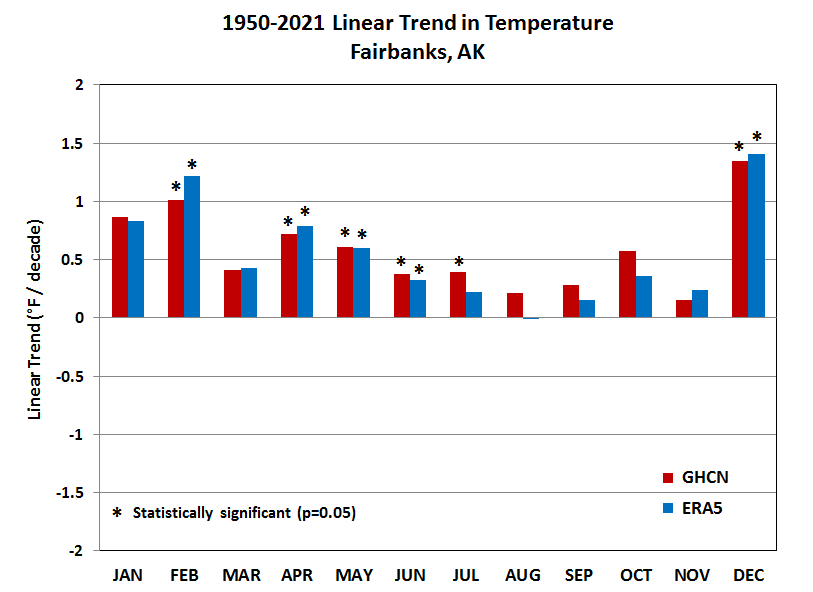
The month-to-month variation in trends corresponds to the monthly temperature trends: compare the charts above and below.  For the temperature trends below, I'm showing both ERA5 model data and GHCN station data from Fairbanks, and the agreement is mostly very good.  Curiously, the trends oscillate up and down from one month to the next in the cold season: October, December, February, and April have warmed relatively quickly, but September, November, January, and March have warmed less.


The greatest warming trend has been seen in December, but again there's no change in the net longwave: the upward and downward fluxes vary in lockstep depending on temperature, and the trends are equal.

Interestingly, August stands out as having different longwave trends, with downward longwave having increased much more than upward longwave, and consequently there is actually a statistically significant change in the net longwave for August (the only month for which this is true).  According to ERA5, this has occurred via a significant increase in August cloudiness, so that the surface has failed to warm over the decades (and thus upward emission hasn't increased), while increased temperatures and humidity aloft have produced more downward longwave radiation.

Here are the shortwave monthly trends, with the August change standing out very clearly: August has become considerably more cloudy, at least according to the model.  The loss of direct solar input is larger than the net gain of longwave radiation, so August has seen a net loss of radiative energy, and this is consistent with the relatively small warming trend in that month.


The other month with a big change in the radiation budget over the decades is obviously April.  In this case Fairbanks has seen a statistically significant net gain of energy caused by a decrease in reflected shortwave radiation.  It doesn't take too much thought to figure out why this is: the surface albedo has decreased as long-term warming has shifted snow melt to earlier dates, so that bare trees and bare ground have emerged earlier in recent decades.  This is obviously a positive feedback, as the darker surface means more absorption of shortwave energy and therefore more warming.

The chart below shows the annual variation in the April fluxes: cold Aprils with prolonged snow cover (like 2013) show up with higher upward (reflected) shortwave and lower net shortwave absorption (black line), whereas warm Aprils like 2016 have low reflection and high absorption.


Notice that the April change in surface characteristics also shows up in the longwave trends (reproduced again below for clarity): with the surface warming more than the air aloft, there's been a net loss of longwave energy in April, but this only offsets about a third of the net gain from shortwave absorption.


The April change is easily the most significant shift in the overall radiation budget for Fairbanks, and it accounts for nearly all of the annual net gain in radiative energy at the surface.  In total, the annual surface energy gain (which is positive, as the last post showed) has increased by about 0.4% per decade, and again this is almost entirely because of the large change in April.

I'll stop here and invite comments from interested readers (if there are any).  And for a later follow-up, perhaps I'll look at the spatial distribution of some of these changes across the state.


Thursday, April 28, 2022

Radiation Normals

Recently I've been taking a look at the (infrared) radiation climate for Fairbanks, based on data from the state-of-the-art ERA5 reanalysis.  I suppose that many people may find it a rather abstract topic, but to me there's nothing more relevant in the world of weather and climate than radiation, and particularly the long-term trends thereof.  After all, solar radiation ("shortwave" radiation) is the fundamental driver of weather, and the imbalance between incoming and outcoming radiation controls weather and climate variations on many time scales.

The chart below shows the monthly normals for the familiar shortwave radiation budget near Fairbanks, according to ERA5.  Solar input (red columns) is close to zero in November through January, it rises quickly in spring under relatively clear skies, and then its decay in autumn is more gradual because increased cloud cover in July and August brings a premature decline (e.g. July has more daylight than May, but much more cloud cover).


The blue columns show the normal upward (reflected) shortwave radiation at ground level, and this peaks in April because most of the month is usually snow covered under relatively strong sunshine.  However, the albedo (i.e. the fraction of incoming solar radiation that's reflected) does drop off markedly in April as snow disappears from trees and eventually from the ground, and it remains near 0.1 until October, when snow cover typically returns.

This much is pretty straightforward to understand.  However, the longwave radiation budget is less intuitive, and in particular it can be a surprise to see that the rate of energy transfer for both incoming and outgoing longwave radiation is much greater than for shortwave - see below.  Probably not many of us would guess that much more radiation is warming us from the sky above than we receive directly in the form of sunshine, even in summer.  Of course this is largely because we're bathed in longwave radiation at all hours of the day and night (emitted by clouds and the atmosphere), with little change from hour to hour, but intense sunshine is confined to only a portion of the day.


But although the incoming longwave is large, the outgoing is even larger at all times of the year, because the ground temperature is higher than the average emitting temperature of the clouds and air above.  The longwave radiation flux is proportional to the fourth power of temperature, so both upward and downward components track very closely with the seasonal temperature cycle.  The only obvious departure from a simple seasonal cycle that I can see is that the downward flux doesn't increase from January to March as quickly as the upward flux, and that's because the surface warms up more quickly than the air aloft (and also because the air stays very dry well into spring - water vapor is very efficient at absorbing and emitting these wavelengths).

So we have a net loss of longwave energy at all seasons, and a net gain of shortwave in all but winter.  What does the overall net look like?


Here we see that there's a net gain of radiative energy from March (barely) through September, and a small loss from October through February; and overall it's a significant gain over the course of a year, which is perhaps a bit surprising at a latitude of nearly 65°N.

Now someone may ask why the temperature in Fairbanks drops so dramatically in the early autumn when there's still a net gain of radiation - even in September, according to ERA5.  The answer is that this radiation budget pertains to the ground surface, not the air above.  The atmosphere doesn't absorb or emit shortwave radiation, so the longwave balance is the only thing at play - and consider that the atmosphere only gains longwave energy from below, while it emits it both downward to the ground and upward to space.  This implies a significant net radiative loss for the atmosphere year-round, and when heat transfer from the surface (by mixing/convection) drops off in the autumn, there's nothing to stop the air from cooling rapidly.

In another post I'll take a look at long-term trends in the different radiation components.

Thursday, February 27, 2020

Solar Power in Alaska

Last week an article about solar farms in Alaska caught my eye:

https://www.bbc.com/future/article/20200219-the-solar-farms-fighting-climate-change-in-alaska

The discussion indicates that despite the obvious shortcomings of solar power generation in a place that receives so little sunshine during the season of peak energy demand, the cost of solar panels has come down enough to make it worthwhile to install solar farms anyway.

The BBC article also states that, "perhaps surprisingly, Alaska is a sunny place", and cites a 2015 piece by Brian Brettschneider to back up this claim.  However, the BBC author unfortunately made an unwarranted jump from daylight to sunshine; while it's true that year-round daylight totals are actually greater in Alaska than points farther south, the total amount of solar energy is nowhere near as great.

https://www.adn.com/science/article/sunniest-day-year-look-why-alaska-has-most-daylight/2015/06/20/

This distinction raises an interesting question, however: do the long daylight hours and relatively clear skies of early summer produce enough solar energy to be competitive with locations in the Lower 48?  To take a quick look at this, I used data from the CRN sites that have been running since 2002 near Fairbanks and since 2010 on the Kenai Peninsula, and I compared total solar energy in May through July to 3 sites in the central and eastern U.S.

First, here's the average rate of solar energy input available at the surface, based on the full period of record at each site (15-17 years except for 9 years at Kenai).  The two Alaska sites receive less energy despite having much longer daylight hours, but the difference is not huge, and this reflects the point of the BBC article - that there's plenty of solar energy to be harnessed in Alaska for part of the year.  Click to enlarge:


The shortfall in total energy despite longer daylight hours is a function of both cloudiness and solar elevation angle.  The chart below illustrates the cloudiness aspect by showing how much of the clear-sky maximum is received at each location.  On the Kenai Peninsula, most summer days are fairly cloudy, and even in the relatively sunny interior, 6 out of 10 days have enough cloud to keep solar radiation at less than 70% of maximum.  In contrast, 6 out of 10 days have more than 70% of maximum in my neck of the woods (Georgia).


So while solar power does have fairly good seasonal potential in Alaska, even the long daylight hours of summer are not enough to make it fully competitive with the rest of the U.S.