Showing posts with label Winter Rain. Show all posts

Saturday, January 25, 2025

More Rain and Ice

The superlatives continue to be in demand when discussing the impacts of the "atmospheric river" that is affecting interior and southern Alaska.

First, to highlight the extraordinary strength of the winds across the North Slope yesterday, Rick Thoman notes that both the maximum sustained and peak gust wind speeds measured in Utqiaġvik were the highest on record:


In other news from yesterday, an avalanche closed the Parks Highway for about 24 hours near Cantwell:


Today Fairbanks and Nenana saw another 10-12 hours of rainfall, although very light in Fairbanks, but farther to the west and north (Tanana, Fort Yukon) the temperature dropped enough for snow instead of rain.

To the southwest along the nearly stalled frontal boundary, prolonged freezing rain has been occurring; McGrath seems to have suffered a major ice storm.  A simple animation of photos from the McGrath FAA webcam shows trees and bushes becoming increasingly weighed down by ice today - look closely at the vegetation on the lower left (click to enlarge):


Remarkably, the storm total precipitation in McGrath has exceeded 2 inches, and it appears this will be the greatest 2 or 3-day precipitation total on record in the winter months for McGrath; the record 3-day total for December through February is 2.1" in December 1990.  Over in Talkeetna the 72-hour total of 3.38" appears to be second only to a December 1999 event (4.13" in 3 days).

This morning's 500mb chart (see below) shows the same powerful southwesterly flow over southwestern Alaska, and it illustrates clearly the deep southern origin of the warm, moist air.  The ridge anchored over the northeastern Pacific is really the key feature, and it's very reminiscent of events from 10-12 years ago, when the "ridiculously resilient ridge" set up shop in the same region.

Friday, January 24, 2025

Historic Winter Rain

Extraordinary and historic winter rain has been occurring today across a large swath of interior Alaska extending all the way up to the Yukon Flats and the southern edge of the Brooks Range.

This blog has documented many instances of winter rain in Fairbanks, but this is something else.  In data extending back to 1948 (albeit with one missing decade from 1964-1974), Fort Yukon has only reported plain rain (i.e. with a temperature above freezing) in November through February on two occasions, and that briefly: a single report of light rain and 33°F on January 22, 1962, and a report of light rain with 35°F on Christmas Eve, 1985.  But today it rained from 4:15am through 10:30am, and then it began again at 3pm; it's still ongoing as of 6pm, and the temperature has been as high as 39°F.

Rain has also been reported in Bettles, Fairbanks, Tanana, and of course points to the southwest, where the moisture is coming from.  The following map shows 12-hour precipitation totals (inches) as of 5:30pm, and it appears these represent mostly or entirely rain, at least at lower elevations.  Click to enlarge:


Two of the sites with higher totals are the Livengood (1.24") and Chalkyitsik (1.06") RAWS, and the hourly observations look very plausible:


Webcam images from Chalkyitsik show that it certainly wasn't snowing, and snow can be seen melting off a roof in the course of 3 hours (lower right, click to enlarge):


Incredibly, it was simply a rainy day across the central and northeastern interior.  And NWS Fairbanks expects it to continue; they say "an additional 0.5 inches is expected to fall through Sunday" (in Fairbanks).

What can explain such an amazing departure from normal?  Here are the 500mb and MSLP charts from 3am this morning:


These show a very pronounced pressure gradient and intense southwesterly flow between the deep trough over far eastern Russia and a powerful ridge over the northeastern Pacific.  Warmth and moisture have been transported quickly to interior Alaska from deep in the subtropics.  We also see that the flow aloft is oriented from southwest to northwest, rather than south to north, so the moisture makes it into the interior without hindrance from the southern coastal mountains and Alaska Range.

Winds across the North Slope have been extraordinary in their own right: here are the peak wind gusts in mph.


And maximum temperatures across the interior:


In the Fairbanks region, the international airport reached 42°F, Eielson reached 46°F, and Nenana saw 44°F.

For future reference, here are several surface observation maps showing snapshots of weather conditions throughout the day (two or three purple dots to the left of the station indicate rain):


Sunday, February 26, 2023

Snow and Snow Ratio

Fairbanks has seen a fair bit of snow this month, with measurable accumulation on 16 days and a total of 20.6" so far.  The record number of days with accumulating snow in February was set just last year, at 18 days.  The long-term median February snowfall is just 7 inches.  However, we're nowhere near the February 1966 record of 43".

It's interesting to note that this is now the 7th consecutive February with above-median snowfall, including 5 of 7 with over 20".  Remarkably, only 7 of the preceding 87 years (since 1930) had this much snow in February.  It used to be rare - fewer than 1 in 10 years - but is apparently now common.

Last Thursday's snowfall of just under 6" contained nearly half an inch of liquid equivalent, so it was fairly dense stuff by interior Alaska standards.  This got me thinking about snow ratios and the long-term trend thereof.  Is there any evidence that the snow ratio (total snowfall divided by liquid-equivalent precipitation) has changed over time?

Yes, absolutely: the last decade or so has seen generally lower snow ratios than in the previous six decades, and there have been no winters with a historically high ratio (e.g. over 20) since 2009-10.  Last winter had the lowest ratio on record for Fairbanks, only 10.5, and a large reason for that was of course the epic rain storm of Christmas 2021.

It's interesting to see that mostly low ratios also prevailed in the 1930s and 1940s, although I suppose there's a chance that different measuring practices could explain at least some of this.  However, we know there were some notable, indeed extreme, winter rain events in the 1930s, so a regime of low ratios is perhaps not unexpected.

The recent decrease in ratios is more noticeable for November-December than for January-March, although the absence of high ratios clearly stands out for both:

The low ratio in Nov-Dec 2010 reflects the exceptional rain event of that time - as documented here in the early days of this blog:

http://ak-wx.blogspot.com/2010/11/rain-records-again.html

As for the low ratio in January-March 2016, that reflects the extraordinary rain at the end of March, which produced as much precipitation as the rest of the (very dry) 3-month period combined.

A decrease in snow ratio is what we would expect if the atmosphere is warming overall.  Snow tends to be more dense at higher temperatures, and of course increased warmth favors occasional winter rain, which crushes the total snow ratio.

The ERA5 global reanalysis (model) also shows signs of a change since 2010-11, with most years having a lower ratio of total snow water to total precipitation - see below.  This is not the same thing as snow ratio, as it's only affected by the rain vs snow partition, and not by snow density - so the ERA5 is just showing an increased frequency of significant winter rain.  It would be highly worthwhile to look at the spatial distribution of this change in the model data.


Monday, December 26, 2022

Winter Rain

First, a quick comment to recommend Rick Thoman's detailed report on the unusual weather events of the last 7-10 days for many parts of Alaska:

https://alaskaclimate.substack.com/p/alaskas-wild-winter-solstice-week

The deep and sustained cold in the eastern interior has been a key feature recently, as illustrated by Chicken's five consecutive days with high temperatures of -50°F or below and low temperatures of -60°F or below.  Tok had its coldest five-day period since 2012.  But the cold wasn't confined to the interior: Kenai airport recorded a high temperature of -16°F on December 20, which is the coldest day there since the historic cold snap of January 1989.

Rick also documents the extremely high winds in disparate parts of southern Alaska, extreme rain in the Aleutians, and an absence of sea ice in the northern Bering Sea.

Turning to another topic, earlier this month I noted the record warmth and widespread rain in western and Arctic Alaska.  I subsequently spent a bit of time examining observations from most of the ASOS/AWOS sites in northwestern Alaska and along the Arctic coast, and indeed nearly all of them reported rain at some point between December 2 and December 5.  Utqiaġvik did not get above freezing while it was raining, but I counted 24 other sites that saw plain rain, i.e. rain with temperatures above freezing.  Remarkably, rain was observed even as far east as Barter Island, including a period of 8 consecutive hours of plain rain.

In the past couple of weeks I've been processing ERA5 reanalysis data in an effort to put this event in context and understand the historical trends and variability in winter rain for Alaska and more widely in the Arctic.  The usual caveats apply to the results - the ERA5 data is only an estimate of true conditions on the ground - and frankly I don't know the accuracy/quality of the precipitation type estimates; but it may be possible to say something about the quality in due course.

For now, I'll show a few preliminary results on the historical ERA5 trends, and then in a subsequent post I'll see what ERA5 has to say about the recent event.

First, here's an Arctic-wide map showing the normal (mean) number of hours with rain or freezing rain in November through March for the 30 winters from 1991/92 to 2020/21.  I'm only showing data for areas where the 1991-2020 normal temperature is continuously below -5°C from November 1 through March 31, so we're looking only at cold regions where winter rain would tend to cause significant problems (i.e. rain falling on snowpack and/or deeply frozen ground).


There's a notable climatological maximum of winter rain in southwestern Alaska, and extending northward across the Seward Peninsula and east to the middle Tanana River valley.  Qualitatively this seems correct; Bering Sea storms quite frequently import warm air aloft and/or at the surface to the west and north of the Alaska Range.

Here's the corresponding map for earlier decades: 1950/51 through 1990/91.  The patterns are very similar, but the values are somewhat lower in the earlier years for the Seward Peninsula and northwestern Alaska.


Here are maps showing the change between the two periods, both in absolute (top) and relative/percentage (bottom) terms.


This confirms a fairly widespread increase in hours with winter rain for southwestern and western Alaska, as well as in the parts of Russia where freezing rain is climatologically possible.  On the other hand, however, ERA5 suggests there has been some decrease in frequency for some parts of interior eastern Alaska.

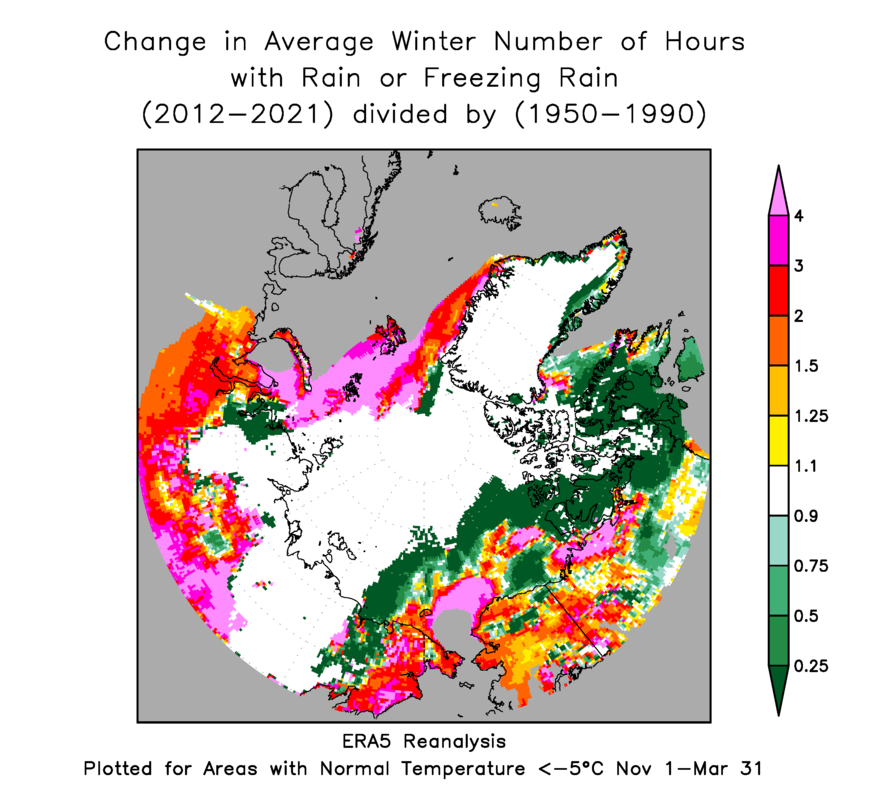
The changes appear to have been concentrated more in the past decade than in (say) 1990-2010.  Here are the corresponding maps comparing 2012-2021 with the earliest 40-year period.


We now see widespread increases across most of Alaska north of 60°N - according to the ERA5 model.

For a sense of the annual variability compared to the trend, I extracted the area-average number of hours of rain for each winter across Alaska's land area north of 60°N (again excluding warmer areas):


The large year-to-year variability means that the trend may not be highly significant - I haven't attempted a statistical test  - but there have been generally elevated values since 2013/14.  Interestingly, though, the period from 1979/80 to 1986/87 also seems to have produced relatively more frequent/widespread winter rain.

For the Arctic as a whole (using 60-90°N land area), the reduced interannual variance allows the trend to stand out a bit more clearly; we see a notably sustained high frequency of rain since winter 2013/14.


As soon as I have a chance, I'll look at this winter so far in the ERA5 data and see whether the model faithfully reproduced the early December event.