The air temperature is much more seasonable across interior and northern Alaska today, courtesy of a strong cold front that pushed its way across the state on Sunday. Here's yesterday morning's 500mb map, showing the associated upper-level low over the North Slope (click to enlarge).
Fairbanks has seen a high temperature of "only" about 17°F today, but this is completely normal for the time of year. It's quite a dramatic change, however, as this is the first day with a sub-freezing high temperature, and prior to Saturday the coldest day had a high of 37°F.
The sudden change to colder got me thinking about the statistics of sudden "one-way" temperature drops in autumn or early winter in Fairbanks. (And let the reader beware - what follows is a rather arcane discussion.) By "one-way" I mean an instance when daily high temperatures drop below a threshold that was not breached earlier in the season, and then the temperature fails to rise back above that threshold at any later date in the same year. For example, as noted above the coldest day in Fairbanks until Saturday had a high of 37°F, but it's possible that we've seen a "one-way" change to colder, as 37°F may not be reached again until the spring. This would constitute a "one-way" drop in high temperatures at the 37°F threshold.
Digging through Fairbanks climate data reveals that this kind of thing is fairly common as a result of the high rate of seasonal cooling; about 30% of all years see a "one-way" change to colder high temperatures at some point in the autumn. The most dramatic was in 1950, when up until September 26 the coldest day had a high of 46°F, but no temperature above 38°F was observed from that date on; that's the largest one-way drop (8°F) that I found.
Here's a chart showing the high temperature thresholds and dates for which these "one-way" cooling events have occurred in Fairbanks. Unsurprisingly, the earliest was in the absurdly cold September of 1992; the latest was in 1942, when the temperature sank below 22°F at the end of October and did not reach that level again in the same year. (Note that I haven't included winter after December 31 in this analysis.)
Looking at a number of other sites in Alaska, the frequency of sudden one-way cooling is highest for the most continental sites and lower for more maritime sites, as we would expect. For example, Anchorage sees such an event in about 20% of years, but Bettles and Northway manage it more often than not at some point in the autumn.
On a related note, it's worth pointing out that Fairbanks has never seen a true one-way temperature drop in which subsequent daily high temperatures never reach the lowest daily low
temperatures prior to the drop. I rather doubt if this has been observed
anywhere in the world, as it would require both an extreme rate of
normal seasonal cooling and an extreme shift in the weather pattern at
the right time.
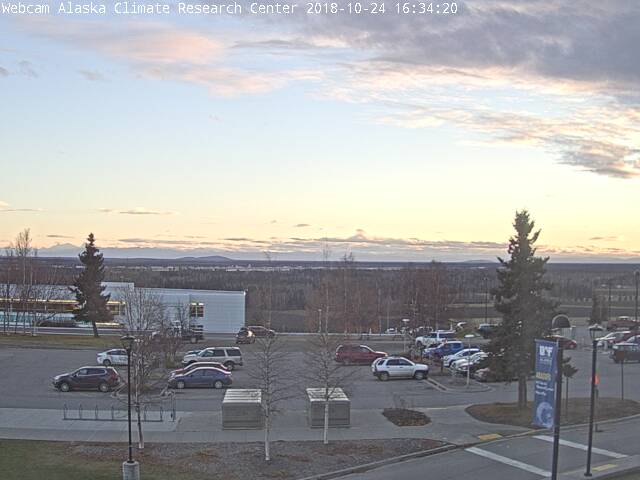
To finish up, here's a pleasing clear-sky scene from UAF this evening just after sunset. Officially the snow cover is still only a "trace" - it hasn't made it up to 1 inch yet.
Objective Comments and Analysis - All Science, No Politics
Primary Author Richard James
2010-2013 Author Rick Thoman
Tuesday, October 30, 2018
Wednesday, October 24, 2018
Excessive Warmth
There's a lot that could be said about the ongoing persistent and increasingly extreme warmth (relative to normal) across much of Alaska, but time doesn't permit more than a brief update at this point.
To illustrate, Fairbanks has seen 3 days in the past week with a high temperature of 50°F or higher - and to put this into context, the 1981-2010 normal high and low temperature for October 24th are 25°F and 10°F respectively. Fairbanks doesn't normally see more than a small handful of days above freezing from this point on, so 50°F is quite extreme.
Today was actually the warmest day in Fairbanks since the first week of the month, with a high of 52°F. This degree of warmth has not occurred so late in the season since the 1930s: it happened in 1934 (the year of the great December chinook) and also in November 1936 and late October 1938. But similar conditions occurred in 2013, of course, with 51°F on October 28.
The map below shows the culprit for today's balmy conditions: a deep southerly flow aloft, leading to downslope warming to the north of the Alaska Range. As we would expect, the middle Tanana River valley was warm and windy today owing to the chinook flow; Delta Junction reported wind gusts over 50mph.
Here's the snowless scene this evening on campus at UAF: a disheartening prospect for winter enthusiasts as well as, more seriously, residents who rely on frozen land and water for important activities.
Here's a comparison of this month's daily mean temperatures to the two other years that were outstandingly warm in Fairbanks in the month of October: 2013 and 1938. No other years have come close to having the same amplitude of warm anomaly for this calendar month. But neither of those years could hold off winter's freeze until the very end of the month; and so surely it is just a matter of a few days now until the landscape is finally transformed.
To illustrate, Fairbanks has seen 3 days in the past week with a high temperature of 50°F or higher - and to put this into context, the 1981-2010 normal high and low temperature for October 24th are 25°F and 10°F respectively. Fairbanks doesn't normally see more than a small handful of days above freezing from this point on, so 50°F is quite extreme.
Today was actually the warmest day in Fairbanks since the first week of the month, with a high of 52°F. This degree of warmth has not occurred so late in the season since the 1930s: it happened in 1934 (the year of the great December chinook) and also in November 1936 and late October 1938. But similar conditions occurred in 2013, of course, with 51°F on October 28.
The map below shows the culprit for today's balmy conditions: a deep southerly flow aloft, leading to downslope warming to the north of the Alaska Range. As we would expect, the middle Tanana River valley was warm and windy today owing to the chinook flow; Delta Junction reported wind gusts over 50mph.
Here's the snowless scene this evening on campus at UAF: a disheartening prospect for winter enthusiasts as well as, more seriously, residents who rely on frozen land and water for important activities.
Here's a comparison of this month's daily mean temperatures to the two other years that were outstandingly warm in Fairbanks in the month of October: 2013 and 1938. No other years have come close to having the same amplitude of warm anomaly for this calendar month. But neither of those years could hold off winter's freeze until the very end of the month; and so surely it is just a matter of a few days now until the landscape is finally transformed.
Saturday, October 20, 2018
No Rain in Yakutat
Hi, Rick T. here with an analysis of one piece of exceptional September we just came through. Specifically, the lack of precipitation on the Gulf of Alaska Coast. One of the most amazing climate statistics to come out of September was from Yakutat, where there was an astonishing 20 consecutive days with no rain at all, not even a sprinkle. Considering that Yakutat averages 24 days in September with some rain and that this streak was several days longer than any previous dry streak this time of year, the question is, just how unusual was 20 straight days with no rain at all?
Richard, Brian and I had a long email string on ways to think about analyzing this event. With their help, here's what I came up with.
First, some background to set the stage.
There are a number of ways to potentially answer such questions, but the one I'll provide here involves our old friend, regression. But rather than linear regression (which obviously is not appropriate), I tried mathematical forms that have the potential to represent what we see in the plot above: large and rapid changes as we move from left to right along the x (horizontal) axis. Two commonly used forms for distributions of this shape are exponential and power law. In order to facilitate this analysis I first converted the raw count values into frequencies per year and then plotted the frequency on a log scale, which results in this:
This is the same information as in first figure, just displayed in a different way. But it allows us to immediately to see that that an exponential fit is not likely to work so well. How do we know that? Well, with the y (vertical) axis plotted in log scale, an exponential fit will appear as a straight line. Just eyeballing the top of the bars, you can see that a straight line will fit pretty well for streaks of 11 days or less, but then fails to capture the handful of events longer duration. For that, a power law fit works out better. Now a well established issue with power law fits is that the often only part of a distribution (typically the right tail) is well represented by a power law. How does that work out in this case? I systematically fitted a power law using the observed frequency of all the streak lengths, i.e. 1 day to 25 days (everything about 20 is zero). Then I fitted a power law to streaks of two days or longer, then three days or longer, etc. The "winner" was the fit that had the lowest root mean squared error but still utilized most of the data (there are more sophisticated ways to do this but I have not had the time to implement them, though in this case will lead to the same answer). It turns out that the best fit was for runs to two or more days and it looks like this:
So based on this analysis, the streak of 20 completely dry days in row has only about a 0.7% chance of occurring in any particular August through October season. I've noted the return period as calculated from the fit on the graphic for selected streaks, though I don't really like to do that because it's easy to misinterpret. Why do it? People like to see it, and in principle it is perhaps a more intuitive way to express low likelihood events. But, it is important to remember that a long return period is the inverse of a very small number, and so small changes in the fit result in big changes in the return period. So if I improve this analysis and come up with probability for a 20-day streak as 0.9% in any given year, that's a small change from 0.7%, but the return period would drop by 40 years, to 111.
So from this analysis, the 20 dry days in a row at Yakutat this September was likely a once in a lifetime event, at least if you're of mature years. After all, 0.7% annual chance of occurrence means that, assuming no change and no year-to-year correlation, that there is about a 30% that this will happen at least once in the next 50 years.
First, some background to set the stage.
- Since I am looking at days with zero precipitation, not even a trace, I used data since 1947, since this is entirely within the Weather Bureau/Weather Service era of 24-hour per day observations and there is no missing daily precipitation data.
- The frequency of precipitation varies seasonally, e.g. May in Yakutat averages twice as many days without any precipitation as October, so we need to limit the analysis to this time of year. Therefore I confined the analysis to the early autumn (August through October) season. I'm also assuming there is no trend in dry days streaks (which is the case for the total number of dry days in ASO).
- For statistical analysis, the independence of events is often an important underlying assumption. So while it's easy to generate simple counts of consecutive days without precipitation, it took a bit more work to find the independent streaks. To illustrate this, a simple count revels that there are two streaks of 19 days with zero precipitation during August through October, 1947 to 2018. However, both of these streaks are simply subsets of the 20-day streak from this past September (Sep 2-20 and Sep 3-21). So removing all the streaks that are simply subsets of longer ones, here's what we find for the counts of independent, non-overlapping streaks of specific lengths:
There are a number of ways to potentially answer such questions, but the one I'll provide here involves our old friend, regression. But rather than linear regression (which obviously is not appropriate), I tried mathematical forms that have the potential to represent what we see in the plot above: large and rapid changes as we move from left to right along the x (horizontal) axis. Two commonly used forms for distributions of this shape are exponential and power law. In order to facilitate this analysis I first converted the raw count values into frequencies per year and then plotted the frequency on a log scale, which results in this:
This is the same information as in first figure, just displayed in a different way. But it allows us to immediately to see that that an exponential fit is not likely to work so well. How do we know that? Well, with the y (vertical) axis plotted in log scale, an exponential fit will appear as a straight line. Just eyeballing the top of the bars, you can see that a straight line will fit pretty well for streaks of 11 days or less, but then fails to capture the handful of events longer duration. For that, a power law fit works out better. Now a well established issue with power law fits is that the often only part of a distribution (typically the right tail) is well represented by a power law. How does that work out in this case? I systematically fitted a power law using the observed frequency of all the streak lengths, i.e. 1 day to 25 days (everything about 20 is zero). Then I fitted a power law to streaks of two days or longer, then three days or longer, etc. The "winner" was the fit that had the lowest root mean squared error but still utilized most of the data (there are more sophisticated ways to do this but I have not had the time to implement them, though in this case will lead to the same answer). It turns out that the best fit was for runs to two or more days and it looks like this:
So based on this analysis, the streak of 20 completely dry days in row has only about a 0.7% chance of occurring in any particular August through October season. I've noted the return period as calculated from the fit on the graphic for selected streaks, though I don't really like to do that because it's easy to misinterpret. Why do it? People like to see it, and in principle it is perhaps a more intuitive way to express low likelihood events. But, it is important to remember that a long return period is the inverse of a very small number, and so small changes in the fit result in big changes in the return period. So if I improve this analysis and come up with probability for a 20-day streak as 0.9% in any given year, that's a small change from 0.7%, but the return period would drop by 40 years, to 111.
So from this analysis, the 20 dry days in a row at Yakutat this September was likely a once in a lifetime event, at least if you're of mature years. After all, 0.7% annual chance of occurrence means that, assuming no change and no year-to-year correlation, that there is about a 30% that this will happen at least once in the next 50 years.
Friday, October 19, 2018
Bering Ridge Wrap-Up
As a postscript to my earlier analysis of the intense ridge over the Bering Sea and western Alaska (see here and here), the charts below indicate the magnitude of the recent 500mb anomaly at 15-day, 30-day, and 45-day time scales compared to the Northern Hemispheric extremes since 1958. As before, we're looking at the standardized 500mb height anomaly, i.e. the departure from normal divided by the standard deviation, and I've removed the (seasonally-varying) long-term linear trend at each location. The charts show the daily maximum and minimum values of the standardized anomaly across the entire Northern Hemisphere since 1958. Click to enlarge the images.
Based on this analysis, the upper-level ridge that affected western Alaska in recent weeks was most anomalous on a 30-day time scale. Remarkably, the 30-day standardized height anomaly at 500mb just to the south of Nome was the most extreme in the global reanalysis history back to 1958, for either Northern or Southern Hemisphere, and for either positive or negative anomalies. Here's a map of the peak 30-day height anomaly:
In the earlier post I noted that the record 15-day ridge was an extreme high-pressure block over northern Greenland in November 1965. But interestingly the record event for a 45-day time scale was also over Alaska, in the late winter of 1989. This event appears to have been related to a major disruption of the stratospheric polar vortex (a "sudden stratospheric warming") in February 1989.
Finally, here's a chart showing Southern Hemisphere extremes on a 45-day basis. The record for most anomalous ridge occurred near the southern tip of South America in the early austral winter (late April - early June) of 2016.
Based on this analysis, the upper-level ridge that affected western Alaska in recent weeks was most anomalous on a 30-day time scale. Remarkably, the 30-day standardized height anomaly at 500mb just to the south of Nome was the most extreme in the global reanalysis history back to 1958, for either Northern or Southern Hemisphere, and for either positive or negative anomalies. Here's a map of the peak 30-day height anomaly:
In the earlier post I noted that the record 15-day ridge was an extreme high-pressure block over northern Greenland in November 1965. But interestingly the record event for a 45-day time scale was also over Alaska, in the late winter of 1989. This event appears to have been related to a major disruption of the stratospheric polar vortex (a "sudden stratospheric warming") in February 1989.
Finally, here's a chart showing Southern Hemisphere extremes on a 45-day basis. The record for most anomalous ridge occurred near the southern tip of South America in the early austral winter (late April - early June) of 2016.
Tuesday, October 16, 2018
Still No Snow
With rain and very mild temperatures today (up to 48°F so far), Fairbanks is moving further into uncharted territory in terms of the lack of any wintry weather so far this season. Today the airport has reported 0.05" of rain and no snow, there's zero snow on the ground, and the temperature seems very likely to stay above freezing through midnight.
Putting aside the lack of snow on earlier dates, there are only two other days in Fairbanks history that meet these conditions at this late date in the autumn: October 23, 1981, and October 28, 2013. In 1981 several inches of snow had fallen earlier in the month and then melted out; the situation in 2013 was more similar to this year, but even then there had been hints of winter's approach with occasional light snow in both September and October. Here's my post from late October 2013: http://ak-wx.blogspot.com/2013/10/record-warmth-again.html
Here are some non-wintry webcam views from Fairbanks-land this afternoon.
Cleary Summit (2200' elevation) on the Steese Highway:
UAF's webcam on the West Ridge of campus:
Ester Dome:
In view of the bare ground, an interesting question to ask is, "How cold can it get without snow cover?" The quick answer is, of course, "Pretty cold"; in December 1934, after the great chinook melted Fairbanks' snow cover, the temperature dropped to -29°F on Christmas Eve with only a trace of snow reported on the ground.
A more comprehensive search for cold conditions with no snow cover is complicated by the fact that Alaska's cooperative observers have often reported zero snow depth in error (instead of new snow amount, for example), and missing snow depth is often recorded as zero. I did find a couple of interesting examples, though. Just a couple of years ago (Nov 2016) the Fort Yukon SNOTEL site reported -36°F with a zero-inch snow depth, and the Fort Yukon RAWS saw -34°F the same day. I don't really trust the snow depth number, however; I suspect there could easily have been an inch or two on the ground.
Perhaps a more credible instance is November 11, 1984, at Chandalar Lake in the Brooks Range, when -33°F was reported with only a trace of snow on the ground. However, in this case a "trace" may just mean "less than an inch", as preceding conditions suggest there might have been a very thin but continuous snow cover.
I haven't investigated to see what Alaska's lowest reported temperature is with zero snow on the ground - if anyone has an idea, please leave a comment!
Putting aside the lack of snow on earlier dates, there are only two other days in Fairbanks history that meet these conditions at this late date in the autumn: October 23, 1981, and October 28, 2013. In 1981 several inches of snow had fallen earlier in the month and then melted out; the situation in 2013 was more similar to this year, but even then there had been hints of winter's approach with occasional light snow in both September and October. Here's my post from late October 2013: http://ak-wx.blogspot.com/2013/10/record-warmth-again.html
Here are some non-wintry webcam views from Fairbanks-land this afternoon.
Cleary Summit (2200' elevation) on the Steese Highway:
UAF's webcam on the West Ridge of campus:
Ester Dome:
In view of the bare ground, an interesting question to ask is, "How cold can it get without snow cover?" The quick answer is, of course, "Pretty cold"; in December 1934, after the great chinook melted Fairbanks' snow cover, the temperature dropped to -29°F on Christmas Eve with only a trace of snow reported on the ground.
A more comprehensive search for cold conditions with no snow cover is complicated by the fact that Alaska's cooperative observers have often reported zero snow depth in error (instead of new snow amount, for example), and missing snow depth is often recorded as zero. I did find a couple of interesting examples, though. Just a couple of years ago (Nov 2016) the Fort Yukon SNOTEL site reported -36°F with a zero-inch snow depth, and the Fort Yukon RAWS saw -34°F the same day. I don't really trust the snow depth number, however; I suspect there could easily have been an inch or two on the ground.
Perhaps a more credible instance is November 11, 1984, at Chandalar Lake in the Brooks Range, when -33°F was reported with only a trace of snow on the ground. However, in this case a "trace" may just mean "less than an inch", as preceding conditions suggest there might have been a very thin but continuous snow cover.
I haven't investigated to see what Alaska's lowest reported temperature is with zero snow on the ground - if anyone has an idea, please leave a comment!
Sunday, October 14, 2018
Persistent Alaska Warmth
Hi, Rick T. here with a quick post of the recent warmth in Alaska. One of the most frequent questions I get from Outside media is something along the lines of "Is it warm in Alaska?" After going through the stock "Alaska's a big place with diverse climates" and then giving some impressionistic answer about a hundred times, I thought that it would be worthwhile to try and come up with an objective way of answering those kind of questions. So, a few years ago Brian B. and I developed a real-time index that could help answer this. If your interested the background on how this index is calculated, read on below the chart.
Up through early September Alaska had considerably more days warmer than normal than cooler than normal in 2018, but periodic cool spells kept the run of warm days at a moderate length. Since early September though the index has been persistently quite high: by construction, index values above +3.3 fall into the "significantly above normal" tercile, and that has been the case every day since September 5th. This is an interesting situation in that the cause of the warmth has varied. For much of September and the first days of October, as Richard has noted here, strong high pressure aloft, first over the Bering and then a bit farther east from the Arctic to the Gulf of Alaska dominated. In the past week the pattern has transitioned to a "Gulf of Alaska" storm track pattern. In different parts of the state this weather pattern change has resulted in changing temperature regimes, but on the statewide scale, it's a nice example of how distinctly different patterns can lead to the same outcome: much above normal temperatures.
Exactly how the index is derived has gone through several iterations but here's the current version.
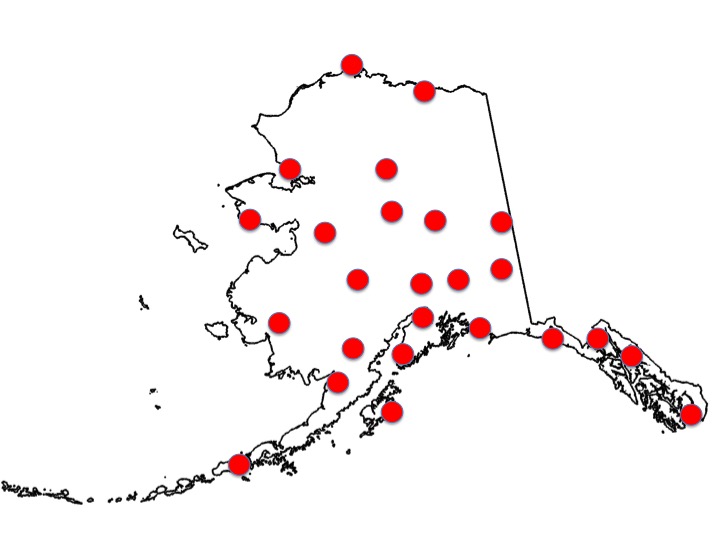
1) Find the standardized departure of the daily average temperature for each the 25 sites below (daily departure from normal divided by the standard deviation). This levels the playing field, so to speak, between inland areas, with much higher variability of temperatures, and marine dominated parts of the state, where water dampens the air temperature variability. These particular sites were chosen to be geographically representative as possible, the observations are all ASOS, so the climate day ends at the same time (midnight), the instrumentation is the same and all have NCEI published 1981-2010 normals (daily average temperature and daily standard deviation). The obvious gaps are the northeast Interior, inland North Slope and the Aleutians. In these regions there are no ASOS sites with published normals.
The next step is simply to find the mean of the 25 standardized departure. This is almost always a value ±1.5. The last step is to convert this "Alaska-wide average standardized departure" for the day into an index. To do this, we convert the daily average standardized departure into a Z-score. Doing this requires knowing the standard deviation of the "Alaska-wide average standardized departure". Now you might think that this should be 1. After all, by construction the 25 daily standardized departures have an a standard deviation of 1. However, because of the spatial correlation in daily departures, the standard deviation of the mean of the 25 sites is significantly less than 1: it turns out that it is about 0.71. The rest is simple: take the Z-score, which is a value between 0 and 1 and create the index. For simplicity, we wanted a "0 to 10" index, but after a little though, having zero be exactly average made it easier to understand. So the index goes from -10 to +10, with 0 being normal. Being derived from a Z-score, the index can never get to ±10, but it can get arbitrarily close: May 13 and May 14, 2016 had index values of +9.98, while January 27, 2012 the index value was -9.81.
Up through early September Alaska had considerably more days warmer than normal than cooler than normal in 2018, but periodic cool spells kept the run of warm days at a moderate length. Since early September though the index has been persistently quite high: by construction, index values above +3.3 fall into the "significantly above normal" tercile, and that has been the case every day since September 5th. This is an interesting situation in that the cause of the warmth has varied. For much of September and the first days of October, as Richard has noted here, strong high pressure aloft, first over the Bering and then a bit farther east from the Arctic to the Gulf of Alaska dominated. In the past week the pattern has transitioned to a "Gulf of Alaska" storm track pattern. In different parts of the state this weather pattern change has resulted in changing temperature regimes, but on the statewide scale, it's a nice example of how distinctly different patterns can lead to the same outcome: much above normal temperatures.
Exactly how the index is derived has gone through several iterations but here's the current version.
1) Find the standardized departure of the daily average temperature for each the 25 sites below (daily departure from normal divided by the standard deviation). This levels the playing field, so to speak, between inland areas, with much higher variability of temperatures, and marine dominated parts of the state, where water dampens the air temperature variability. These particular sites were chosen to be geographically representative as possible, the observations are all ASOS, so the climate day ends at the same time (midnight), the instrumentation is the same and all have NCEI published 1981-2010 normals (daily average temperature and daily standard deviation). The obvious gaps are the northeast Interior, inland North Slope and the Aleutians. In these regions there are no ASOS sites with published normals.
The next step is simply to find the mean of the 25 standardized departure. This is almost always a value ±1.5. The last step is to convert this "Alaska-wide average standardized departure" for the day into an index. To do this, we convert the daily average standardized departure into a Z-score. Doing this requires knowing the standard deviation of the "Alaska-wide average standardized departure". Now you might think that this should be 1. After all, by construction the 25 daily standardized departures have an a standard deviation of 1. However, because of the spatial correlation in daily departures, the standard deviation of the mean of the 25 sites is significantly less than 1: it turns out that it is about 0.71. The rest is simple: take the Z-score, which is a value between 0 and 1 and create the index. For simplicity, we wanted a "0 to 10" index, but after a little though, having zero be exactly average made it easier to understand. So the index goes from -10 to +10, with 0 being normal. Being derived from a Z-score, the index can never get to ±10, but it can get arbitrarily close: May 13 and May 14, 2016 had index values of +9.98, while January 27, 2012 the index value was -9.81.
Friday, October 12, 2018
Still No Snow in Fairbanks
The calendar says we're already in mid-October, which is just about the end of interior Alaska's short autumn. According to climate statistics, the temperature often struggles to rise much above freezing from this point on in Fairbanks, and snow is on the ground more often than not after the 15th.
But this year, like some other recent years, is much different. Remarkably, no snow at all has been observed yet at Fairbanks airport - not even a half-melted flake or a momentary flurry, although some snow occurred at last yesterday in the hills outside town. According to the NWS, this is the latest that Fairbanks has gone without seeing any snow at all.
Snow is also absent across vast areas of western Alaska, and the cause is two-fold: excessively mild temperatures and a lack of precipitation. The dry conditions are of course closely tied to the astonishing ridge that has prevailed lately over the Bering Sea and western Alaska. And the warmth is amazing: Kotzebue has not even seen a freeze yet, which is also an all-time record.
Looking out at water temperatures in the Bering and Chukchi Seas, a tremendous amount of warmth is evident at the ocean surface. Here's Rick Thoman's depiction of September's departure from normal in sea surface temperatures.
And here's a chart (click to enlarge) showing the daily trajectory of SSTs in the southern Chukchi Sea, to the north of the Bering Strait. The red line indicates this year's data, while the gray shaded area shows the minimum and maximum values for each date in the 1981-2017 history. Since September 19, the average sea surface temperature has been at record high levels; the area average is still above +5°C, which has not been observed at this date before. The previous record years were 2007 (for the entire summer) and 2016 (from early October through freeze-up).
But this year, like some other recent years, is much different. Remarkably, no snow at all has been observed yet at Fairbanks airport - not even a half-melted flake or a momentary flurry, although some snow occurred at last yesterday in the hills outside town. According to the NWS, this is the latest that Fairbanks has gone without seeing any snow at all.
Snow is also absent across vast areas of western Alaska, and the cause is two-fold: excessively mild temperatures and a lack of precipitation. The dry conditions are of course closely tied to the astonishing ridge that has prevailed lately over the Bering Sea and western Alaska. And the warmth is amazing: Kotzebue has not even seen a freeze yet, which is also an all-time record.
Looking out at water temperatures in the Bering and Chukchi Seas, a tremendous amount of warmth is evident at the ocean surface. Here's Rick Thoman's depiction of September's departure from normal in sea surface temperatures.
Sea surface temperatures around Alaska were near to much above normal in September except for parts of the Beaufort Sea. Except for the Beaufort and northern Chukchi Seas, these SSTs are warmer than Sept 2017. #akwx #Arctic @Climatologist49 @amy_holman @IARC_Alaska @lisashefguy pic.twitter.com/VAkkUQVX2x— Rick Thoman (@AlaskaWx) October 11, 2018
And here's a chart (click to enlarge) showing the daily trajectory of SSTs in the southern Chukchi Sea, to the north of the Bering Strait. The red line indicates this year's data, while the gray shaded area shows the minimum and maximum values for each date in the 1981-2017 history. Since September 19, the average sea surface temperature has been at record high levels; the area average is still above +5°C, which has not been observed at this date before. The previous record years were 2007 (for the entire summer) and 2016 (from early October through freeze-up).
Saturday, October 6, 2018
Sea Ice Update
Freeze-up is now under way across portions of the Arctic Ocean, notably in the eastern Beaufort Sea, the Canadian high Arctic, and the Greenland Sea. According to NSIDC's daily sea ice index, total Arctic sea ice extent has already increased about 12% from its seasonal minimum on September 16th.
Let's take a look at how this year's September sea ice extent compared to earlier years; we now have 40 years of consistent sea ice data from satellite microwave observations (not visible or infrared wavelengths - thus not obscured by cloud). See the chart below, and click to enlarge.
This year's Arctic ice extent was right in line with September's data from recent years, which is good news from one perspective, as we are not seeing (at least not yet) the kind of rapid downward acceleration in sea ice loss that was perhaps feared a few years ago. However, the loss of ice in just the last 20 years has been dramatic and unquestionably very rapid from the perspective of longer term climate.
With 40 years of data now in front of us, I think it's safe to say that the multi-decadal ice loss has been far from linear; the chart above shows rather little change in the first 20 years, with some high ice years mixed in until 1996. If we look at ice area rather than ice extent - see below - we also find that the highest values occurred in the last 15 years of the 20th century. (See here for an explanation of the difference between extent and area.)
In both charts the really rapid loss occurred from about 1998 through 2012, and there appears to have been a lessening of the trend in the most recent years. Of course it's too early to assign much confidence to potential changes in trend over such short periods, but nevertheless it is interesting to note that there is no statistical significance to the most recent trend in ice extent for anything less than a 15-year period. In other words the 2005-2018 downward trend, and any shorter trend ending in 2018, is not statistically significant; and I take this to be a hint of good news for Arctic sea ice prospects in coming years.
Finally, the estimated September Arctic sea ice volume from the University of Washington's PIOMAS model also came in close to the values of recent years - higher than 2012 and 2016, it would seem, but lower than 2013-2015. However, according to PIOMAS, the volume of sea ice remains well below the then-record low 2007 value, and this is an important contrast with the sea ice area and extent data. Based on volume estimates, then, there is perhaps less reason to be optimistic about any possible slowdown or reprieve in the rate of Arctic ice loss.
Let's take a look at how this year's September sea ice extent compared to earlier years; we now have 40 years of consistent sea ice data from satellite microwave observations (not visible or infrared wavelengths - thus not obscured by cloud). See the chart below, and click to enlarge.
This year's Arctic ice extent was right in line with September's data from recent years, which is good news from one perspective, as we are not seeing (at least not yet) the kind of rapid downward acceleration in sea ice loss that was perhaps feared a few years ago. However, the loss of ice in just the last 20 years has been dramatic and unquestionably very rapid from the perspective of longer term climate.
With 40 years of data now in front of us, I think it's safe to say that the multi-decadal ice loss has been far from linear; the chart above shows rather little change in the first 20 years, with some high ice years mixed in until 1996. If we look at ice area rather than ice extent - see below - we also find that the highest values occurred in the last 15 years of the 20th century. (See here for an explanation of the difference between extent and area.)
In both charts the really rapid loss occurred from about 1998 through 2012, and there appears to have been a lessening of the trend in the most recent years. Of course it's too early to assign much confidence to potential changes in trend over such short periods, but nevertheless it is interesting to note that there is no statistical significance to the most recent trend in ice extent for anything less than a 15-year period. In other words the 2005-2018 downward trend, and any shorter trend ending in 2018, is not statistically significant; and I take this to be a hint of good news for Arctic sea ice prospects in coming years.
Finally, the estimated September Arctic sea ice volume from the University of Washington's PIOMAS model also came in close to the values of recent years - higher than 2012 and 2016, it would seem, but lower than 2013-2015. However, according to PIOMAS, the volume of sea ice remains well below the then-record low 2007 value, and this is an important contrast with the sea ice area and extent data. Based on volume estimates, then, there is perhaps less reason to be optimistic about any possible slowdown or reprieve in the rate of Arctic ice loss.
Monday, October 1, 2018
Alaska Mega-Ridge Persists
October has arrived, but you wouldn't know it based on the weather conditions across Alaska, as most of the state continues to be gripped by a most extraordinary spell of warm, dry, and clear weather. The culprit is another intense ridge of high pressure aloft, very similar to the one that set up over the Bering Sea in the first half of September.
Here's the 500mb chart from Saturday afternoon, exactly 3 weeks after the chart that I showed in my mid-September post. Click to enlarge. Note that the 500mb height at Fairbanks was 5800m, which is the latest in the year that such high pressure has been observed at this mid-atmospheric level above Fairbanks.
Rick Thoman has pointed out some of the impacts of the unusual weather pattern in his Twitter feed (embedded at right). This includes a number of significant high temperature records such as 71°F yesterday at King Salmon - the warmest on record for so late in the season.
It's also interesting to note that downsloping to the southeast of the ridge has produced some remarkable warmth in southeast Alaska, including 66°F with clear skies for 3 days in a row in Yakutat (also the warmest on record this late in the season). According to the long-term history, this is the very wettest time of year in Yakutat, with about 0.7 inches of rain per day on average. It doesn't usually look like this:
Here's a really stunning photo from the Suomi polar orbiter shortly after noon yesterday. The link below the image takes you to a larger file (2MB size) - what a view! The only real low-elevation snow cover is across the eastern North Slope, although there is a bit of snow on the ground near the Porcupine River to the northeast of Fort Yukon.
http://worldagweather.com/npp.20180930.2204_true_color_cropped.jpg
Here's the view at Utqiaġvik yesterday evening, showing some patchy snow on the ground and a bit of ice on the fresh water lagoon, but no sea ice. More on the sea ice situation in another post.
And for good measure, here's another selection of lovely webcam shots from yesterday evening. Perusing these is, for me, the next best thing to being there! It's hard to imagine that freeze-up and snow cover are only a few weeks away at most, assuming that the normal seasonal trajectory soon reasserts itself.
Bettles
Arctic Village
Anaktuvuk Pass
Chandalar Shelf
Point Hope in the far northwest
Kivalina
Shungnak
Koyuk - where ice will very soon be running in the river
And of course Minchumina looking towards Denali
Here's the 500mb chart from Saturday afternoon, exactly 3 weeks after the chart that I showed in my mid-September post. Click to enlarge. Note that the 500mb height at Fairbanks was 5800m, which is the latest in the year that such high pressure has been observed at this mid-atmospheric level above Fairbanks.
Rick Thoman has pointed out some of the impacts of the unusual weather pattern in his Twitter feed (embedded at right). This includes a number of significant high temperature records such as 71°F yesterday at King Salmon - the warmest on record for so late in the season.
It's also interesting to note that downsloping to the southeast of the ridge has produced some remarkable warmth in southeast Alaska, including 66°F with clear skies for 3 days in a row in Yakutat (also the warmest on record this late in the season). According to the long-term history, this is the very wettest time of year in Yakutat, with about 0.7 inches of rain per day on average. It doesn't usually look like this:
Here's a really stunning photo from the Suomi polar orbiter shortly after noon yesterday. The link below the image takes you to a larger file (2MB size) - what a view! The only real low-elevation snow cover is across the eastern North Slope, although there is a bit of snow on the ground near the Porcupine River to the northeast of Fort Yukon.
http://worldagweather.com/npp.20180930.2204_true_color_cropped.jpg
Here's the view at Utqiaġvik yesterday evening, showing some patchy snow on the ground and a bit of ice on the fresh water lagoon, but no sea ice. More on the sea ice situation in another post.
And for good measure, here's another selection of lovely webcam shots from yesterday evening. Perusing these is, for me, the next best thing to being there! It's hard to imagine that freeze-up and snow cover are only a few weeks away at most, assuming that the normal seasonal trajectory soon reasserts itself.
Bettles
Arctic Village
Anaktuvuk Pass
Chandalar Shelf
Point Hope in the far northwest
Kivalina
Shungnak
Koyuk - where ice will very soon be running in the river
And of course Minchumina looking towards Denali
Tuesday, September 25, 2018
Permafrost Data - a First Look
Prompted by a question from reader Tracy on permafrost depth in Fairbanks, I recently tracked down some soil temperature data at the UAF Geophysical Institute's Permafrost Laboratory, headed by Professor Romanovksy. A wealth of data is available, so I chose a site more or less at random: Smith Lake #1, located close to Smith Lake on UAF's North Campus. Daily temperature data are provided from 2007 through May 2017, which is long enough to provide a few interesting results.
First, the chart below shows the sequence of annual mean temperatures at depths down to 3m (click to enlarge). Immediately we're struck by a remarkable trend towards higher temperatures in the past decade or so, with the top 50cm seeing an annual mean temperature above freezing in 2016. There was a big jump between 2013 and 2014, which is not surprising as Fairbanks' mean air temperature was more than 7°F warmer in 2014 than in 2012. And ever since the remarkable transition from cold to warm in May of 2013, Fairbanks has seen persistent anomalous warmth with few significant excursions to the cold side of the climate. The integrated effect of this warmth is clearly visible now in the sub-surface warming trend.
Secondly, as a partial answer to Tracy's question about seasonal thaw of the active layer (i.e. the top layer of permafrost that thaws and refreezes each year), the chart below shows annual maximum temperatures at each depth. (Note that the 2m depth is missing from 2014-2016). From 2007 through 2013, the seasonal thaw did not generally extend down below 50cm, but more recently the active layer has deepened to something like 1m.
Looking at annual minimum temperatures, it is really remarkable to see that by 2016 temperatures below 50cm depth were barely below freezing even at the coldest time of year. It doesn't take too much imagination to envision a complete loss of the permafrost in this particular profile, which would upend the ice/water profile: as it stands now, seasonal thaw sits atop permanent ice, but Smith Lake #1 may soon see seasonal ice atop permanent thaw.
For a bit more perspective on the recent changes, here's the temperature time series from 0.525m depth. March 2017, which was the one really cold month in recent years, produced a minor recovery compared to previous years, but presumably last winter's warmth (not yet reflected in the available data) will have reinforced the warming trend as strongly as ever.
Wednesday, September 19, 2018
Historical Context for Recent Extreme
Following up on Saturday's post, I did a bit more work with the NCEP/NCAR global reanalysis data to get a better sense of just how unusual the recent circulation anomaly has been. How many times has a comparable two-week anomaly been observed in the past, not just over Alaska but anywhere in the Northern Hemisphere?
I addressed this question with the following series of calculations:
(a) Obtain a smoothed daily climatology (normal) of 500mb heights for the 1958-2017 period. Note that the NCEP/NCAR reanalysis starts in 1948, but the quality is lower before 1958 owing to the paucity of upper-air observations.
(b) Calculate mean height anomalies for 15-day periods ending on every day since 1958.
(c) Extract a smoothed daily climatology of the standard deviation of the 15-day anomalies.
(d) Find the daily maximum and minimum of standardized 15-day anomalies across the entire Northern Hemisphere.
Here are the results: the red line shows the daily hemispheric maxima of standardized 15-day height anomalies, and the blue line indicates the hemispheric minima. (Click to enlarge)
Remarkably, the 15-day anomaly ending just 3 days ago at a grid point over the Bering Sea was the largest of any in the entire Northern Hemisphere history since 1958. It was also larger in magnitude than any 15-day negative anomaly. The closest competitor on the positive side was an extreme blocking ridge over northern Greenland in November 1965; here's a pair of maps showing a comparison of the two events:
Of course the long-term global rising trend in 500mb heights gives a slight "advantage" to the recent anomaly in comparison to a fixed climatology, so I re-did steps (b) - (d) above after removing the 1958-2017 linear trend (calculated for each day of the year and each grid point). In this case the 1965 event moves into first place as the most extreme positive 15-day height anomaly at 500mb (in terms of standard deviations).
It would be interesting to see how other atmospheric variables like temperature and moisture reflect the nearly unprecedented nature of this month's anomaly, and it would also be worth looking at other, more modern data sets.
But based on these results, it seems safe to say that the recent high pressure ridge over the Bering Sea and western Alaska has been one of the most extreme 15-day weather anomalies in recent decades anywhere in the Northern Hemisphere.
Saturday, September 15, 2018
Record Bering Ridge
Much of Alaska has enjoyed a most remarkable extended spell of clear, dry, calm, and warm autumn weather in the past couple of weeks, thanks to an extremely strong and persistent ridge of high pressure centered over the Bering Sea. Here's a map (click to enlarge) showing the 500mb height anomaly (departure from normal) in the first two weeks of this month, expressed in terms of standard deviations. Near St. Lawrence Island the 500mb height has averaged more than 2.5 standard
deviations above normal for a period of two weeks. This is a
remarkable anomaly.
Courtesy of Environment Canada, here's the 500mb analysis from last Saturday afternoon when the blocking ridge was in full swing.
As of yesterday afternoon the ridge was much weaker but still quite sufficient to dominate the weather over much of Alaska.
The chart below shows the 500mb height measurements from the sounding site on St. Paul Island in the southeastern Bering Sea. The gray lines represent the one-standard deviation range either side of the 1981-2010 normal. The persistence of the very strong positive height anomalies is notable, to say the least.
Another perspective on just how unusual this is can be gleaned from the history of September 1-14 measurements at St. Paul Island - see below. I'm not sure that I've ever seen a multi-decadal climate chart with such an extreme anomaly in only one year that lies so far outside the envelope of observed climate. It's quite astonishing.
Unfortunately Alaska's sounding sites farther north have not been reporting regularly this month, but I pulled out the equivalent data from the NCEP/NCAR Reanalysis at a grid point near the Bering Strait - see below. The result is similar but actually even more extreme relative to the climate of recent decades.
Compared to the 1981-2010 climate, the mean 500mb height of the past 14 days has been 5.1 standard deviations above normal. If the reanalysis is correct (and it should be quite accurate for 500mb height), and if the 500mb climate is Gaussian and stationary (unchanging), then we'd expect this kind of anomaly to occur less than once every million years, on average (for this particular date window). Obviously one or more of the assumptions is false, but this illustrates the magnitude of the extreme.
What might have caused such a remarkable departure from normal? I suggest a couple of possible causes. First, it seems like the chain of events to set up the ridge started in late August when a burst of tropical cyclone activity occurred in the West Pacific. Typhoon Cimaron (Category 3) hit Japan on August 23 and then the remnants headed up to the Aleutians, and on the same day Typhoon Soulik (also Category 3) hit South Korea and then moved into the Bering Sea. Then about 10 days later Typhoon Jebi (Category 5 at one point) hit Japan (September 4) and headed for northeastern Russia. The upper-level circulation of the latter storm, in particular, moved up the west side of the Bering Sea ridge on September 6 and seems to have provided a reinforcing boost for the ridge by transporting huge quantities of warm, moist air up to the region.
Here are the paths of the 3 storms - maps courtesy of Wikipedia.
Cimaron
Soulik
Jebi
A second contributing factor may be that sea surface temperatures have been far warmer than normal in the northern and western Bering Sea in recent weeks, and this unusual ocean warmth probably helped boost the overall warmth of the atmospheric column and build the ridge in the same area. Here's an SST anomaly map that Rick Thoman posted on Twitter recently:
Finally, to illustrate the impacts of the weather pattern, here are a few nice shots of the lovely autumn scene across the state, courtesy of the FAA webcam views on Thursday evening.
Kivalina (far northwest Alaska)
Chandalar Shelf (in the central Brooks Range)
Bettles
Teller (western Seward Peninsula)
Grayling (on the lower Yukon River)
Minchumina
Denali National Park
Anchorage
Kodiak
Yakutat (one of the wettest places in Alaska, especially at this time of year normally)
And here's a true-color shot from the Suomi polar orbiter on Thursday afternoon (click to enlarge). The reddish-brown tundra colors of autumn are quite distinct in the north as well as in higher altitude areas throughout the state.
Courtesy of Environment Canada, here's the 500mb analysis from last Saturday afternoon when the blocking ridge was in full swing.
As of yesterday afternoon the ridge was much weaker but still quite sufficient to dominate the weather over much of Alaska.
The chart below shows the 500mb height measurements from the sounding site on St. Paul Island in the southeastern Bering Sea. The gray lines represent the one-standard deviation range either side of the 1981-2010 normal. The persistence of the very strong positive height anomalies is notable, to say the least.
Another perspective on just how unusual this is can be gleaned from the history of September 1-14 measurements at St. Paul Island - see below. I'm not sure that I've ever seen a multi-decadal climate chart with such an extreme anomaly in only one year that lies so far outside the envelope of observed climate. It's quite astonishing.
Unfortunately Alaska's sounding sites farther north have not been reporting regularly this month, but I pulled out the equivalent data from the NCEP/NCAR Reanalysis at a grid point near the Bering Strait - see below. The result is similar but actually even more extreme relative to the climate of recent decades.
Compared to the 1981-2010 climate, the mean 500mb height of the past 14 days has been 5.1 standard deviations above normal. If the reanalysis is correct (and it should be quite accurate for 500mb height), and if the 500mb climate is Gaussian and stationary (unchanging), then we'd expect this kind of anomaly to occur less than once every million years, on average (for this particular date window). Obviously one or more of the assumptions is false, but this illustrates the magnitude of the extreme.
What might have caused such a remarkable departure from normal? I suggest a couple of possible causes. First, it seems like the chain of events to set up the ridge started in late August when a burst of tropical cyclone activity occurred in the West Pacific. Typhoon Cimaron (Category 3) hit Japan on August 23 and then the remnants headed up to the Aleutians, and on the same day Typhoon Soulik (also Category 3) hit South Korea and then moved into the Bering Sea. Then about 10 days later Typhoon Jebi (Category 5 at one point) hit Japan (September 4) and headed for northeastern Russia. The upper-level circulation of the latter storm, in particular, moved up the west side of the Bering Sea ridge on September 6 and seems to have provided a reinforcing boost for the ridge by transporting huge quantities of warm, moist air up to the region.
Here are the paths of the 3 storms - maps courtesy of Wikipedia.
Cimaron
Soulik
Jebi
A second contributing factor may be that sea surface temperatures have been far warmer than normal in the northern and western Bering Sea in recent weeks, and this unusual ocean warmth probably helped boost the overall warmth of the atmospheric column and build the ridge in the same area. Here's an SST anomaly map that Rick Thoman posted on Twitter recently:
Finally, to illustrate the impacts of the weather pattern, here are a few nice shots of the lovely autumn scene across the state, courtesy of the FAA webcam views on Thursday evening.
Kivalina (far northwest Alaska)
Chandalar Shelf (in the central Brooks Range)
Bettles
Teller (western Seward Peninsula)
Grayling (on the lower Yukon River)
Minchumina
Denali National Park
Anchorage
Kodiak
Yakutat (one of the wettest places in Alaska, especially at this time of year normally)
And here's a true-color shot from the Suomi polar orbiter on Thursday afternoon (click to enlarge). The reddish-brown tundra colors of autumn are quite distinct in the north as well as in higher altitude areas throughout the state.
Subscribe to:
Posts (Atom)