Showing posts with label SST. Show all posts

Saturday, September 7, 2024

Cool Bering/Chukchi Sea

I've mentioned the PDO (Pacific Decadal Oscillation) a few times in recent months, and late August brought a fresh dive into the strongly negative phase.  This reflects an expansion of below-normal sea surface temperature anomalies across the Bering Sea in response to the strong and persistent trough near the Date Line in late summer.


The very pronounced trough delivered very cool Arctic air from Chukotka across the northern Bering Sea to western Alaska, and very cloudy and windy conditions across the eastern Bering Sea really reinforced the cool ocean anomaly.  Here are some climate anomaly maps for the month of August:


As a result, the sea surface waters in the eastern Bering Sea and the Chukchi Sea became the most anomalously cool of any ocean area in the world by the end of August:


Here's a time series of SST anomalies since 2018 for the Bering/Chukchi area east of the Date Line and north of 56°N (i.e. Bristol Bay northward).


While the cool anomaly is now quite notable, it is nowhere near as pronounced as the extreme warmth in 2019, at least when assessing conditions relative to a prior multi-decadal normal.  Notice that most of the major anomalies occur in the summer and autumn, when sea ice is absent and the near-surface ocean layer can become much cooler or (especially) much warmer than normal.

A longer-term chart puts the last few years in context.  The current cool anomaly is among the most pronounced in the modern (satellite sensing) era, although we haven't quite reached the level of the 2011-2012 negative PDO extreme.


Sunday, June 11, 2023

May Climate Data

Looking back at the month of May, there were a number of extreme weather events across Alaska, and as always I recommend Rick Thoman's blog for many of the details.  For the month as a whole, the statewide average temperature ended up on the verge of the "below normal" tercile, but it was a mixed bag, with unusual warmth more prevalent in the east and north.  Cold in the west wasn't extreme, but it was notable.


Statewide precipitation was more unusual - tied with 2018 for second highest in the past 30 years.  It was the wettest May on record for the Southeast Interior climate division, with the extreme rainfall near Glennallen at the end of the month being largely responsible for that statistic (Rick has more details on the event).  The ERA5 reanalysis data doesn't seem to have fully picked up on the event, which probably shouldn't be surprising given the complex terrain around the Copper River Basin and the likely localized nature of the heaviest rains.

As for wind and clouds, May brought a lot of both for southern Alaska, and especially from Bristol Bay to the Kenai Peninsula.


The 500mb anomaly map shows why: a trough axis was stuck between the ridge to the south of the Aleutians (associated with very unusual ocean warmth) and a powerful ridge over Canada (producing the very active early fire season there).

Many readers will recognize the negative PDO pattern in the SST map above: cold in the near-Alaskan waters and along the west coast of the lower 48.  But interestingly, it's not cold from Southeast Alaska down to Washington, and that's unusual for a negative PDO regime.

Looking more widely at the Arctic, May was very warm on opposite sides of the Pole, both in north-central Russia and in north-central Canada.

The departure from normal reached 3 standard deviations in both areas.

Appending the last few months to previous results, it's becoming obvious that the Arctic land area as a whole has settled back into a slightly cooler regime compared to the warmth that prevailed for 5 years after the 2015-16 El Niño - see the black line in the chart below:


But it's unlikely that the "cool" regime will prevail much longer.  Global (excluding Arctic/Antarctic) average sea surface temperatures have been at a record high for more than two months now, and that's before the main effect of the emerging El Niño is felt.  Not to be alarmist, but it does seem very likely now that global temperatures will not just break but smash previous records in the next year or so, and the Arctic will very likely follow suit.


Saturday, March 4, 2023

February Regime

As noted in my last post, February was quite snowy again this year in Fairbanks, and it's worth following up on this.  With 21.1" of snow, last month makes 5 of the last 7 Februarys with over 20", and all 7 have seen above-normal snow.

In the preceding 87 years (1930-2016) there were only 7 Februarys with 20" or more, so the probability of randomly getting 5 of 7 years above that mark is extremely small indeed (less than 0.00001, assuming no year-to-year correlation).  Obviously this indicates that "something has changed"; the global circulation and the February weather patterns around Alaska have behaved differently in the last 7 years than in earlier decades.


Here's the average sea-level pressure anomaly for February in the last 7 years. 

On average, SLP has been more than 10mb higher than normal over the mid-latitude North Pacific to the south of Alaska.  That's a very large departure from normal, and it signifies a stronger than westerly component to the flow over southern Alaska.  The map below shows the departure from normal of the wind vectors (speed and direction).


The more westerly flow regime is favorable for importing Pacific and Bering Sea moisture to interior Alaska, and the pattern also tends to set up a (cloud/snow-producing) frontal zone across southern Alaska.  Here's the lower-atmosphere temperature anomaly: it has tended to be colder than normal in western Canada and northern Alaska, but warmer than normal across the northern Pacific.

The pattern is substantially similar to a typical La Niña winter pattern, except that the North Pacific ridge often extends more strongly to the northwest across the Bering Sea during La Niña.  In contrast, recent Februarys have seen low pressure in the western Bering Sea and a ridge axis farther to the east over Alaska itself (see the SLP map above).  This means that there has been far less cold for Alaska than you would expect during La Niña.

Of course, we have indeed seen a preponderance of La Niña in the past 7 winters; 4 of the 7 years had bona fide La Niña conditions in February.  Winters 2018-19 and 2019-2020 were more El Niño-like (although not strongly so), and it may be no coincidence that the two recent Februarys with under 20" of snow in Fairbanks were those ones.

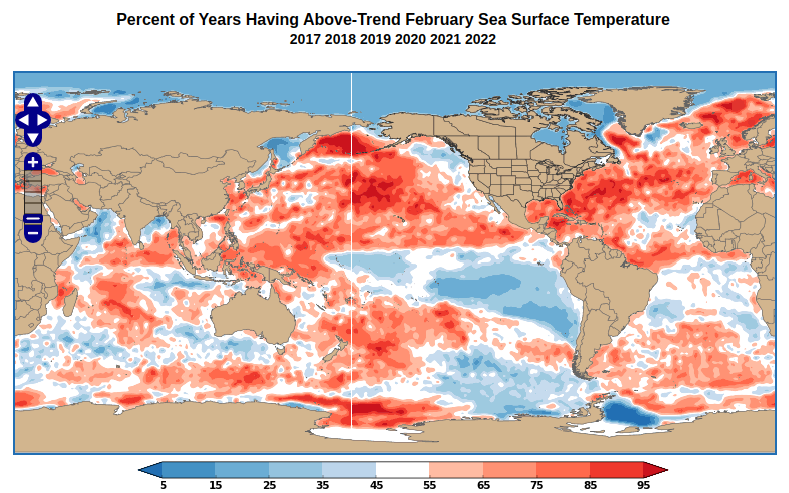
However, the recent state of affairs is not as simple as a recurring La Niña regime causing excess snow in Fairbanks; some of the strongest La Niña's of the past have been dry, not snowy, winters in Fairbanks.  Compare the sea surface temperature maps below; the first shows the typical SST pattern for La Niña in February, and the second shows the pattern from 2017-2022.  (The ERA5 data for February this year isn't available yet, but I've included an ERSSTv5 map for last month as well.)


What strikes me here is that recent Februarys have seen much more warmth in both the Bering Sea and the western Atlantic Ocean than is typical for La Niña.  It seems clear that the western Bering Sea warmth is associated with the recurrent low pressure there - which again is not typical of La Niña - and both the flow trajectory and the excess of moisture (from excess evaporation) have favored abundant snowfall in Fairbanks.

Evidence of excess atmospheric moisture upstream of Fairbanks can be seen in the anomaly of precipitable water for the last 7 Februarys: it has been above normal over the Bering Sea.


As for the abundance of warmth in the western Atlantic, this has helped reinforce (and has been reinforced by) the U.S. East Coast ridge that is part and parcel of the continental-scale flow regime.  Here's the global 500mb height anomaly for February in recent years.

The connection between the North Pacific ridge and the East Coast ridge is an example of a long-distance "teleconnection", and the pattern has been pronounced in recent years.  It's not coincidental, then, that the southeastern U.S. has seen unusual February warmth for - you guessed it - the past 7 years, and this February was one of the warmest on record.

To illustrate, here's a scatterplot of Fairbanks February snowfall versus February temperature at my location in northeast Georgia.  There has always been a relationship, with a snowy Fairbanks often corresponding to a warm Georgia, but the joint anomaly has been very striking in recent years.


When will the pattern change?  It's impossible to say, of course, but next winter has a good chance of seeing El Niño, and so the North American pattern should be significantly different.


Monday, September 19, 2022

More On Ex-Merbok

Following up on the meteorology of the Bering Sea storm (formerly Typhoon Merbok), Rick Thoman penned some comments that are well worth reading:

https://theconversation.com/typhoon-merbok-fueled-by-unusually-warm-pacific-ocean-pounded-alaskas-vulnerable-coastal-communities-at-a-critical-time-190898

To Rick's point about unusually warm SSTs, the map below demonstrates that the storm did indeed pass over very unusually warm water in the northwestern Pacific as it was undergoing its transition from tropical to extratropical cyclone.  An SST anomaly of +4°C is extremely large, but it's been like this on and off since mid-summer in various parts of the northern and northwestern Pacific.


I don't think we can say with absolute certainty without doing modeling experiments, but I agree with Rick that the unusual warmth and moisture were very likely significant factors in the unseasonably extreme intensification of ex-Merbok as it moved into the Bering Sea.  As noted in yesterday's post, however, the mid-latitude jet features clearly also played an important role, with their strength and timing being "just right" to facilitate an extreme outcome.

In terms of impacts, flooding was the big story, and it was devastating for some communities.  This article documents many of the events in sad detail:

https://alaskapublic.org/2022/09/17/powerful-storm-slams-western-alaska/

Some of the most dramatic pictures were before and after shots from FAA webcams, such as these posted by NWS Fairbanks:


The news from Golovin at first light on Saturday was overwhelming:


A fact I saw frequently mentioned is that this was the worst storm in nearly 50 years, and that refers back to the benchmark November 1974 storm.  The late Ted Fathauer wrote about that event, but I don't have access to the article (perhaps someone can help):

https://www.tandfonline.com/doi/abs/10.1080/00431672.1975.9931740

More recently, November 2011 saw a tremendous Bering Sea storm, as mentioned on this blog at the time (beginning with the following post and several thereafter):

http://ak-wx.blogspot.com/2011/11/bering-sea-superstorm.html

As for this weekend's flooding, Rick Thoman showed that Nome's peak water level was higher than 2011 but not as bad as 1974:


Here are a couple of photos I grabbed from the Nome Visitor Center webcam on Saturday, showing an extremely threatening sea, and waves running up beside the building:


Let's hope many, many years pass before a storm like this returns to the long-suffering communities of western Alaska.


Thursday, February 6, 2020

North Pacific Blog Post

With the colder weather for northwestern North America this winter, there have been accompanying changes in North Pacific temperature patterns.  I posted a few comments here:

https://alaskapacificblob.wordpress.com/2020/02/06/cooler-patterns-for-now/


Tuesday, November 6, 2018

North Pacific Blog Post

It's been a while since I did one of these, but I've just posted an update on the North Pacific "blob tracker" blog.

https://alaskapacificblob.wordpress.com/2018/11/06/record-north-pacific-warmth/

I'll aim to add some interpretation for the Alaska climate scene on here in the coming days.

Friday, October 12, 2018

Still No Snow in Fairbanks

The calendar says we're already in mid-October, which is just about the end of interior Alaska's short autumn.  According to climate statistics, the temperature often struggles to rise much above freezing from this point on in Fairbanks, and snow is on the ground more often than not after the 15th.

But this year, like some other recent years, is much different.  Remarkably, no snow at all has been observed yet at Fairbanks airport - not even a half-melted flake or a momentary flurry, although some snow occurred at last yesterday in the hills outside town.  According to the NWS, this is the latest that Fairbanks has gone without seeing any snow at all.

Snow is also absent across vast areas of western Alaska, and the cause is two-fold: excessively mild temperatures and a lack of precipitation.  The dry conditions are of course closely tied to the astonishing ridge that has prevailed lately over the Bering Sea and western Alaska.  And the warmth is amazing: Kotzebue has not even seen a freeze yet, which is also an all-time record.

Looking out at water temperatures in the Bering and Chukchi Seas, a tremendous amount of warmth is evident at the ocean surface.  Here's Rick Thoman's depiction of September's departure from normal in sea surface temperatures.


And here's a chart (click to enlarge) showing the daily trajectory of SSTs in the southern Chukchi Sea, to the north of the Bering Strait.  The red line indicates this year's data, while the gray shaded area shows the minimum and maximum values for each date in the 1981-2017 history.  Since September 19, the average sea surface temperature has been at record high levels; the area average is still above +5°C, which has not been observed at this date before.  The previous record years were 2007 (for the entire summer) and 2016 (from early October through freeze-up).


Wednesday, February 21, 2018

North Pacific Blog Post

I added a new post this evening on the Alaska/North Pacific "Blob Tracker" Blog, discussing the potential for extraordinary warmth this summer in the North Pacific:

https://alaskapacificblob.wordpress.com/2018/02/21/north-pacific-forecast/


Tuesday, August 22, 2017

North Pacific Blog Post

I added a new post on the Alaska "Blob Tracker" blog today, with a brief discussion of a new paper published in the Journal of Climate.  Thanks to Brian Brettschneider for pointing out the paper to me.

https://alaskapacificblob.wordpress.com/2017/08/22/atmospheric-connection-to-the-blob/


Monday, March 13, 2017

North Pacific Blob Update

Hot off the press this evening: a new post on the Alaska "Blob Tracker" blog, showing interesting similarities of recent events with those that followed the 1997-1998 El Niño:

https://alaskapacificblob.wordpress.com/2017/03/13/the-blob-in-hibernation/


Tuesday, January 31, 2017

Winter So Far

January has been another relatively snowy month in Fairbanks, with a total accumulation of 17" - the highest January total since 2005.  The combined December-January total was almost exactly 50", which is the 5th highest on record for the two-month period.  Temperatures have averaged slightly below the 1981-2010 normal and close to the long-term (1930-present) normal, but with alternating cold and warm spells.  Snowy winters are typically colder than dry winters in Fairbanks.


As noted in earlier posts (e.g. here), the cool and snowy conditions are surprising in view of this winter's North Pacific sea surface temperature patterns.  The positive PDO phase and negative NPM phase, which continue to be evident in the latest SST data, would normally promote warm and dry conditions in the interior; we discussed this back in November.  Here's another map showing the average 500mb height anomaly (departure from normal) in November through January for 6 winters with a significantly positive PDO and significantly negative NPM:

Compare this pattern to what has actually transpired in the last 3 months:

The patterns are fairly close to the inverse of each other, and this of course explains the weather in Fairbanks: the flow pattern has produced enhanced westerly flow across western Alaska, thereby transporting moisture to the interior, and the tendency for higher heights in the Bering Sea has allowed cold air to drop south across Alaska at times.

The reason for the discrepancy appears to be that the weak La Niña in the tropical Pacific has had a much more dominant influence on the circulation pattern than expected (at least by me).  The map below shows the height pattern for the 10 strongest La Niña winters since 1950-51; this is a better match to what has happened this winter, although admittedly the La Niña flow is a colder pattern for Alaska than we've seen this winter.


The most intriguing part of the situation, I think, is how the North Pacific SST patterns have remained much more reminiscent of El Niño than of La Niña, despite the evidently profound influence of the La Niña episode on the atmospheric circulation.  A positive PDO and negative NPM are generally observed in association with El Niño, like last winter - but not this time.  But regardless of the cause, this winter's outcome will serve as a cautionary tale about the danger of relying too heavily on the North Pacific SST patterns in isolation for making a forecast.

Update Feb 2: This nice graphic from NWS Fairbanks shows the complete contrast between last winter and this winter in terms of early versus mid-winter snowfall accumulation; the totals before and after December 1 are almost perfectly reversed.


Monday, November 14, 2016

North Pacific Temperature Update

I added a new post on the Alaska "Blob Tracker" blog this morning:

https://alaskapacificblob.wordpress.com/2016/11/14/dramatic-changes-in-recent-weeks/

The contrast between a strongly positive PDO phase and now strongly negative NPM phase is quite remarkable.  Looking at past years in which this combination was observed during winter, it is typical to see a stronger than usual Aleutian Low and a strong ridge over the western half of Canada.


Unfortunately for snow-lovers, this pattern is a distinctly dry one for interior Alaska and a distinctly warm one for southern and southeastern Alaska.  Of course, there's no guarantee that the North Pacific temperatures will remain in this pattern for the next 3 months, but I wouldn't want to bet against it.


Monday, November 23, 2015

Summary of SST Impacts

Reader Gary suggested recently that it would be helpful to have a summary of the typical impacts of major ocean anomalies on Fairbanks climate.  There are many different ways this information could be presented, but I thought it might be useful to visualize the contrasts between different ocean phases in a chart format.

Beginning with impacts on winter (November-March) temperature, the chart below shows the median temperature anomaly for strongly negative, near-neutral, and strongly positive phases of 4 different large-scale sea surface temperature (SST) patterns.  I've included the Atlantic Multidecadal Oscillation (AMO) for good measure as I've mentioned it a few times recently.  Note that the data are from 1930-2015; strongly negative and strongly positive are defined as the bottom 10 and top 10 years respectively, while near-neutral consists of the 20 years in the middle of the 86-year distribution.  Also note that I de-trended the temperatures before calculating the anomalies so that relatively warm and cold anomalies are more evenly distributed through the history.


The PDO and ENSO (El Niño/La Niña) impacts on temperature are as expected, with a negative PDO and La Niña both bringing cold winters, and with El Niño showing a less reliable warm influence than a positive PDO phase.  The NPM appears to have little effect on temperature, but surprisingly the AMO phase is modestly influential, with a more positive phase correlated with warmer conditions.

Similar charts for winter precipitation and snowfall are shown below; the PDO and ENSO impacts are as expected, and the impact of the NPM is "opposite" to that of the PDO and ENSO, as I showed in my September talk.  It's interesting to note that the strongly positive NPM phase brings more than twice as much precipitation as the strongly negative phase (median 3.65" vs 1.44"), but the snowfall is only 78% higher (55" vs 31").


The charts below show parallel results for the other seasons of the year, defined as April-May for spring, June-August for summer, and September-October for autumn.  Vertical scales are left unchanged to highlight the relative magnitude of temperature anomalies and precipitation amounts in different seasons.  There's a lot that could be said about the different patterns, but I'll leave additional comments for another time.