Showing posts with label Permafrost. Show all posts

Friday, August 13, 2021

Rain on Permafrost

Reader Gary posted a comment about possible ocean impacts of excess water runoff from this summer's heavy rainfall over western Alaska, and while I don't have any insight on that question, it got me thinking about effects on permafrost.  Back in March I commented on a National Park Service study showing that permafrost warming has been extreme in northwestern Alaska, and it seems likely that excessive rainfall can only worsen the situation.  Here's a different study, also published this year, that reaches the striking conclusion that "precipitation is as important an environmental control on permafrost degradation as surface air temperature":


I'll be the first to admit I don't know much about permafrost physics, but a back-of-the-envelope estimate seems to confirm the significance of the issue.  For example, if 10 inches of rain falls at an air temperature of 10°C, and all the water percolates into the subsurface, this makes available about 10 MJ of energy per square meter for warming or thawing near-freezing soils (based on the heat capacity of rain water: 250 kg x 10°C x 4200 J/kg/°C).

If we're talking about simply melting ice, this amount of heat could melt 30 kg of ice per square meter, which is only about 3cm depth of pure ice.  However, if the heat goes only into warming the soil, then 1°C of warming could occur through as much as 5m or more of the ground - based on the heat capacity and density of "icy peat" that I found here.  I'll refrain from any further guesswork, but it seems the effect could be significant.

Here's a paper - apparently under review - that argues the same thing:


On the other hand, another study focused on Tibet finds the opposite, with enhanced rainfall being associated with a decrease in heat conduction (presumably because rainy weather is also cooler and cloudier).  Looks like there is scope for further research.


Friday, March 26, 2021

Permafrost Study

A couple of weeks ago I mentioned a paper that was published in January, looking at changes in air and ground temperature in recent years at monitoring sites within Alaska's national parks.  Here's the link:

https://www.tandfonline.com/doi/full/10.1080/15230430.2020.1859435

The focus of the study is on the dramatic warm-up that occurred in 2013, with the monitoring data showing ground temperature increases of up to 4°C at 50cm depth.  The climate warming was concentrated in winter and was much more pronounced in western than eastern Alaska.  Here's a chart of annual mean air temperature at Nome to illustrate the change.

Among the interesting results in the study is that the measurements show much more subsurface warming in the Arctic parks than the interior parks, because the monitoring sites up north are in tundra locations with thin, wind-scoured snowpack; in this setting the ground temperature can change as much as the air temperature.  In contrast, the sites in the Denali, Wrangell-St. Elias, and Yukon-Charley areas have deeper snowpack in mostly alpine and taiga environments, and the insulating effect of the snow reduces the amplitude of the warming below ground.

The implication of the warming for permafrost is, of course, very significant, and the paper demonstrates this quantitatively by comparing the ground temperature rise to the fraction of park area with estimated (modeled) permafrost temperatures above certain thresholds.  For instance, 40% of the Bering Land Bridge National Preserve was estimated to have permafrost temperature above -3°C in 2000-2009, and so the warming of 3°C or more is likely to have brought much of this area into a thaw.  And although ground warming has been much less in the more southerly parks, these have significant areas with marginal permafrost that is already close to a thaw.

The park with the most robust permafrost situation - at least based on modeled permafrost temperatures - is the Noatak National Preserve, with only 6% of land area above -3°C prior to the warm-up.

I applaud the authors (including Pam Sousanes and Ken Hill of Howard Pass fame) for their work.  The value of this NPS monitoring network and careful analysis of the data can hardly be overstated in light of the rapid change of recent years.


Friday, March 12, 2021

Permafrost Update

Back in 2018 and 2019 I looked at permafrost conditions at a couple of central Alaska monitoring sites maintained by UAF's Permafrost Laboratory, and it's high time for an update now that two more years of data are available (thanks to Colby Wright at the Lab).  Here are the previous posts: here and here.

First, here's an updated time series at 52cm depth at the Smith Lake 1 site near UAF; click to enlarge.

We noted in 2019 that this data reveals a remarkable transition: at this depth below ground, the site went from permanently frozen to barely frozen even during winter; the minimum temperatures in 2018 and 2019 were -0.24°C and -0.27°C respectively.  However, colder conditions last winter (2019-20) did briefly take the temperature back below -1°C.  The data ends in May 2020, so we don't know how things are looking this winter.

To illustrate the sustained warmth that produced the change, here's a chart showing monthly air temperature anomalies since 2012 in Fairbanks.

Immediately following the coldest April on record in 2013, there was a dramatic warm-up in May (read about it on the blog archives, e.g. here), and temperatures stayed more-or-less above normal for the next six and a half years (with the exception of March 2017, which also shows up in the ground temperature trace).  But 2020 then started out with a very cold January and was a cooler year overall.

An updated chart of annual minimum temperatures in the soil column highlights just how close the Smith Lake 1 site has come to having a permanently thawed layer (I believe this is called a talik) below the seasonally frozen layer.  However, the 2020 data will show a slight recovery, as noted above.


Annual mean temperatures rose above freezing for the first time in 2018 and 2019 at depths from about 30-75cm, and remarkably the average temperature rose almost to 0°C down at 3m depth.


As for annual maximum temperatures, these show that the active layer depth increased to over 1m, but with thaw very close to occurring at 3m depth, it seems this permafrost is nearly gone.

Similar trends are seen at the Bonanza Creek 1 site, about half way between Fairbanks and Nenana.  In this case it's interesting and a bit odd to see the two-year cycle of increasing temperatures: there were significant jumps in 2014-15, 2016-17, and again in 2018-19.  Like the Smith Lake site, the ground barely froze below 0.5m in 2018 and 2019; but unlike Smith Lake there's no data below 1.5m to see what's happening lower down.


A time series chart for 67cm depth shows the stair-step warming, and at this site there was no recovery in early 2020; the last 3 winters in the series all failed to drop below -0.15°C at this depth, after being frozen nearly all the time in earlier years.


For further reading on recent permafrost trends in Alaska, check out this paper, published in January; I'll comment on it in a future post.

https://www.tandfonline.com/doi/full/10.1080/15230430.2020.1859435


Friday, July 31, 2020

Copious Rain and A Permafrost Study

I wasn't expecting to return to the topic of summer rain quite so soon, but for two reasons it makes sense to do so.  First, the current weather forecast from NWS Fairbanks is worthy of comment, with a flood watch in effect over the weekend for the central interior, middle Tanana valley, and Denali region.  The rainfall forecast for the next 3 days is striking to say the least; any time you have 15% or more of your normal annual precipitation predicted for a weekend, it's worth paying attention.


The special statement issued by the NWS includes quite a collection of hazards:

SPECIAL WEATHER STATEMENT
NATIONAL WEATHER SERVICE FAIRBANKS AK
508 AM AKDT FRI JUL 31 2020

AKZ220>226-011415-
YUKON FLATS AND SURROUNDING UPLANDS-CENTRAL INTERIOR-
MIDDLE TANANA VALLEY-DELTANA AND TANANA FLATS-
UPPER TANANA VALLEY AND THE FORTYMILE COUNTRY-DENALI-
EASTERN ALASKA RANGE-
INCLUDING FORT YUKON, VENETIE, CENTRAL, CIRCLE, STEVENS VILLAGE, 
BEAVER, CHALKYITSIK, BIRCH CREEK, CIRCLE HOT SPRINGS, 
EAGLE SUMMIT, TWELVEMILE SUMMIT, NENANA, ANDERSON, TANANA, MINTO, 
MANLEY HOT SPRINGS, RAMPART, LAKE MINCHUMINA, LIVENGOOD, 
FAIRBANKS, FORT WAINWRIGHT, EIELSON AFB, ESTER, NORTH POLE, 
MOOSE CREEK, TWO RIVERS, FOX, CHATANIKA, CHENA HOT SPRINGS, 
SOURDOUGH CAMP, SALCHA, DELTA JUNCTION, FORT GREELY, 
HARDING/BIRCH LAKE, DRY CREEK, DOT LAKE, HEALY LAKE, TOK, 
TANACROSS, EAGLE, TETLIN, NORTHWAY, ALCAN, CHICKEN, BOUNDARY, 
HEALY, DENALI NATIONAL PARK, CARLO CREEK, KANTISHNA, 
MENTASTA LAKE, BLACK RAPIDS, DONNELLY DOME, TRIMS DOT CAMP, 
EAGLE TRAIL, AND MINERAL LAKE
508 AM AKDT FRI JUL 31 2020

...COPIOUS RAINFALL LIKELY OVER MOST OF THE EASTERN/CENTRAL 
INTERIOR AND ALASKA RANGE SATURDAY EVENING...

...INCREASING LIKELIHOOD FOR A SIGNIFICANT OUTBREAK OF STRONG 
THUNDERSTORMS OVER THE EASTERN INTERIOR...

STRONG THUNDERSTORMS ARE EXPECTED BEGINNING LATE SATURDAY 
AFTERNOON OVER THE FORTYMILE UPLANDS AND WHITE MOUNTAINS. THESE STORMS
WILL LIKELY PRODUCE DANGEROUS LIGHTNING, LOCALLY TORRENTIAL 
RAINFALL RATES, HAIL, AND STRONG WINDS. EXPECT CONDITIONS TO 
DETERIORATE RAPIDLY FROM THE HOT AND MOSTLY SUNNY AFTERNOON 
CONDITIONS. OUTDOOR RECREATORS, IN PARTICULAR, SHOULD EXERCISE 
SIGNIFICANT CAUTION AND BE WEATHER-READY. 

EXPECT TORRENTIAL RAINFALL RATES WITH UP TO AN INCH PER HOUR OVER
LOCALIZED AREAS. TOTAL RAINFALL WILL RANGE FROM 0.5-2" TOTAL OVER
THE EASTERN INTERIOR UP TO 2-4" OVER THE CENTRAL INTERIOR, WITH 
THE HEAVIEST TOTALS CURRENTLY EXPECTED FROM TANANA TO MINCHUMINA 
TO THE MINTO FLATS. HEAVY RAIN WILL TRANSITION TO LIGHTER RAIN, 
BUT CONTINUE THROUGH THE WEEKEND OVER THE CENTRAL INTERIOR. 

RIVER LEVELS REMAIN ELEVATED WITH MUCH OF THE SURROUNDING TERRAIN
STILL SATURATED FROM WEEKS OF CONTINUOUS WET WEATHER. THIS MEANS 
THERE IS POTENTIAL FOR SHARP RISES ON RIVERS INCLUDING THE 
CHATANIKA, CHENA, LITTLE CHENA, SALCHA, AND GOODPASTER, AS WELL AS
SMALLER CREEKS AND TRIBUTARIES ACROSS THE EASTERN INTERIOR. 

LARGER RIVERS INCLUDING THE TANANA RIVER WILL BEGIN RISING EARLY 
NEXT WEEK AS WATER MOVES THROUGH THE SYSTEM. 

MUDSLIDES AND QUICK RISING STREAMS IN THE ALASKA RANGE, ESPECIALLY
NEAR DENALI, WILL ALSO BE A SIGNIFICANT CONCERN. 

FOR THE LATEST RIVER INFORMATION GO TO WWW.WEATHER.GOV/APRFC. 

FOR THE LATEST UPDATES VISIT WEATHER.GOV/FAIRBANKS


The weather pattern responsible for all this involves a strong upper-level trough over the Gulf of Alaska, with warm and moist flow reaching the interior from the southeast.  This bears some resemblance to the rainy weather setup in late June.  The precise origin of the forcing for this weekend's expected deluge is not quite clear at first glance, but there's no doubt about the magnitude of the rainfall signal in the model forecast - see below.


This latest onslaught of moisture will add to the year's precipitation surplus and will favor increased permafrost thawing this summer.  That's according to the conclusions of a new paper published by Tom Douglas of the Army Cold Regions Lab in Fairbanks:


This work was highlighted by Ned Rozell back in June:


The paper shows that permafrost active layer (seasonal thaw layer) depth increased significantly across a diverse set of locations near Fairbanks from 2013-2017, and there seems to be a correlation between the annual thaw depth and summer rainfall totals, with wetter summers tending to produce more thaw.  This makes sense, as surface water above 10°C carries a substantial amount of sensible heat as it percolates down to the 0°C top of the permafrost; and the effect may be multiplied in areas where thawing permafrost is subsiding, leading to greater liquid water influx from surrounding areas.

One slight surprise with the results (as discussed in the paper) is that the dramatic thaw in the record-wet summer 2014 was not reversed in 2015 or 2017, despite those summers being less wet.  But curiously, the rainfall data in the paper seems to be slightly off: the stated rainfall totals for 2015 and 2017 are quite a bit lower than what actually occurred in Fairbanks, so the "problem" is not as great as the discussion suggests.  As a recent post here showed, every year since 2014 has been considerably wetter than normal in Fairbanks (with the vast majority of the increase coming as rain), so it's no surprise that permafrost hasn't had a chance to recover.  And from the point of view of rainfall, it certainly isn't doing any better this year.

Update Saturday 5pm:

Here's a satellite loop showing the frontal zone developing over the southeastern interior.  Progress is a bit delayed, but big rain is coming.


Today's GFS forecast:


This afternoon's NWS forecast discussion is worth saving for future reference:
Northern Alaska Forecast Discussion
National Weather Service Fairbanks AK
222 PM AKDT Sat Aug 1 2020

.SYNOPSIS...
A significant storm system is expected to impact the Southern
Interior and Alaska Range beginning late this afternoon and
continue through late Sunday or Monday morning. A strong front is
expected to stall along a Fairbanks to Denali National Park line
and will produce very heavy rain, perhaps record setting rainfall
in the Alaska Range and Southern Interior. The front has slowed
down and will not arrive during peak heating this afternoon so
the chances for strong thunderstorms in the Central Interior have
diminished some, however chances for strong thunderstorms remains
high in the Eastern Interior this afternoon and evening. Very
heavy rain is expected through monday Morning including the Tanana
Valley where 1 to 3 inches of rain is expected through Monday
morning and in the Alaska Range especially near Denali National
park where 2 to 4 inches of rain is expected with local amounts
pushing nearly 6 inches. The potential for local flash flooding is
a very high across much of the Alaska Range, especially around
the Denali area. Elsewhere, cooler and showery conditions will
persist over the West Coast and Western Interior with continued
fog and stratus over the North Slope.

&&

.DISCUSSION...

Upper Levels and Analysis...
A strong ridge over the Central and Eastern Interior will weaken
and retreat to the north as strong upper level low over the
panhandle pushes northwest into the southeast interior this
evening and continues to push northwest into the Central interior
near Fairbanks tonight. 850 mb temperatures currently around 14
above will drop rapidly to around 6 above by Sunday afternoon.
Rapid cooling aloft combined with diluent flow aloft will produce
a closed low centered near Fairbanks late tonight and Sunday.
This closed low will produce northerly flow at the surface and
aloft over the Central Alaska Range and will enhance rainfall with
moderate upslope flow. The low stretches along an upper level
boundary along a line from Fort Yukon to Fairbanks to Denali
National Park. Very heavy rainfall is expected to fall along this
stalled front tonight through Monday morning. Over the North
Slope, southwest flow and a stationary front remain in place,
keeping showers and clouds and cooler weather there, as well.

Model Discussion...
The models continue to struggle badly on the timing and placement
and amount of heavy rainfall over the Central Interior and
Central Alaska Range even at less than 6 to 12 hours before the
start of the event. We utilized a blend of models again with a
heavier weighting of the ECMWF due to its consistency over the
last several runs on the timing, placement and amount of heavy
rainfall and retained reasonable continuity with previous forecast packages and latest model updates. The heavier weighted ECMWF forecast favors widespread heavy rainfall from the Alaska Range to the Tanana Valley, thus ongoing flood watches will remain in place. Very small differences in feature location will result in significant differences in timing, placement and amounts of heavy rainfall especially with the upslope precip enhancing and downslope precip limiting terrain of the Alaska Range with very subtle changes in wind direction. Central and Eastern Interior... A very nice afternoon with sunny and warm conditions ongoing over the Central and Eastern Interior as the upper level ridging continues to build and temps rise into the 80s. We will likely make a run at the warmest day of the summer this afternoon before a strong front pushes in from the east. The sunny, nice weather will deteriorate rapidly beginning late afternoon over the Eastern Interior and this evening over the Central Interior as a strong front pushes into the area from the southeast. Strong thunderstorms are expected to develop over the Fortymile Uplands, Eastern Alaska Range and White Mountains then move westward late this afternoon and evening. Instability will be very high as CAPE values will exceed 1500-1800 j/kg, a high value in Alaska for instability. Storms will produce may produce torrential rainfall in excess of an inch per hour in some areas, along with hail, deadly and frequent lightning, and strong winds. By late evening and overnight, the storms will merge into a complex and shift west over the Tanana Valley and Western Alaska Range northward into the Central Interior. There remains some uncertainty on the exact timing, location and amounts of the heavy
rainfall but at this point we expect heavy rain rain over the entirety of the Alaska Range with moderate to heavy rainfall over the Tanana Valley by late tonight and Sunday morning. Expect rainfall to continue through Monday morning, at least, with the potential for 1-3" of rain in the Tanana Valley including Fairbanks and 2-4" across the Alaska Range, highest values near Denali possibly reaching 6 inches through Monday morning. Thunderstorms and moderate rainfall will also impact areas north including the southeast Brooks Range and Yukon Flats, although flooding rainfall is not expected. West Coast and Western Interior... Quiet weather will persist out west, especially along the coast as a northerly wind gradient at the surface increases. Some fog and
stratus will remain a problem over the immediate coasts, however, Interior will gradually warm up with threats for isolated thunderstorms each afternoon through Monday. North Slope and Brooks Range... A stalled front continues to sit over the North Slope, bringing light rain and continued clouds. This will weaken, and southerly flow will increase over the eastern half of the Brooks Range and North Slope tonight and Sunday, bringing rain and possibly an isolated thunderstorm over the southern slopes of the Brooks Range. This will last through Monday while the remainder of the North Slope will continue to see cooler and stratus/fog conditions given the light onshore northeast flow. Coastal Hazard Potential Days 3 and 4...None. && .FIRE WEATHER... One final hot day is in store for the Central/Eastern Interior this afternoon before a powerful storm rolls through this evening and overnight. There will likely be a lightning outbreak over the Eastern Interior with widespread lightning, but storms will also bring copious rainfall. Extensive thunderstorms will also impact the drier areas of the Interior including the Yukon Flats. Expect heavy rainfall from the Alaska Range to the Central Interior and Tanana Valley through Monday. Cool abut mostly dry with isolated
thunderstorms will be the main story over the Western Interior. The West Coast will remain cool and dry. && .HYDROLOGY... The focus continues to be an incoming heavy near record setting rain event for parts of the Central and Eastern Interior beginning late this afternoon and into Monday. Models continue to struggle with the placement of the heaviest precipitation in the Interior (see model discussion above), but the emerging concensus is a broad area from Delta Junction to Fairbanks to Lake Minchumina southward into the Alaska Range with 1 to 3 inches of rainfall; the highest bullseye of rainfall of 2 to 4 inches with 6 inches locally remains the Alaska Range near Denali National Park through Sunday. Flood Watches remain in effect for these areas. Expect sharp rises on smaller rivers including the Chena, Little Chena, Salcha, Nenana, Delta, and Goodpaster Rivers with continued rises along the Tanana from Fairbanks west. Rock and mud slides are possible in the steep terrain of the Alaska Range along with the possibility of local flash flooding in torrential rainfall.

Saturday, June 15, 2019

Permafrost Update

Back in September I posted some brief analysis of soil temperature profiles at one of the Fairbanks monitoring sites run by UAF's Permafrost Laboratory.  Not surprisingly (in view of the remarkable warmth of recent years) the data showed a dramatic warming trend, and so it's of interest to do an update now that another year of data is available.

The charts below are the same as before, but with 2017's annual values appended with the dashed black lines.  2017's mean temperature was slightly lower than 2016 in most of the column, and the annual minimum was lower than for 2016 at each level between about 0.25m and 1.5m depth.  We know why this is: winter 2016-2017 was cooler than the other winters since 2013-14, and March 2017 in particular was unusually cold, so this provided a slight recovery in the condition of the permafrost.

Readers will note that the warming trend apparently continued unabated at the top layers just below the surface, but this appears to be at least partly related to some rather substantial ground subsidence relative to the temperature instrument in recent years.  From 2007 through 2016, the second level below ground was reported as 12cm, but in 2016-17 this changed to 8cm, and in the most recent year (2017-2018) it was reported as only 4cm.  The top-level sensor started at 2.5cm below ground but is apparently now 6cm above ground!  I haven't made the vertical adjustment on the chart, but obviously this could make a rather big difference at the top levels.


It's worth looking again at the temperature trace from the sensor at 0.525m (now 0.44m) - see below.  The effect of March 2017 is obvious, but I think what is more striking is the fact that this level almost failed to re-freeze in the subsequent winter (2017-2018); the temperature didn't drop below freezing until March 14, the minimum was -0.24°C on April 11, and it was back up to -0.09°C by the end of the data series on June 1.

Of course winter 2017-2018 was very warm in Fairbanks (13°F above normal in December), but the unusually deep snow cover probably also contributed to the lack of a subsurface cold wave in late winter; the ground was well insulated from the cold above, and there wasn't much cold to diffuse downward.


These results are all taken from just one location; what about others?  I did similar analysis with data from two sensors at the Bonanza Creek ecological research site, which is about half way between Fairbanks and Nenana.  At the first sensor, the trends since 2010 are similar to those at Smith Lake, but 2017 produced very similar temperatures to 2016 instead of seeing a small recovery towards colder conditions.  (Note that the sensor depths have trended in the opposite direction at this location, with the top sensor dropping from 7cm in 2010 to 11cm in 2017-18.)


The temperature time series at 52cm depth is quite remarkable when we look at the late winter minima; there has been a stair-step pattern of 2°C increases at two-year intervals (2014, 2016, 2018).  And just like at Smith Lake, the last winter in the series shows no hard freeze at this level about 20 inches below the surface; the winter's minimum was only -0.1°C.


The same thing is evident closer to the surface; even at the shallow level of 22cm (now 26cm), the 2017-2018 winter minimum was only -0.7°C.


And for comparison, here's a quick look at the same levels from the second permafrost site at Bonanza Creek.  It's essentially the same story, although winter 2015-2016 also saw very minimal re-freeze at the half-meter depth.


In conclusion, it's striking to see the rapid pace of change at these permafrost sites in interior Alaska.  Not only has warming occurred throughout, and the active layer deepened (i.e. seasonal thaw extends deeper), but we're seeing layers that were formally permafrost now almost fail to refreeze in winter (e.g. 0.5m level at Smith Lake).

In last September's post I said that "Smith Lake #1 may soon see seasonal ice atop permanent thaw", but I wasn't imagining that something like this would appear in the very next year of data.  What will the next annual update reveal?

Friday, December 7, 2018

North Slope USGS Data

A couple of months ago, word emerged of a new USGS data set that documents 18 years of climate measurements on the North Slope.  Starting in August 1998, automated stations began to be installed in locations within the National Petroleum Reserve-Alaska and the Arctic National Wildlife Refuge, and 16 sites are currently operating.  Here's a map of the locations (click to enlarge):


And here's the link to the data set:

https://pubs.er.usgs.gov/publication/ds1092

In Rick's words, this is likely a gold mine of North Slope climate information.  I started by taking a look at the ground temperature data - so this post is something of a follow-up to my brief comments on Fairbanks sub-surface data back in September:

https://ak-wx.blogspot.com/2018/09/permafrost-data-first-look.html

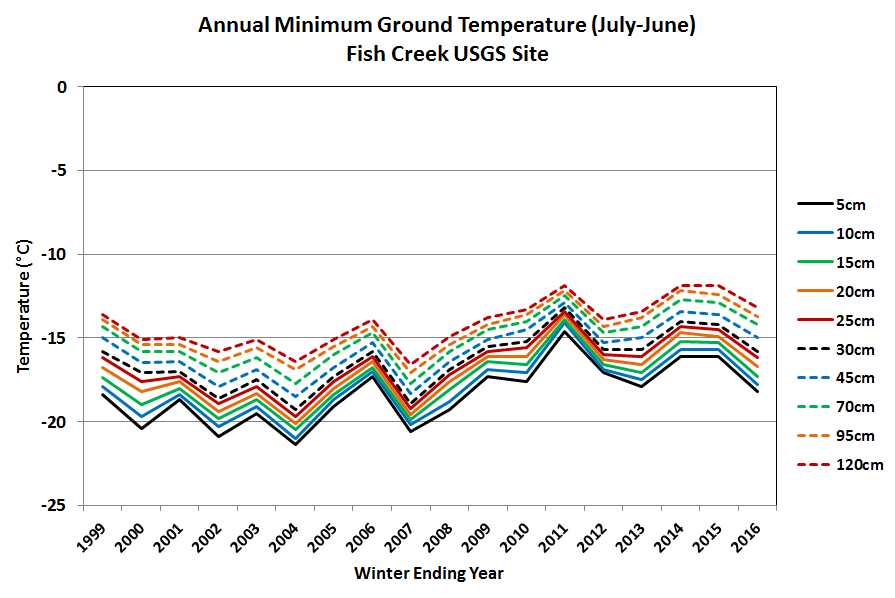
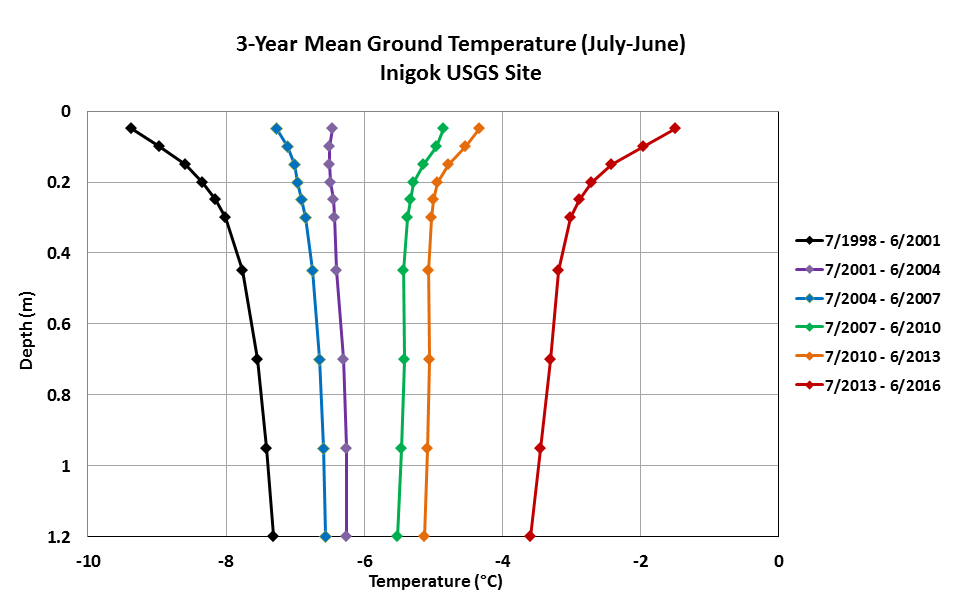
Five of the USGS sites have complete ground temperature data on at least 90% of days over the 18 years in the data set (August 1998 through July 2016), and the most complete data series is from the Fish Creek site, which is just a few miles from the coast between Teshekpuk Lake and Nuiqsut.  Here's a chart of mean temperature by depth for six 3-year periods spanning the 18-year period of record (it's easier to digest 6 lines than 18).


No surprises in these results - there was a substantial amount of warming over the period of record. There's also a warming trend in the seasonal minimum temperatures at each depth:


The annual maximum temperature chart is a bit more intriguing - see below.  At the lower levels there is a warming trend, but closer to the surface the summer's peak temperature has been lower in recent years; the cooling trend at 5cm depth is rather striking.


Looking only at data from the top level, the entire history of daily maximum temperature shows an interesting contraction of the annual range after about 2010; winter temperatures have not dropped as low in recent years, but peak summer temperatures have been reduced.  (This is not to say that the two effects have cancelled each other out - far from it, as the first chart above demonstrated.)


There are at least a few possible explanations for the apparent cooling trend in peak summer temperatures at the upper ground levels at Fish Creek.  Of course there could be systematic error or bias, perhaps from vertical displacement of the instruments over time due to freeze-thaw processes - although the Fish Creek site is not listed as one that experienced a lot of vertical "jacking".  Systematic trends may also have been introduced by changes to vegetation; perhaps increased growth has provided more efficient shading of the ground surface.

Another possibility is that summer cloud cover has increased over the period of record, leading to a loss of very sunny days at the warmest time of year.  A cursory look at the solar radiation data from the Fish Creek site supports this hypothesis, and I'll look into it for another post.

It's worth noting that the other sites with mostly complete data show mixed results in terms of the annual maximum temperature trends.  The data from Umiat show a very similar pattern to Fish Creek, but the others do not.  Note that there is a certain amount of missing data at all these sites and this undoubtedly affects the analysis of annual extremes (i.e. if you miss a few days, it can make a big difference).


For the sake of completeness, here are the mean temperature results from the sites with reasonably complete data.  The acceleration in warming at Tunalik and Inigok is rather striking, although the Inigok results are definitely affected by missing data for most of the winter of 2014-2015.  Accelerating warming at Tunalik is more plausible, as this site is the farthest west in the USGS array and sits close to the rapidly warming Chukchi Sea.


Tuesday, September 25, 2018

Permafrost Data - a First Look

Prompted by a question from reader Tracy on permafrost depth in Fairbanks, I recently tracked down some soil temperature data at the UAF Geophysical Institute's Permafrost Laboratory, headed by Professor Romanovksy.  A wealth of data is available, so I chose a site more or less at random: Smith Lake #1, located close to Smith Lake on UAF's North Campus.  Daily temperature data are provided from 2007 through May 2017, which is long enough to provide a few interesting results.

First, the chart below shows the sequence of annual mean temperatures at depths down to 3m (click to enlarge).  Immediately we're struck by a remarkable trend towards higher temperatures in the past decade or so, with the top 50cm seeing an annual mean temperature above freezing in 2016.  There was a big jump between 2013 and 2014, which is not surprising as Fairbanks' mean air temperature was more than 7°F warmer in 2014 than in 2012.  And ever since the remarkable transition from cold to warm in May of 2013, Fairbanks has seen persistent anomalous warmth with few significant excursions to the cold side of the climate.  The integrated effect of this warmth is clearly visible now in the sub-surface warming trend.


Secondly, as a partial answer to Tracy's question about seasonal thaw of the active layer (i.e. the top layer of permafrost that thaws and refreezes each year), the chart below shows annual maximum temperatures at each depth.  (Note that the 2m depth is missing from 2014-2016).  From 2007 through 2013, the seasonal thaw did not generally extend down below 50cm, but more recently the active layer has deepened to something like 1m.


Looking at annual minimum temperatures, it is really remarkable to see that by 2016 temperatures below 50cm depth were barely below freezing even at the coldest time of year.  It doesn't take too much imagination to envision a complete loss of the permafrost in this particular profile, which would upend the ice/water profile: as it stands now, seasonal thaw sits atop permanent ice, but Smith Lake #1 may soon see seasonal ice atop permanent thaw.


For a bit more perspective on the recent changes, here's the temperature time series from 0.525m depth.  March 2017, which was the one really cold month in recent years, produced a minor recovery compared to previous years, but presumably last winter's warmth (not yet reflected in the available data) will have reinforced the warming trend as strongly as ever.


Friday, October 23, 2015

Warming Permafrost

A pair of articles related to North Slope environmental conditions caught my eye recently, one concerning warming permafrost and the other regarding Dalton Highway construction in response to flooding last spring.  I'll say a few words about the former today and look at the latter in a subsequent post.

In the first article, Vladimir Romanovsky of UAF is quoted as expressing astonishment at rapid rates of warming in permafrost near the Arctic coast, particularly in the last decade.  I'm not familiar with the literature of permafrost studies, so I haven't found published results illustrating the recent trends, but I did find some informative figures at the permafrost database site.  Looking at the "west dock" measurement location at Prudhoe Bay, the following figure shows a striking trend of long-term warming through 2010, and if the professor was accurately quoted, then I'm sure the trend has continued or even accelerated in the past 5 years.
The following chart only extends through 2007, but it shows a similar pattern of significant warming.


A third chart from the database site focuses on temperatures close to the surface, and in this case there is no obvious trend.


I verified the lack of a warming trend in the near-surface temperatures by downloading the daily measurements at 0.85m depth - see below.  The summer peak in temperature at this particular location showed only a very small increase over the decade ending in 2012 (the most recent available).


If we look at air temperature measured near Prudhoe Bay (see below), we see that 2014 and 2015 year-to-date have brought some of the warmest conditions on record, and this may have produced the acceleration in sub-surface warming that the professor seems to be alluding to.  Note that the 1998 spike in temperatures appears to have been responsible for the rapid warming observed between 1998 and 1999 in the first chart above, so it's quite possible that a similar thing has happened again lately.  I'll see if I can obtain some more recent borehole data to document the latest changes.


A note on the chart above: I've combined the climate data from the old Prudhoe Bay observing site (through May 1999) with data from the Deadhorse airport just a few miles to the south (since June 1999).  Deadhorse is a bit colder, being located farther from the moderating influence of the ocean, so the warming trend would actually be a bit steeper if we had observations from the same location over the entire history.  Nevertheless, the temperature drop from 1998 to 1999 was definitely real, as a very similar drop was also observed at Barrow.