Wednesday, November 9, 2022

October Climate Data

First, an update on freeze-up at a couple of points of interest (at least to me).  The Tanana River at Nenana is partially but not fully frozen over, and the Yukon River over at Dawson appears to be frozen just downstream of town, but surface water is still moving in front of the webcam.  Beautiful light in both scenes:


And now looking back at October's climate anomalies: NOAA/NCEI data indicates that the month's temperatures were (a) far above normal in Southeast Alaska, (b) modestly above normal along the rest of the Gulf Coast, and (c) near the normal of the last 30 years for the rest of the state.

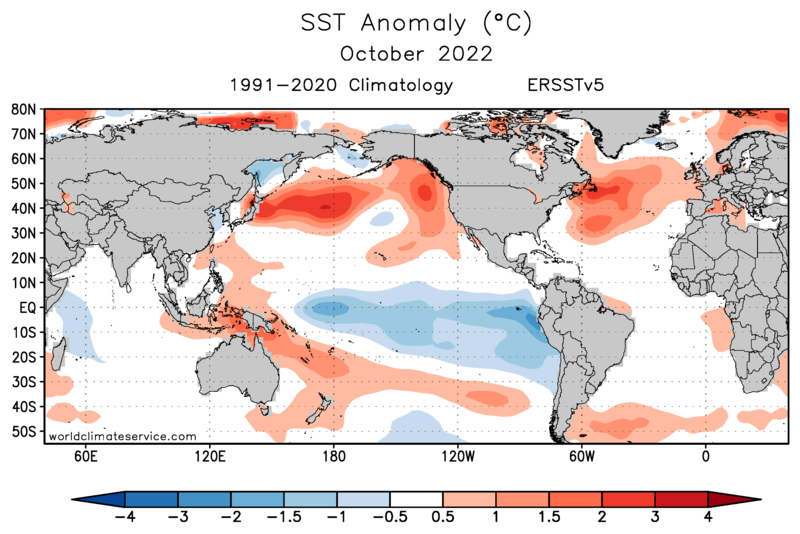
For the South Panhandle division, October tied the 1986 record for warmest October in the entire history since 1925.  This outcome is closely linked to the extremely warm sea surface temperatures across the northern North Pacific:

As for precipitation, October was another wet month compared to normal, the fourth in a row for the state as a whole.  The statewide July-October total precipitation was easily the highest on record, and the year-to-date statewide precipitation has also moved into first place in the history (1925-present).

Interestingly, this is the first year since 1981 to fall in the top 10 for January-October precipitation statewide.

The ERA5 gridded reanalysis data agrees quite well this month, with the exception of precipitation for the North Slope (see below).  Of course the error bars on North Slope precipitation estimates are very large because of the regrettable paucity of ground-truth observations.  For what it's worth, Utqiaġvik reported 1.01" of liquid-equivalent precipitation, the fifth highest in the past 30 years, and the SNOTEL sites along the Haul Road recorded near-normal to above-normal precipitation.


The Gulf Coast and southeast interior were much windier than usual, according to ERA5, but apparently western Alaska was relatively calm.  This is a bit of a surprise, given the lower-than-normal pressure over the Chukchi Sea.

As for sunshine, it was in short supply again for southern and eastern Alaska.


I'll update this post tomorrow with October's temperature reports from around the wider Arctic region.

Here we go: October's departure from the 1991-2020 normal temperature at 32 Arctic sites:


Here's the anomaly in terms of standard deviations: it was a significantly unusual month in central Arctic Russia.

The year to-date is running 2.8°C above the 1991-2020 normal at Russia's Tazovsky station, and that's good for the 3rd warmest year on record so far, after 2020 and 2016.  On the cool side, Kotzebue is running 1.1°C below normal, which is similar to last year through October.


Monday, November 7, 2022

The 2010 Similarity

Yesterday I mentioned 2010 as a similar year for climate in the past, noting that the very high MSLP in Fairbanks yesterday nearly matched the November record high pressure that was set in 2010.  That record was set on November 17, and within a week Fairbanks was shut down by a tremendous ice storm caused by record-breaking rainfall.  Here's one in a sequence of blog posts by Rick Thoman during that 2010 event:

http://ak-wx.blogspot.com/2010/11/rain-records-again.html

Alarmingly, Rick noted today that the forecast for the middle of next week looks very indicative of rain.  It's still some way out, and the forecast could change a lot, but as we've seen many times in recent years, any amount of rain would be very bad news.

Let's hope the 2010 similarity doesn't play out any further.

Sunday, November 6, 2022

Cold High Pressure

A strong ridge moving across the Bering Sea and western Alaska since Friday has produced very high pressure at the surface for interior and eastern Alaska, and so, like clockwork, we have cold in the valleys, with strong temperature inversions.

Here's the MSLP chart from 3am AKST this morning:


In Fairbanks the airport reported MSLP of 1050.2mb at 6am, which according to Rick Thoman is "just shy of the November record of 1051.4mb set in 2010".  Interestingly, 2010 had a number of similarities to this year in terms of global climate, including a strong La Niña with a negative Indian Ocean Dipole in autumn, and terrible monsoon flooding in Pakistan in late summer.  It may be no coincidence that we're seeing a similar weather event for Alaska at the moment.

Rick commented on the 2010 MSLP record at the time:

http://ak-wx.blogspot.com/2010/11/big-high-coming.html

Here's an animation of the 500mb ridge progression from Friday morning to Tuesday morning (predicted):

Not surprisingly, temperatures dropped off impressively last night, with -20s seen widely in the valleys of the eastern interior.  As usual the coldest spots around Fairbanks-land were Goldstream Creek (-20°F), UAF Smith Lake (-23°F), and North Pole (-24°F).  Farther afield, the CRN site southeast of Northway reached -29°F and Chicken saw -31°F.

The morning sounding from Fairbanks shows the hefty inversion, and indeed the temperature hasn't dropped below 0°F at the higher elevations around Fairbanks (Cleary Summit, for instance).


Surprisingly, the Yukon is not yet frozen upstream at Dawson:


Below is a chart of temperatures over the last two weeks at Smith Lake on UAF's North Campus, illustrating the sharp drop-off yesterday.  Note too the difference between the blue and green lines: blue shows the temperature at 8m above ground, and green the temperature at the standard 2m above ground.  A difference of about 5°F is typical on clear, calm, cold nights, demonstrating how shallow the strong surface-based inversion is in these particularly cold locations.


Wednesday, November 2, 2022

Follow-Up on Temperature Extremes

Temperatures have dropped off very sharply in the last 10 days for most of Alaska, and the first well-below-zero readings have appeared in the usual cold spots.  So far the Chalkyitsik RAWS is "in the lead" with -30°F yesterday morning.

This is only slightly unusual for the date: in the last 20 years, it has been typical for -20s to appear somewhere in the state by early November.  Just two years ago on this date it was -40°F in Chicken.

For the state as a whole, though, the cold is unusual; it's the most significant below-normal spell for the statewide temperature index since early August.  Of course, the absolute magnitude of the departure from normal is now much greater than it was in summer, because temperature variance is so much higher in the cold season.

It's worth reviewing data from the last couple of years to see how abundant "extremes" of both warm and cold have been.  For background, in March 2021 I used ERA5 reanalysis data to look at the imbalance in warm versus cold extremes for (most of) Alaska's land area, and it was interesting to note that the occurrence of cold extremes had dropped off in recent years even after detrending the data.  In other words, even relative to the modern warmer baseline, there had been an absence of significant cold for several years, in both summer and winter.

Note that here I'm using a threshold of 2 standard deviations above or below normal (or trend) to define an "extreme".  For reference, Sunday's notably chilly high temperature of only +7°F in Fairbanks was 1.35 SD below the 1991-2020 normal; a 2 SD cold anomaly would have meant a high temperature near 0°F, or a low temperature near -18F.

Here are updated charts for the land area coverage of these warm and cold extremes in June-August, relative to a trend-line normal.  The land area box includes all of Alaska west of 141°W, i.e. excluding Southeast Alaska (where ERA5 does not do well with surface temperatures because of topography).


 This summer brought a notable uptick in cold extremes relative to trend, and somewhat surprisingly (because southern and southwestern Alaska were very warm in June) there wasn't an over-abundance of +2SD daily warm extremes.

Below are the equivalent charts using a fixed 1981-2020 baseline; as expected, this summer's cool extremes did not rise to the level of many years prior to 2010.  I think it's also interesting to note just how severe the 2022 wildfire season was despite an excess of extreme warmth; I surmise that this is because it was driven by extreme drought, persistent but less-extreme warmth, and numerous lightning ignitions.

As for winter, the ERA5 data shows a relative lack of warm extremes in the past two winters, even relative to a fixed climatology.  This certainly reflects the influence of a persistent La Niña with a negative PDO phase; these large-scale climate phenomena prevented a recurrence of the excessive warmth of 2013-14 through 2018-19.


Last winter also produced more cold extremes than in the prior 8 winters - mostly in November last year, which was the coldest November statewide since 2011.  But just like this summer, overall the winter of 2021-2022 wasn't particularly unusual compared to the colder winters of earlier decades.


It will be interesting to see where we go from here.  With La Niña still hanging around, there's a good chance we'll see at least some episodes of quite unusual cold in the coming months, and a return to pervasive warmth seems a bit unlikely in the near future.  However, the CPC's latest seasonal forecast for December-February only hints at increased odds for significant cold in Southeast, and the warm tilt has increased since last month for western Alaska.


Friday, October 28, 2022

Rare Early Ice Jam?

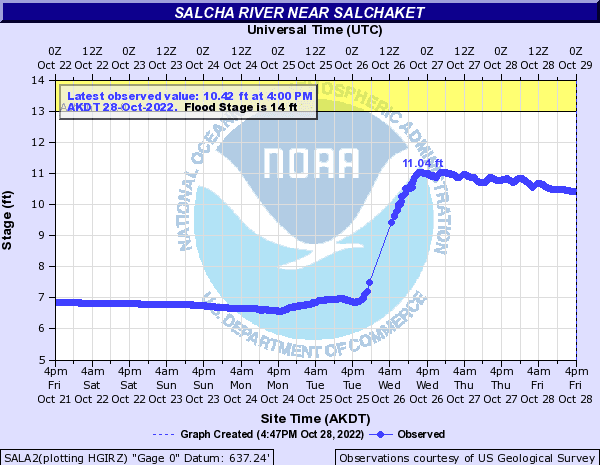
Here's a puzzle for readers, concerning events on the middle Tanana River right now.  In what would be a very unusual event for the time of year, the Tanana River appears to have developed an ice jam yesterday near Fairbanks, causing the river gauge to register a rise of over 6 feet from yesterday morning to yesterday afternoon.  The water has been dropping only very gradually today.


The odd behavior is confirmed by this report via Twitter:


Water "flowing the wrong way" certainly suggests a jam.

My understanding is that it's very rare to see a genuine ice jam on a large river like the Tanana at freeze-up, because the ice is thin and easily dislodged; it's a totally different situation from spring ice jams.  However, with ice developing and increasing during freeze-up, a jam that develops at this time of year can be very persistent and even cause chronic flooding throughout the winter.  This may be a long-lived story.

Having said all that, though, there's a puzzle here: the Salcha River apparently had a very similar rise about 36 hours earlier.  If a single ice jam were the problem, and water were backing up, the rise would have occurred much later at the Salcha gauge, which is about 40 miles upstream from the Fairbanks gauge.  The Salcha-Fairbanks sequence looks more like a big volume of water is making its way downstream, although of course there may be more than one jam.


So which is it, ice jamming or a big new volume of water?  We should find out more sometime tonight, when we would expect a downstream-propagating rise to reach Nenana (another 40 miles downstream).  So far Nenana has seen a drop that aligns rather well with the rise upstream at Fairbanks, so this looks more consistent with the ice jam hypothesis (water held back and volume decreasing at Nenana).


I wonder if reader Gary wants to take a peek from his aircraft?  (Only joking, I imagine the NWS will bear that expense and solve the puzzle soon.)

Here's the evening scene at Nenana:

Update Saturday morning:

No rise overnight at Nenana, and a new observation: the Kuskokwim River at McGrath also saw a sudden and significant rise early yesterday.  It seems that ice jams are occurring widely during freeze-up this year.  But why?  Does anyone recall this happening in any previous year?

Update Sunday evening: another sudden rise, this one on the Koyukuk River at Hughes:


And another on the upper Susitna River.  Clearly this is what freeze-up looks like for interior Alaska this year.


Tuesday, October 25, 2022

Wintry Storm, Ice Notes

The weather map is looking a bit wintry this evening, with heavy snow for parts of the southwestern interior and west coast, courtesy of a strong Bering Sea storm.  A cold air mass is settling into northern and eastern Alaska.  In short, autumn is over.


The Bering Sea storm has intensified on approach to the Y-K Delta region, and has a central pressure near 970mb at present.  It will redevelop tomorrow in the northern Gulf of Alaska, reaching about 960mb not far from the northern Gulf coast; that's a strong storm for the time of year.


Ice is running in the Chena and Tanana Rivers, but not a whole lot just yet.  With cold in the forecast, there will be a lot more by the end of the month.


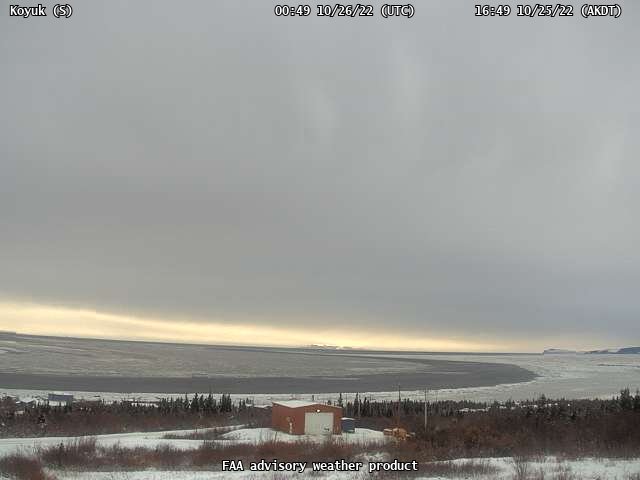
Freeze-up is progressing more substantially on the Koyuk River:


On another note, a question from Rick Thoman today prompted me to update a graphic showing the ice-free season along the Northern Sea Route (Arctic Russian waters) in the past two decades.  As I noted earlier, there was speculation in early August (by the NSIDC, no less) that the NSR might not open this year, but the situation turned around quickly in August in the East Siberian Sea.  In the end, there was a window of about 45 days for ice-free navigation (judging from the NSIDC Sea Ice Index maps).


Friday, October 21, 2022

Arctic Temperature Update

Back in June 2021, I wrote about a set of 32 longstanding climate sites that should allow for a reasonably comprehensive ongoing assessment of "ground truth" Arctic air temperatures over land; so it's time for an update.  One reason I think this is worthwhile is because global reanalysis models - a common and generally excellent source of information about climate variability -  tend to struggle with Arctic temperatures because of deficient representations of sea ice, snow, cloud, and radiation physics.  For example:

On the warm bias in atmospheric reanalysis induce by the missing snow over Arctic sea-ice

Evaluation of Six Atmospheric Reanalyses over Arctic Sea Ice from Winter to Early Summer

Of course there are also significant difficulties with long-term temperature trends at surface observing sites - there's no really "pristine" long-term surface data - but it is interesting to take a look at the month-to-month and year-to-year variations for sites with relatively long and stable histories.

With that in mind, here's what the GHCN data has to say about summer 2022 at 30 of my 32 sites (the other 2 had quality control flags this summer):


Kotzebue was the coolest of the lot, with the coolest summer since 2006.  This is actually the third consecutive summer with an average temperature below the 1991-2020 normal in Kotzebue, but this summer's temperature would have been normal about 60 years ago.

More broadly for these Arctic land sites, summer 2022 was a bit warmer than 2021 but cooler than 2020.


Below are the monthly temperature anomalies from May-September this year, expressed in terms of standard deviations.


Two of the monthly site anomalies stand out as being particularly unusual.  Barentsburg on Svalbard had its warmest June on record by some margin, and it was also - easily - the most anomalously warm month on record in terms of standard deviations (compared to the 1991-2020 climate).

The same was true of Hall Beach (locally Sanirajak) in Nunavut in July: warmest July on record, and most anomalously warm month on record.  But we need to put an asterisk by this one, because an alternative site at the same location, which does not report as reliably, was not quite as warm: only 2.4 standard deviations above normal.  The previously more reliable site that I used for the map above seems to have been running warm since May - an example of a problem with surface station data.

Looking at a longer-term view of monthly anomalies since 2010, the 32-station mean seems to have come down slightly in 2021 and 2022 compared to the post-super-El Niño warmth in 2016-2020, and that may be because of the persistent La Niña in the last two years.  There's been an absence of very large positive temperature anomalies since winter 2020-21, but that's mostly because the Arctic was relatively cool last winter, at the time of year when anomalies are largest in amplitude.


When the anomalies are standardized by monthly variance, the 32-station maximum jumps up dramatically because of the Barentsburg and Hall Beach anomalies this summer.  Also, notice that while the 32-site average may have avoided jumping to new highs, there has also been an absence of significant cold this year: none of the sites has been below -1.5 standard deviations so far this year.

And check out last March: warmth was remarkably widespread, with the coldest site being only 0.2 standard deviations below normal.  This itself is a record for "lack of cold" at any of the sites.  The history of this data does not yet have a month with all 32 sites above the 1991-2020 normal, but it will probably happen sooner or later.