Showing posts with label Variance. Show all posts

Friday, April 14, 2023

A Belated Extreme

While the cold snap this month has been most pronounced and unusual for western Alaska, it's been very chilly in Fairbanks too.  On Monday and Tuesday of this week the daily mean temperature was only 1.5°F, which is nearly 3 standard deviations below normal - a very unusual event.

Here's an interesting statistic: the week ending yesterday in Fairbanks saw the largest departure from normal of any 7-day period in the entire winter, and that's quite remarkable given that temperature variability typically drops off a lot by April.  The week ending December 22 was a close second for largest departure from normal.


However, this cold spell still pales in comparison to the 2021 cold snap, when Fairbanks had a daily mean temperature of -12°F on April 9 (41°F below normal, or nearly 4 SD below normal).


Rick Thoman penned a summary of the cold spell as of Wednesday, noting that the recurrence of severe April cold in recent years is starting to become a bit intriguing:

https://alaskaclimate.substack.com/p/april-cold-snap-in-western-alaska

Reader Gary asked about temperature variability and the lack of extremes this winter, and it certainly is true that Fairbanks has had a benign winter from the standpoint of temperature extremes (until now).  In December through February, only 8 days had a daily mean temperature below -20°F or above +20°F, and looking back at the history, only 1930-31 and 2020-21 (there it is again) had fewer such days.

As for the variance of daily temperatures across the broader winter season of November through March, this winter had the 4th lowest variance on record, with 1997-98 holding the title for least variable.  (Note that I'm calculating variance using daily temperature departures from normal, not absolute temperatures.)  Here's the very unusual temperature trajectory from winter 1997-98, when the most powerful El Niño on record prevailed across the tropical Pacific.


Reduced temperature variance is a common feature of El Niño winters in Fairbanks, as I discussed back in 2016, during the last super El Niño:

https://ak-wx.blogspot.com/2016/02/lack-of-cold-and-low-variance.html

Here's another post, showing that El Niño tends to produce a stable flow pattern, whereas the circulation tends to jump around more than normal during La Niña.

https://ak-wx.blogspot.com/2015/09/enso-height-patterns.html

This of course means that the lack of variance this winter is particularly odd, given that it was a La Niña winter!  Both cold and variance were missing until now; but perhaps they were not sorely missed.


Sunday, March 6, 2022

Cold versus Warm Variance

In the past week I've been thinking about temperature volatility and the fact that it tends to be higher in Alaska winters during La Niña, when colder conditions are favored overall.  This suggests a possibility that cold weather regimes are inherently less stable and persistent than relatively warmer weather regimes; so you're more likely to see similar conditions persist when it's warm than when it's cold.

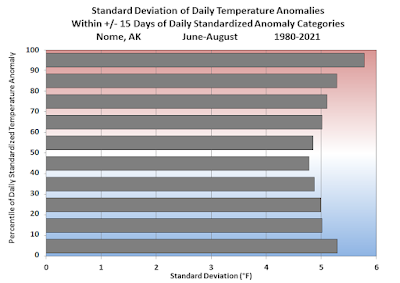
But does the data support these conjectures?  To address this, I took the daily mean temperature in Fairbanks winters from 1980-2021 and calculated the daily standardized departure from normal, i.e. the difference from the 1981-2010 normal (for convenience) in terms of standard deviations.  I then sorted the more than 6000 daily values into 10 equally populated categories, and finally for each category I calculated the standard deviation of temperature within +/-15 days of each individual day.  Here's the result:


This shows that, for example, the standard deviation is over 15°F within +/- 15 days of the coldest 10% of Fairbanks days in November-March.  This is the highest variance of any of the categories and supports the hypothesis that the highest volatility occurs when it's much colder than normal.  However, the variance is also enhanced when it's very warm - but not quite as much as when it's cold.

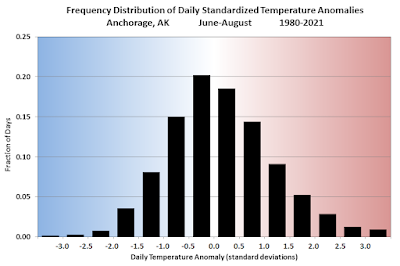
Thinking a bit more about this, the result above is partly a reflection of the slight negative skew in winter daily temperatures in Fairbanks.  Here's a histogram of the daily standardized temperature anomalies: the median is slightly above zero, because I used an outdated 1981-2010 normal, and the distribution has a slightly longer tail on the cold side.


In a situation with negative skew, it's clear that negative departures tend to be larger in magnitude than positive departures, and that's the same thing as saying that the variance is higher on the cold side.

However, there's a bit more to this than just skew: I also calculated the frequency with which the temperature reverses to the other side of normal in the next 15 days, for both the coldest and warmest categories of daily temperature.  When temperatures are in the lowest 10%, there's a 9.0% chance of an above-normal temperature occurring within the next 15 days, but when temperatures reach the highest 10%, the frequency of below-normal within 15 days is a bit less, at 8.5%.  So this too reflects the fact that cold gives way to warm slightly more often than warm gives way to cold.

Interestingly this "sign reversal" statistic is very similar for summer in Fairbanks: 9.5% versus 9.0% (cold to warm versus warm to cold, respectively).  However, the skewness is almost zero in summer, and there's no difference in variance between the coldest and warmest decile categories.


How about other locations in Alaska?  Winter temperatures have a more significant negative skew in Anchorage, where cold interior air sometimes makes an appearance, and so variance is easily the largest when it's cold.


It's the same story at Juneau, which has a very pronounced negative skew in winter daily temperatures:


Like Fairbanks, both of these sites also have a higher frequency of reversing from the lowest decile to above-normal than from the highest decile to below-normal.  This is interesting, because the lowest decile is farther from "normal" than the upper decile, so a bigger change is required to make that reversal when it's cold.

However, the skewness is reversed for Anchorage and Juneau in summer, because the maritime influence then suppresses variance on the cool side.  Consequently, temperature variance is highest at the upper end of the distribution in summer.


While I'm at it, here are results from Utqiaġvik and Nome.  The former sees considerable positive skewness in both summer and winter, with the greatest variance on the warm side, although the extreme warming trend might make a difference to this analysis.  Nome is more aligned with the rest of the state, with negative skew in winter and positive in summer.


Here's the "sign reversal" statistic for all 5 sites.  Again, this shows the percentage of time that an opposite-sign anomaly occurs within 15 days of the lowest and highest deciles respectively.

WinterCold to WarmWarm to Cold
Fairbanks9.0%8.5%
Anchorage9.1%8.4%
Juneau8.9%8.0%
Utqiaġvik8.3%8.6%
Nome8.6%8.9%


SummerCold to WarmWarm to Cold
Fairbanks9.5%9.0%
Anchorage9.0%8.7%
Juneau9.4%9.5%
Utqiaġvik9.6%9.1%
Nome9.3%9.5%

One more comment before I close.  It seems physically reasonable that cold tends to be associated with greater variability, because cold in Alaska is usually associated with a blocking ridge over the Bering Sea or Arctic Ocean - and these patterns can bring huge variations in temperature with relatively small shifts in the position of the ridge.  On the other hand, warmth in Alaska - especially in winter - is associated with a strong Aleutian trough and a ridge over western Canada, and this tends to be a more stable pattern bringing indiscriminate and persistent warmth over most of Alaska.

In other words, because typical cold and warm patterns in Alaska are not at all opposite to each other, they behave differently.  As a very broad and overstated generalization: when cold comes, it's relatively fierce but tends to be short-lived, whereas warm tends to be a bit less amplified but more persistent.

Saturday, February 26, 2022

Rapid Changes

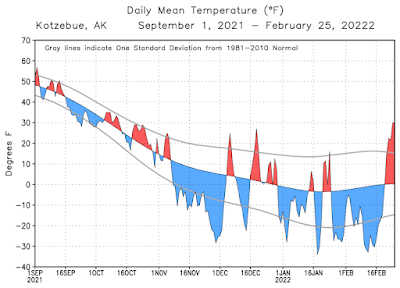
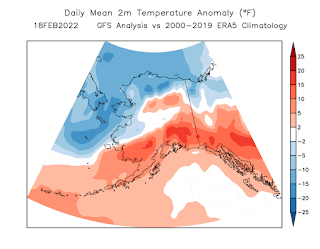
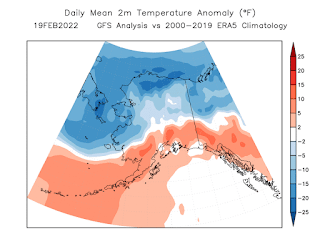
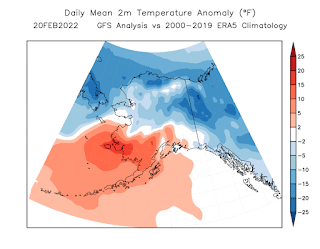
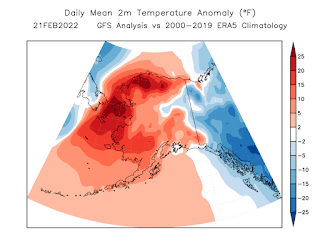
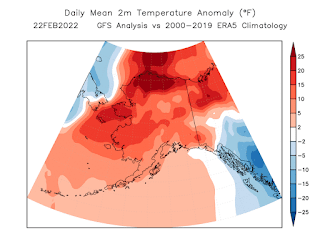
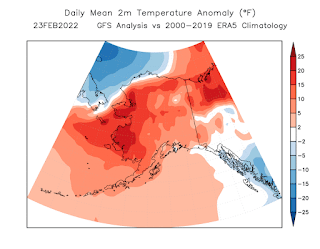
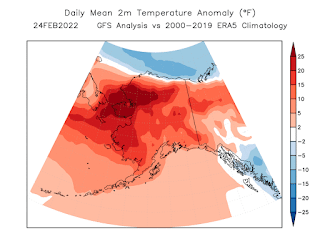
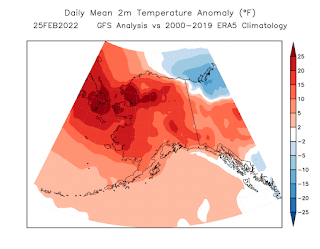
Alaska's roller coaster of temperature swings this winter has produced another dizzying change in recent days, with widespread warmth enveloping much of the state since Monday.  The warm-up was very dramatic in western Alaska and brought a sudden end to persistent cold in the northwest.  In particular, Kotzebue had been stuck in a cold pattern since late January; minimum temperatures were in the -30s F for a week recently, but the past two days have seen above-freezing temperatures.


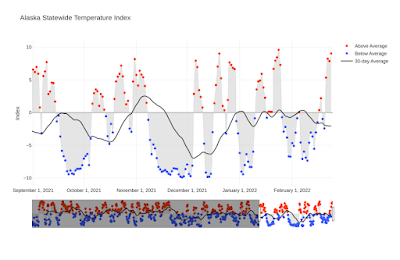
On a statewide basis, the handy index from UAF shows the episodic swings between colder and warmer, relative to normal, since autumn.  Overall, cold episodes have been more persistent and more unusual than the warm spells, although cold seems to be losing traction: the most recent cold period was less pronounced than earlier episodes (although not in northern Alaska).


Higher than normal variability of temperatures is a typical feature of La Niña winters - see this earlier post on this point:


Here's a sequence of model-estimated daily temperature anomalies over the past week or so.


Thursday, August 13, 2020

Reduced Temperature Variance

If residents of central Alaska have a sense that this summer has seen unusually steady temperatures, without extremes of either cold or heat, they are correct.  In fact, according to daily Fairbanks data, the standard deviation of daily mean temperatures since June 1st is the lowest on record.  Since at least 1930, there's never been a summer with less variability in daily temperatures through August 12.

The slight downward trend over the 90 years of data is not statistically significant, but the trend since 1990 actually is marginally significant at a 95% confidence level.

This summer's daily temperature variance is also the lowest on record - and by a larger margin - at McGrath, and it's the second lowest on record at Bettles.

Here are daily temperatures since May 1 in comparison to normal for the time of year in Fairbanks.  Lots of small deviations from normal.


What explanation might we propose for this summer's unusually steady conditions?  It would be interesting to look at seasonal climate drivers that tend to impart low variance, but for now the answer is rather simplistic: the general weather pattern has precluded the strong ridge/trough waves in the atmosphere that create larger swings in temperature from day to day and week to week.  In particular, it's the ridges that have been missing, as 500mb heights have been lower than normal over eastern and/or southern Alaska.  This seems to have been a relatively stable configuration, with few significant perturbations to bring much warmer air to Alaska's interior.

Here are 500mb anomaly maps from June, July, and August so far:


As for the downward trend in the past 30 years, it may well be the reduced frequency on the cold side of the climate distribution that explains the reduction in summer temperature variability.  In other words, as the Arctic has warmed far faster than the rest of the Northern Hemisphere in recent decades, air from the north will have warmed much more than air from the south.  It would be useful to look at this in more detail when time permits.

Update August 14:

It turns out there's no meaningful correlation between the mean and the variance of summer daily temperatures (after removing the long-term trend from the mean), so it seems we can't say that cool summer weather patterns (for Fairbanks) are inherently more stable.


Saturday, January 7, 2017

Colder Again

The development of a strong high pressure system (1055mb+) across northern and interior Alaska sent temperatures into a dive in Fairbanks after snow ended on Thursday, with a drop from +22°F to -28°F in 24 hours.   Today the temperature struggled to get above -20°F at the airport.  It seems as if temperatures have been on quite a roller-coaster so far this winter, as seen in the chart below, but in fact the variability is not at all unusual.  Since November 1, the standard deviation of daily temperature anomalies has been 12.6°F, compared to the 1981-2010 normal of 13.3°F for the same period on the calendar.  Perhaps the volatility seems unusual to me because last winter was one of the least variable winters on record as far as temperature in Fairbanks is concerned.


It's interesting to look at how the winter-time temperature variance depends on the phases of ENSO, the PDO, and the NPM.  El Niño winters (like last winter) tend to bring reduced temperature variability to much of Alaska because of the persistent flow patterns associated with low pressure to the southwest of Alaska.  La Niña winters tend to be more variable as high-pressure blocking episodes develop and then dissipate in the vicinity of the Bering Sea.

The chart below shows a box-and-whisker representation of Fairbanks November-March temperature variability for different phases of ENSO.  For reference, last winter's standard deviation of daily temperature anomalies was only 10.8°F, the second lowest on record.


A parallel analysis for the PDO phase shows a similar relationship but with a more notable enhancement of variance on the "cold" side, i.e. negative PDO.


Finally, the NPM chart shows a surprisingly strong relationship, given that the NPM has little relationship with mean winter temperature in Fairbanks; negative NPM winters tend to have lower temperature variance.  Of course the fact that the NPM is uncorrelated with mean temperature does not at all mean that the circulation patterns are similar; the negative NPM flow pattern is more El Niño-like in the vicinity of Alaska, whereas the flow more resembles a La Niña pattern when the NPM is positive.


Given that this winter has so far been characterized by a modestly positive PDO and a strongly negative NPM, we would expect the temperature variance to be lower than normal in Fairbanks.  However, as we discussed with respect to the heavy December snowfall, this winter is not quite conforming to expectations.

Thursday, February 25, 2016

More on Barrow Variance

As a follow-up to my recent post about Barrow's remarkable drop in temperature variance, I thought it would be useful to look at a map of variance changes to see how widespread the phenomenon has been.  Has the annual mean temperature become much more stable in recent years over most of the Arctic or even farther afield?  Or is it a localized change near Barrow?  Using the 2m temperature data from the NCEP/NCAR reanalysis, here's the answer (click to enlarge):


According to reanalysis data, Barrow's reduction in temperature variance is not representative of the Arctic region as a whole, as strongly contrasting changes have occurred from place to place.  However, neither is Barrow's change a hyper-local phenomenon; there is a zone of much diminished variance that extends east along the south coast of the Beaufort Sea.  Looking farther afield, there are regions of strongly decreased variance near Russia's New Siberian Islands and in the Greenland Sea, but variance has increased strongly over the Kara Sea (and the North Pacific!).  It seems likely that at least some of the changes in the Arctic are related to the pronounced sea ice extent changes of recent years.  It's not as simple as saying that variance has decreased because ice cover is reduced, but it is notable that much more of the Arctic has seen reduced variance than increased variance.

The "before" and "after" periods in this comparison look quite different - see below.  The zone of low variance from eastern Alaska through the Arctic to the North Atlantic is rather striking in the analysis for the past 15 years.


In the earlier post I mentioned that Barrow's decrease in annual temperature variance was consistent with reduced autocorrelation, i.e. reduced persistence of temperature anomalies.  The chart below illustrates this change; it shows the evolution of the 10-year running autocorrelation of monthly mean temperature anomalies, at a 1 month lag (blue) and 3 month lag (red).  Note that a correlation coefficient greater than +/- 0.18 is statistically significant at the 95% level for a 120-month sample.  Most of the time prior to the mid-2000s, the lag-1 autocorrelation was significantly positive, meaning that consecutive months tended to have the same sign of temperature anomaly.  But in recent years the autocorrelation has collapsed to about zero.  The lag-3 autocorrelation has also decreased, changing from marginally positive to slightly negative.


The chart below shows the results for lags of 6, 9, and 12 months.  The lag-6 autocorrelation has recently decreased to a statistically significant -0.18, so temperature anomalies are tending to cancel each other out at opposite ends of the year.  This is consistent with the overall decrease in annual variance, but the fundamental reason for the change is not yet clear.


To conclude for today, here is a chart of annual mean temperatures and running variance at Cold Bay, where the reanalysis suggests that variance has increased in recent years.  The observed temperatures from Cold Bay confirm that variance has increased, and in this case the cause is clear: the North Pacific temperatures have fluctuated widely as the PDO phase has undergone dramatic shifts from year to year.  The extraordinary warmth of the last 3 years in Cold Bay has been particularly unusual in light of the long-term history.