Showing posts with label ENSO. Show all posts

Wednesday, April 29, 2026

Arctic Sea Ice Update

Notwithstanding very abundant sea ice in the eastern Bering Sea this winter, Arctic-wide sea ice is now vying with 2019 for record-low extent at this time of year; it has been running near the bottom of the "pack" (pun intended) since November.  The following chart provides a comparison to 2019 (the previous record low at this date), 2012 (the year of the record low in September), and last year.


Deficits relative to the 1981-2010 normal are widespread across the marginal seas of the Arctic:


It's an interesting question as to whether the developing big El Niño episode will have a positive or negative effect on Arctic sea ice this summer.  Several of the strongest El Niño events of recent decades developed in parallel with substantial year-on-year declines in Arctic sea ice extent, so the risk of another major drawdown would seem to be elevated.  Here's a scatterplot of year-on-year change in September ice extent versus the June-August Niño3.4 SST anomaly; the notable recent years are 2023, 2015, 2002, and 1997 (lower right quadrant).


However, it's equally clear that there is actually not much correlation overall between year-on-year ice change and the phase of ENSO during summer.  In particular, pre-1997 El Niño events didn't have a consistent relationship with ice changes, and many stronger La Nina summers show modest ice declines rather than gains.

For a bigger picture, here's the correlation of June-August detrended SSTs with the year-on-year ice change:

The colors indicate the SST anomalies that would normally be associated with an increase of sea ice.  Clearly, the North Atlantic and North Pacific have more correlation than the tropical Pacific, but this doesn't imply causation; the SST patterns revealed here may simply reflect the impact of circulation patterns that affect sea ice extent.  Nevertheless, it's interesting to observe that a negative PDO pattern (like recent years) tends to favor higher sea ice extent, and that's confirmed in a scatterplot - although the correlation is not statistically significant:


The atmospheric anomalies themselves show a greater connection with sea ice change, of course; but those anomalies are relatively unpredictable at seasonal time scales.  A positive Arctic Oscillation, for example, slows the summer ice melt, whereas a negative AO phase tends to bring a reduction in ice extent.


ENSO does tend to be inversely correlated with the AO phase in summer, so it's more likely than not that we'll have a negative AO pattern this summer, i.e. more high pressure over the Arctic (and favoring warm and dry conditions in much of Alaska).  This points toward greater sea ice loss, as in other recent El Niño summers; but time will tell if this year fits the same pattern.

Friday, February 20, 2026

La Niña Ending Soon

La Niña has made its presence known in Alaska this winter, and winter certainly isn't over yet, but major changes are afoot in the tropical Pacific Ocean.  Here's the canonical Niño3.4 SST index, which is negative (cooler than normal) during La Niña and positive in El Niño.


A region of warmer than normal SSTs is expanding quickly westward from the coast of South America, leaving equatorial cool anomalies looking anemic in the central Pacific:


Compare with the situation just six weeks earlier:


The long-range computer models expect warming to continue through spring and into summer, resulting in El Niño by summer.  This month's forecasts are more aggressive than previously, and judging from the current trend, they may not be aggressive enough.


If El Niño does develop - as seems very likely - this will be a risk factor for increased wildfire activity in Alaska this summer.  However, the statistical connection hasn't always played out in recent years; 2023 was an analogous year with El Niño developing, but Alaska's fire acreage was very low (in contrast to Canada).

In the meantime, La Niña won't relinquish her influence on high-latitude patterns immediately, and the latest forecasts suggest a strong possibility of another La Niña-like persistent statewide cold spell starting the middle of next week.  The cold plunge next week seems to be locked in: here are two leading ensemble models for next Thursday morning.


Looking farther ahead, the details are less clear on the evolution into March, but there are strong hints of a persistent ridge near the Date Line and a trough over eastern Alaska and northwestern Canada - very similar to the persistent pattern in December.

Below is an example: compare the forecast portion (left side of the graphic below the dashed line) to this December 18 post.  The blue shading near the longitude of Alaska indicates the trough that will produce the cold northerly flow; this model shows the setup lingering into mid-March.  (Note that the previous post includes an explanation on interpreting these figures.)


Saturday, May 27, 2023

Follow-Up

Breakup is nearly complete now to the south of the Arctic Circle, but flooding problems continue on the Yukon River.  Heavy inflows from the Porcupine are keeping water levels very high downstream of Fort Yukon, and far to the southwest ice jam flooding has been a problem all week around Russian Mission and more generally in the Yukon delta region.  Flood warnings are now in effect all the way to the coast at Emmonak and Alakanuk.


Following up a bit more on the relationship between Alaska's fire season and the tropical Pacific, here's a map of June-July sea surface temperature patterns for the top 10 fire seasons since 1979 (all over 2 million acres).


This is interesting because it shows a "central Pacific El Niño" signal, and the eastern equatorial Pacific shows no unusual warmth at all.  A classic El Niño SST pattern would be focused in the eastern tropical Pacific: here's the average anomaly in the top 10 summer El Niño events since 1950.


So the Alaska fire equation is not as simple as El Niño = active fire season.  But we already know that, because prior to 1995 there were plenty of El Niño events without notably enhanced Alaskan wildfire.  Here's the average anomaly in those years (June-July El Niño between 1979 and 1995):


The obvious difference here is that both the northwestern and northeastern Pacific were cooler in those years; and of course some of the pre-1995 El Niño events were quite weak.

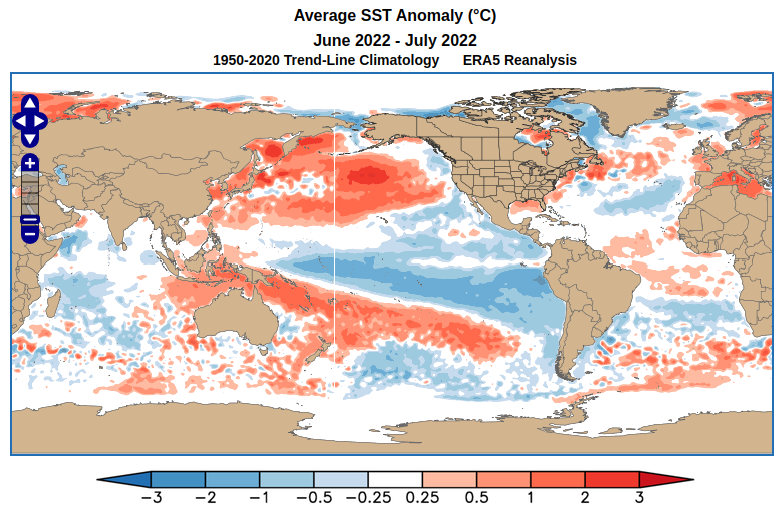
Now what about last year?  La Niña was entrenched in 2022, with plenty of cool water in both the central and eastern equatorial Pacific, but the North Pacific had much more widespread and unusual warmth than is typical for a strong La Niña.  The second map below shows the average SST anomaly for the top 10 summer La Niña events since 1950.


So if I had to guess, last year's active fire season had a lot to do with the warm North Pacific, especially in the western Bering Sea and south of the Aleutians.  A warm North Pacific is clearly associated with higher fire activity, as in the first SST map above.

As for this year, while we do have El Niño emerging, it's very much focused in the eastern Pacific, with no unusual warmth yet in the central tropical Pacific.  There's also much less warmth in the western Bering Sea than last year; so it seems the pattern is not particularly well aligned with a typical active fire season pattern.  However, SST anomalies can change quickly in summer.  It will be fascinating to see how this season plays out.


Monday, February 20, 2023

Follow-Up on La Niña

It's worth following up on a couple of points from last week's post.

First, to extend the comments on what happened in January, the Arctic as a whole did not see the widespread and unusual warmth that affected Alaska, although conditions were highly variable across the basin:

The European side was even warmer than the Alaskan sector, but much of inland Arctic Siberia was colder than normal.  I say "inland" because the most northerly Russian sites around 90°E were much warmer relative to normal, illustrating the moderating influence of the ocean despite its ice cover.

The relationship between ENSO and winter temperatures is not as simple for the Arctic as a whole as it is for Alaska, because there are strong regional differences across the Arctic.  The Arctic-wide temperature trend since 1980 is similar for both El Niño and La Niña, judging from the 32 sites I've been using for realtime monitoring:


Notice that of the three extremely warm winters of 2015-16 through 2017-18, one was an El Niño winter, one a La Niña, and the other one was neutral.  

The neutral-ENSO trend is slightly less than the El Niño and La Niña trends, which is similar to the result I showed last time for Alaska.  But let's discuss that result a bit more.  It turns out that the neutral-ENSO temperature trend is very sensitive to the ENSO classification method, i.e. which index we use to determine whether a winter is El Niño, La Niña, or neutral.  Last week I used the Multivariate ENSO Index, which is a comprehensive measure of ENSO's expression in several different variables.  This was the result for Fairbanks:


In contrast, here's the analysis using the Southern Oscillation Index to define the occurrence of El Niño and La Niña.  The SOI is a simple but venerable index based solely on pressure differences between Darwin (Australia) and Tahiti.


What a difference this makes to the neutral-ENSO trend!  It now shows no significant discrepancy from the El Niño and La Niña trends, and all three are similar.  The trends are also quite similar if we use data back to 1930 (the SOI is available back into the 19th century):


How could the ENSO classification method make such a large difference?  Part of the answer is that these linear trend estimates are inherently uncertain (as I noted last time) because of the small sample size in each category, and the large year-to-year variance.  And in particular, the classification of neutral-ENSO years is subject to considerable uncertainty, because the phase estimate can differ in either direction.  In contrast, the stronger El Niño and La Niña episodes are unambiguously classified with more confidence.
As an example, it seems that three very warm winters in the first half of the MEI series were classified as neutral ENSO winters according to the MEI, and all three had a significantly positive PDO phase: 1969-70, 1976-77, and 1980-81.  The warmth in these earlier years contributes to the lack of warming trend in the ENSO neutral category:

But according to the SOI, all three winters were marginally El Niño winters, and so they are excluded from the neutral-ENSO trend calculation.


Similar differences are found for the statewide Alaska temperatures, and remarkably the situation is now reversed with the neutral-ENSO trend, which is now the steepest of the three:

Another interesting point here is how much more shallow the long-term trend is when including the data prior to 1950.  Starting the trend in 1950, as I did for the MEI classification, produces very steep trends because of the cold (negative PDO) era of the 1950s and 1960s.

In conclusion, there's obviously very large uncertainty around the neutral-ENSO trend, but the SOI classification supports the consistency in Alaska's warming trend for both La Niña and El Niño winters.


Saturday, June 4, 2022

Wildfire Outlook

First a quick note on meltout at higher elevations around Fairbanks: the Munson Ridge SNOTEL site (3100' elevation) is still reporting 4.9" of water content in the snowpack early today (and a snow depth of 18" yesterday).  With relatively warm weather, nearly 12" of snow water equivalent has melted out in the past 10 days, and the snowpack is no longer a record for the date: in 2000, there was still 7.8" of water on the ground on June 4.  Since 1981, there have been 4 other years with snow remaining at this date: 1982, 1985, 1992, and 2000.

Down at Denali NP headquarters, the reported snow depth dropped to zero on Monday, which makes this the latest meltout on record for the venerable climate observing site:


But onto another topic: the National Interagency Fire Center issued their wildland fire potential outlook on Wednesday.  Large areas of the lower 48 are facing above-normal wildfire risk, but there is no departure from normal in the forecast for Alaska.  For example:


The discussion does acknowledge unusual dryness in southwestern Alaska, and indeed this week's Drought Monitor has "moderate drought" in south-central (see below), but the ongoing La Niña episode is recognized as a negative factor for wildfire activity.


I've commented before on the strong relationship between Alaska wildfire acreage and ENSO (El Niño vs La Niña), but it's worth looking at this again with a few more years added to the analysis.  The scatterplot of fire acreage versus June-July ENSO phase is quite remarkable:


I don't have fire data prior to 1990, but in the last 32 years, the top 9 fire years all had a positive ENSO phase (but marginally so in 1990), and the highest acreage with a negative ENSO phase was 1.3 million acres in 2013 (a hot summer, but dry with little lightning).

For reference, the April 2022 ENSO index was -1.6.  The current La Niña episode is one of the strongest on record for the time of year, and it's very likely to persist through summer:


As for why La Niña tends to prevent excessive fire acreage in Alaska, it's clearly related to La Niña's influence on the prevailing weather pattern: it is often relatively cool, damp, and cloudy, especially in western Alaska.  Here's a frequency analysis of the June-July weather anomalies in the 11 years since 1990 that saw La Niña conditions:


There tends to be an upper-level trough from western Alaska to British Columbia, and this is aligned with the negative PDO phase that tends to prevail in conjunction with La Niña (and indeed the PDO is quite strongly negative at present):


One other aspect: wind speeds tend to be lower than normal across the entire interior, which may help reduce fire growth.


In summary, the ongoing La Niña regime strongly favors a relatively inactive wildfire season this year in Alaska.  However, I'd caution that it's not a certainty: one of these years there will be an exception to the rule, and even "relatively inactive" could still be problematic: there were 3 La Niña years with 1+ million acres burned.  And of course, if the current warm and dry weather persists, there will definitely be problems.


Saturday, February 26, 2022

Rapid Changes

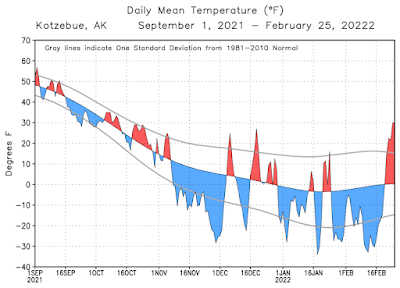
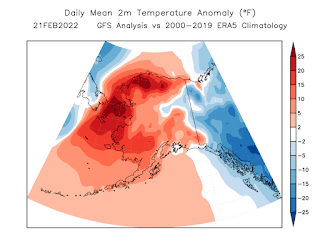
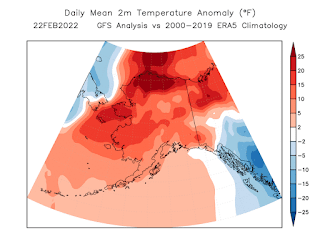
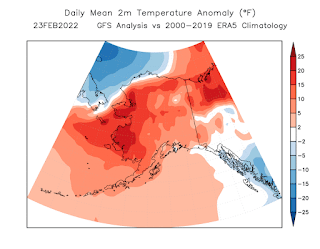
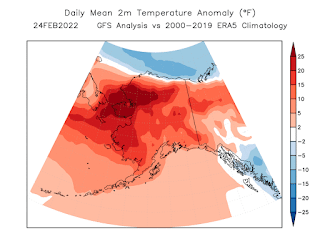
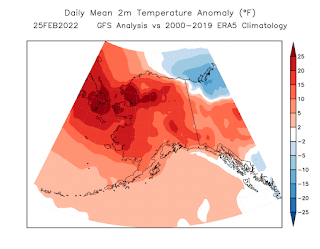
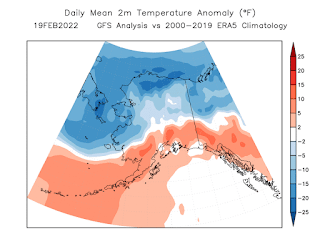
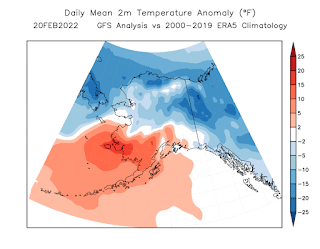
Alaska's roller coaster of temperature swings this winter has produced another dizzying change in recent days, with widespread warmth enveloping much of the state since Monday.  The warm-up was very dramatic in western Alaska and brought a sudden end to persistent cold in the northwest.  In particular, Kotzebue had been stuck in a cold pattern since late January; minimum temperatures were in the -30s F for a week recently, but the past two days have seen above-freezing temperatures.


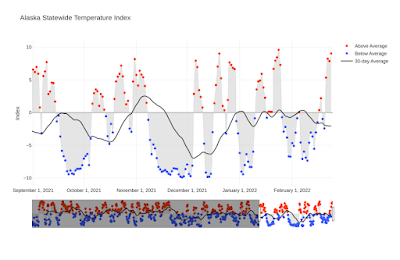
On a statewide basis, the handy index from UAF shows the episodic swings between colder and warmer, relative to normal, since autumn.  Overall, cold episodes have been more persistent and more unusual than the warm spells, although cold seems to be losing traction: the most recent cold period was less pronounced than earlier episodes (although not in northern Alaska).


Higher than normal variability of temperatures is a typical feature of La Niña winters - see this earlier post on this point:


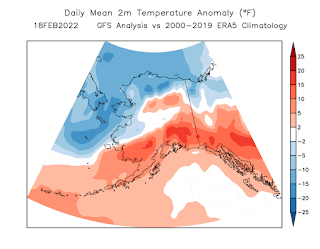
Here's a sequence of model-estimated daily temperature anomalies over the past week or so.