Saturday, October 4, 2014

September Anomalies

The September 2014 temperature and precipitation anomalies for a number of Alaska observing locations are shown in the maps below.  As in previous similar posts, the area of the colored circles indicates (for temperature) the anomaly in terms of standard deviations or (for precipitation) the percentile rank relative to the 1981-2010 period.


All southern and western locations were warm relative to normal, which is no surprise given the unusual warmth in the waters of the Bering Sea and Gulf of Alaska.  St Paul Island recorded by far its warmest September on record (1949-present), and remarkably the month was warmer than the average August in that location - and August is the warmest month of the year on average.  August 2014 was also the warmest August on record on St Paul Island.  Cold Bay also saw its record-breaking warmth continue, with the warmest September on record (1950-present).

September was much wetter than normal in Fairbanks, but only because of the deluge at the beginning of the month; surprisingly Big Delta, McGrath and Bettles were all drier than normal.

As far as I know, the lowest temperature observed in the state in September was 6 °F at the new Ivotuk CRN site, observed on both the 5th and 26th.  The Chicken COOP reported 8 °F on the 25th, 26th, and 27th.  One might think that it is unusual for no sub-zero temperatures to be reported anywhere in the state in September, but in fact the normal statewide minimum September temperature is above zero.  The chart below shows the statewide temperature extremes in September between 1950 and 2013.


Finally, here's the Fairbanks September weather summary from the NWS.

PUBLIC INFORMATION STATEMENT
NATIONAL WEATHER SERVICE FAIRBANKS AK
708 PM AKDT WED OCT 1 2014

...MONTHLY WEATHER SUMMARY FOR SEPTEMBER FOR FAIRBANKS ALASKA...

SEPTEMBER 2014 STARTED OFF WET AND COOL FOR THE FIRST WEEK AND
THEN TRANSITIONED TO WARM AND DRY CONDITIONS FOR THE SECOND AND
THIRD WEEKS. THE LAST WEEK OF THE MONTH TURNED COOL WITH RAIN AND
SNOW SHOWERS.

THE AVERAGE HIGH TEMPERATURE AT THE FAIRBANKS AIRPORT WAS 57.2
DEGREES WHICH WAS 2.6 DEGREES ABOVE THE NORMAL HIGH TEMPERATURE OF
54.4 DEGREES. THE AVERAGE LOW TEMPERATURE WAS 35.5 DEGREES WHICH
WAS 0.4 DEGREES ABOVE THE NORMAL LOW TEMPERATURE OF 35.1 DEGREES.
THE AVERAGE TEMPERATURE FOR SEPTEMBER 2014 WAS 46.4 DEGREES WHICH
WAS 1.5 DEGREES ABOVE THE NORMAL AVERAGE TEMPERATURE FOR SEPTEMBER
OF 44.9 DEGREES. THE AVERAGE TEMPERATURE FOR SEPTEMBER 2014 RANKED
AS THE 35TH WARMEST OF 109 YEARS OF RECORD.

THE WARMEST TEMPERATURE RECORDED AT THE FAIRBANKS AIRPORT IN
SEPTEMBER 2014 WAS 76 DEGREES ON THE 14TH OF SEPTEMBER. NOT ONLY
WAS THIS A DAILY RECORD HIGH TEMPERATURE BUT THERE HAS ONLY BEEN
ONE OTHER DAY IN THE CLIMATE RECORD IN FAIRBANKS THAT THE
TEMPERATURE HAS BEEN WARMER THAN 76 DEGREES ON A DATE LATER THAN
THE 14TH OF SEPTEMBER. IN 1995 THE TEMPERATURE REACHED 78 DEGREES
ON THE 21ST DURING A RECORD BREAKING CHINOOK EVENT.

THE COLDEST TEMPERATURE RECORDED AT THE FAIRBANKS AIRPORT IN
SEPTEMBER 2014 WAS 24 DEGREES WHICH OCCURRED ON THE 28TH. THE
FIRST SNOW OF THE SEASON FELL ON THE 23RD WHICH IS A COUPLE DAYS
LATER THAN THE AVERAGE FIRST SNOW FALL IN FAIRBANKS.

2.89 INCHES OF PRECIP FELL DURING THE MONTH OF SEPTEMBER AND WAS
1.79 INCHES ABOVE THE NORMAL PRECIP OF 1.10 INCHES. SEPTEMBER WAS
THE 4TH CONSECUTIVE MONTH WITH ABOVE NORMAL PRECIPITATION AND
RANKED AS THE 4TH WETTEST SEPTEMBER OF 101 YEARS OF RECORD.
1.43 INCHES OF RAIN FELL ON THE 1ST WHICH WAS A NEW DAILY RAIN
FALL RECORD FOR THAT DAY. 0.3 INCHES OF SNOW FELL AT THE AIRPORT
DURING THE MONTH OF SEPTEMBER WHICH WAS 1.5 INCHES BELOW THE
NORMAL SNOWFALL OF 1.8 INCHES. THIS RANKS AS THE 37TH SNOWIEST OF
101 YEARS OF RECORD.

LOOKING FORWARD TO OCTOBER...THE PERMANENT SNOW PACK IS ALMOST
ALWAYS ESTABLISHED SOMETIME DURING THE MONTH OF OCTOBER. AS A
RESULT OF THE ESTABLISHED SNOW PACK AND RAPIDLY DIMINISHING
POSSIBLE SUNSHINE THE AVERAGE DAILY TEMPERATURE FALLS 20 DEGREES
DURING THE MONTH. THE AVERAGE HIGH TEMPERATURE FALLS FROM ON 37
DEGREES ON THE 1ST TO 17 DEGREES ON THE 31ST. OVER THE LAST 109
YEARS TEMPERATURES HAVE RANGED FROM 72 IN 2003 TO 28 BELOW IN
1935. TOTAL PRECIPITATIONS AVERAGES 0.83 INCHES. MUCH OF THIS
TYPICALLY FALLS AS SNOW...AND SIGNIFICANT RAINFALL IS RARE AFTER
MID-MONTH. NORMAL SNOWFALL IS ABOUT 11 INCHES. THE LAST TIME
FAIRBANKS DID NOT HAVE A WHITE HALLOWEEN WAS 1962...HOWEVER IN
2013...SNOW DEPTH AT THE AIRPORT REMAINED ZERO UNTIL 0.6 INCHES OF
SNOW FELL ON THE EVENING OF THE 31ST. POSSIBLE SUNSHINE CONTINUES
TO DECREASE BY OVER 6 MINUTES PER DAY...FALLING FROM 11 HOURS AND
17 MINUTES ON THE 1ST TO 7 HOURS AND 56 MINUTES ON THE 31ST.

THE FORECAST FOR OCTOBER FROM THE CLIMATE PREDICTION CENTER CALLS
FOR EQUAL CHANCES FOR ABOVE NORMAL...NEAR NORMAL OR ABOVE NORMAL
TEMPERATURES AND EQUAL CHANCES FOR ABOVE NORMAL...NEAR NORMAL OR
ABOVE NORMAL PRECIPITATION.

OBSERVED LAST MONTH...09/2014

                         OBSERVED   RANK
AVG MAX TEMP (F)             57.2   31ST WARMEST OF 109 YEARS
AVG MIN TEMP (F)             35.5   45TH WARMEST OF 109 YEARS
AVG TEMP (F)                 46.4   35TH WARMEST OF 109 YEARS
TOTAL PRECIP (IN)            2.89   4TH WETTEST OF 101 YEARS
TOTAL SNOW (IN)              0.30   37TH SNOWIEST OF 101 YEARS

CCC

Friday, October 3, 2014

October Snow Climatology

With the forecast calling for a couple of inches of snow in Fairbanks, it is a good time to remind people that October is actually the snowiest month of the year for much of the Interior. In fact, there are 11 stations in the entire U.S. whose snowiest month of the year is October – all are in Interior Alaska. This is based on 4,218 stations that the NCDC calculates normal monthly snowfall and that receive at least 2" annually. The eleven stations are shown on the map with a green star and are in the list below.

Figure 1 shows all stations in Alaska that have a published normal snow amount from NCDC. Stations with a peak in October are shown as green stars. Figure 2 showsthe monthly normal precipitation for five stations in Interior and Northern Alaska that all experience more snow in October than any other month.

The reason for the early snow onset is due to the extreme cold during November through February. Colder air cannot hold nearly as much moisture and consequently the snow events generally produce small amounts during those months. For example, air that is 32°F can hold 4 times as much moisture as air that is 0°F and 11 times as much as air that is -20°F.

Here are the eleven stations whose snowiest month is October:

Barrow Post Rogers AP
Chandalar Lake
Colville Village
Delta Junction 20SE
Dry Creek
Keystone Ridge
Kuparuk
Prudhoe Bay
Salcha
Slana
Whitestone Farms


Figure 1. Snowiest month of the year based on NCDC normals.


Figure 2. Monthly snow totals (NCDC normals) for five stations that have a peak snowfall in October.

Thursday, October 2, 2014

Fairbanks Temperature Trends - Part 2

Last week's post on temperature trends at Fairbanks airport showed that long-term warming (1950-2013) has been most pronounced in winter and that surface temperatures have warmed slightly more than 850 mb temperatures in all seasons.  As reader Mike pointed out, there is naturally some uncertainty as to how much these results are affected by the long-term growth in urban population in Fairbanks, i.e. the development of an urban heat island.  While I won't pretend to begin to address this thoroughly, it's interesting to compare long-term trends from nearby stations in much smaller population centers to see if the results are similar.

There are five stations in the NOAA GHCN database that are both relatively close to Fairbanks and have more than 95% complete temperature data since 1950.  Two of these are in Fairbanks (University Experiment Station and College Observatory) and the other three are Big Delta airport, McKinley Park, and Tanana airport.  The following charts compare the seasonal long-term trends at each of these locations with the 850 mb temperature trends from Fairbanks airport; the charts are shown in order of decreasing data completeness.


For comparison, here's the chart for Fairbanks airport with the same vertical scale:


The results from the nearby stations confirm that winter has seen by far the most warming over the long haul in the interior near Fairbanks (and autumn has seen the least).  All five stations also show that winter surface warming has exceeded the 850 mb warming at Fairbanks, so the greater warming at the surface (and slight weakening of the winter inversion strength) appears to be a regional trend.

It's also interesting to note that the surface winter warming trend is greater at both Big Delta and Tanana than at Fairbanks airport, so this does not support the idea that Fairbanks has warmed more than other nearby locations.  A possible conclusion - but one that would merit more investigation - would be that urban warming in Fairbanks is not affecting mean temperatures much differently than in earlier decades.  However, we should not forget that changes in instrumentation or observing site at any or all or these locations may have affected the calculated trends, and so more investigation of the station histories would be required before making more confident statements about differences (or lack of them) in long-term trends.

Tuesday, September 30, 2014

Elevation-Dependent Snow

Fairbanks airport reported light snow for more than 12 hours this morning, but with temperatures no lower than 34 °F there was little or no accumulation on the valley bottom.  However, on UAF West Ridge, at over 600 feet elevation, the temperature was close to 32 °F and there was accumulation for a while before diurnal warming led to melting.  Up on Keystone Ridge (1600'), the accumulation was 3.5" by mid-afternoon.  See below for photos: the first courtesy of the Alaska Climate Research Center webcam this morning, and the second from Keystone Ridge at about noon AKDT.


In the 18-year history of observations on Keystone Ridge, measurable snow has been on the ground on September 30 on 9 occasions; and this snow remained throughout the winter in 6 of 9 cases.  So we might estimate approximately a two-thirds chance that today's snowfall represents the establishment of the permanent winter snowpack in the hills around Fairbanks; although with a healthy 3.5 inches reported, and below-normal temperatures expected by Friday, it seems the odds may be higher than that.

Monday, September 29, 2014

Forecast Showing Cold Spell

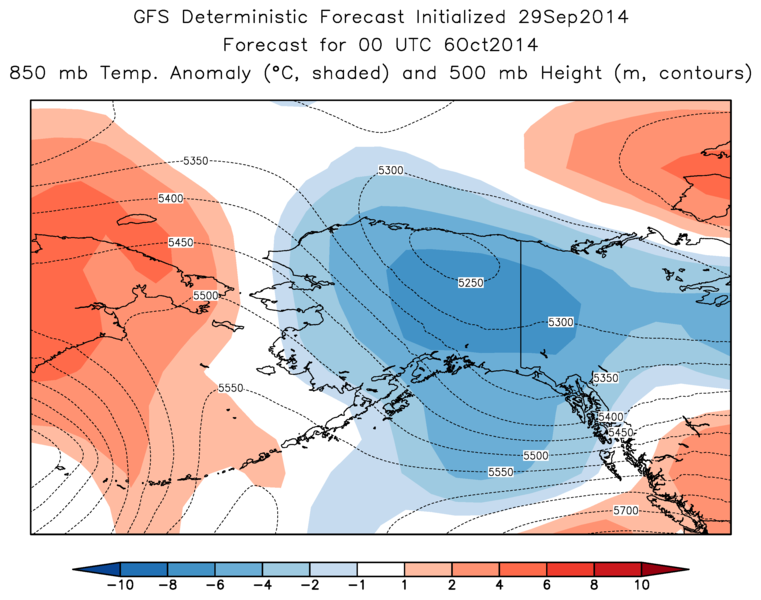
The medium-range forecast for interior Alaska has taken on a cold look in the past few days and is now showing a cold upper-level trough being carved out over the state by the weekend.  If this verifies, it would bring daytime high temperatures near or below freezing in Fairbanks and of course a good chance of accumulating valley-level snow.  According to the long-term average, the establishment of the permanent winter snowcover is still more than two weeks away, but it can happen in early October - for example, the 2000-2001 winter snowpack arrived on October 5.

The maps below show the ECMWF and GFS model forecasts of 850 mb temperature anomaly (shaded) for Friday afternoon, along with the 500 mb height (dashed lines); the models agree in showing temperatures more than 6 °C below normal over parts of the interior.  Of course, this is still 5 days out, so the details will undoubtedly change.


Friday, September 26, 2014

Fairbanks Temperature Trends

Regular reader Mike asked if we could take a look at the long-term trends in 850 mb and surface-level temperatures over the interior, with a particular focus on whether surface temperatures are warming more rapidly than temperatures aloft.  For an initial look at this, I pulled out the data for Fairbanks airport since 1950, because a direct comparison between the two levels is possible at this location.  The charts below show the 64-year history of mean temperature anomalies for each of the conventional meteorological seasons.  The red and blue lines at the top of each chart show the 850 mb (blue) and surface (red) temperature anomaly relative to the 1981-2010 normal, and the green columns show the difference between the two (surface minus 850 mb anomaly).  If the surface has warmed more than the 850 mb level, then we would see a general upward trend in the green columns.


The long-term trends are summarized in the following chart, which demonstrates that winter has seen by far the most significant warming over the long haul, and autumn has seen almost none.  It's also clear that the surface has indeed warmed slightly more than the 850 mb level, but the difference is quite small.


There are a number of interesting aspects of the data that seem to be worth commenting on.  First, the great Pacific climate shift of 1976, i.e. the switch to a positive PDO phase, stands out very clearly in the winter temperature chart.  There has been no long-term winter warming since 1976, but then the PDO phase has been more often negative in recent years, so we might expect this.  In fact, if the PDO was all there was to it, then temperatures would have dropped more in recent years.

Second, the 1976 PDO shift also appears to be evident in the spring temperature anomalies, but much less so in the summer and autumn.

Third, it's interesting that autumn does not show more warming because of the loss of Arctic sea ice; we recently discussed the remarkable warming in October over much of Alaska, but Brian showed that Novembers have been cold lately; so the October and November changes have opposing contributions to the overall autumn anomaly in Fairbanks.

Fourth, there is a suggestion that the surface-850mb differences peaked in the 1970s and 1980s, and were more negative both early and late in the history - especially for spring and summer.  The Atlantic Multidecadal Oscillation (AMO) was negative in the 70s and 80s, and positive on either side, so I wonder if there is a causal relation.

Finally, I couldn't help but notice that the autumn temperature anomalies seem to show a rather regular zig-zag pattern from year to year at times, i.e. the inter-annual variations look less random than in the other seasons.  More analysis would be required to assess whether this is unlikely to be just a coincidence.

Wednesday, September 24, 2014

Fall Temperature Drop Off

As Richard noted yesterday, temperatures are dropping in the Interior. This should not come as a surprise to anyone who lives in most of Alaska. As the sub-solar point drops south of the equator (Autumnal Equinox) there is less and less solar energy to prop up the temperatures. October is traditionally known as the time of greatest temperature decline but that is not the case everywhere.

Let us begin with the amount of temperature change. I looked at the 1981-2010 NCDC normals for all stations in Alaska and identified the maximum decline for the daily normal temperature during any 31-day period. The results of that analysis are shown in Figure 1. Approximately 25% of Alaska observes a 31-day temperate drop in the fall/winter of 23°F or greater and half of the state sees a drop of at least 20°F. The statewide "winner" is actually the Woodsmoke Cooperative station near Fairbanks with a seasonal drop of 27.9°F. Central is next with 27.2°F followed by Chicken with 26.6°F. The smallest 31-day change in the Fairbanks area is Keystone Ridge with a value of 19.3°F. At the other end of the spectrum is Adak in the far western Aleutian Islands. Their seasonal temperature drop (31-days) is only 6.0°F. Dutch Harbor, Shemya, St. George, and St. Paul are all at, or under, 7.0°F.

Figure 1. Largest 31-day decline in normal temperatures throughout the year based on NCDC normals.

Anecdotal, we think of October 1st as the beginning of this seasonal drop off but that is not necessarily the case. Figure 2 shows the first day of the greatest 31-day temperature decline for all of Alaska based on stations with NCDC published normal temperatures for 1981-2010. As it turns out, the October 1st line runs right through the Fairbanks area. However, nearly half of Alaska does not get going on their fall temperature swoon until the first week of October. In southwestern Alaska, it begins in the middle to later portions of September.


Figure 2. Starting date of the largest 31-day decline in normal temperatures throughout the year depicted in Figure 1.

Tuesday, September 23, 2014

Cooling Off

It won't have escaped anyone's notice that temperatures are dropping fast across interior and northern Alaska (especially after the mixed rain and snow in Fairbanks today).  Bettles recorded their first freezing degree days of the winter yesterday (daily mean temperature below freezing), which is just about on schedule for the time of year.  However, the low temperature was 14 °F, and it's still a little early for that kind of chill.  Up at Barrow, yesterday was the first day that the temperature failed to rise above freezing; this is later than normal, as we would expect with the reduced ice cover.

The chart below shows the recent daily high and low temperatures from Fairbanks airport, Keystone Ridge, and the secondary airport site (FAUA2).  It's interesting to note that Keystone Ridge has seen the temperature drop below freezing on six nights so far this autumn, but the primary airport site has only had two frosts so far.  Looking at the joint history of observations since 1996, I expected to see that this is unusual, thinking that overnight inversions would typically produce more frost in the valley than on the hill in September.  However, the overall frequency of frost is just about equal in September at the two locations; some years favor more early frost events in the valley, and others, like this year, favor more frost on the hill.  It's not until October and the advent of snow cover that daily low temperatures become significantly lower in the valley (see climatological chart here).


The chart also shows the much cooler temperatures reported from the airport #2 location, where the temperature has dropped below freezing 14 times already this autumn.  We discussed this thermometer's characteristics at some length here, although without arriving at a clear resolution as to whether the #2 temperatures are truly legitimate.  However, Brian showed that the 2000-2013 temperature differences between the two airport sites were largest in the month of September, and so the recent differences are consistent with this fact.

Monday, September 22, 2014

Fairbanks First Snow Stats

The forecast for Fairbanks on Tuesday includes a mention of snow for higher elevations. Here is the text-based forecast issued at 4:00 p.m. AKDT for Zone 222:

TUESDAY...MOSTLY CLOUDY. RAIN LIKELY...MIXED WITH SNOW ABOVE
1500 FEET. UP TO 1 INCH OF SNOW ACCUMULATION. HIGHS IN THE MID
40S. LIGHT WINDS.

TUESDAY NIGHT...MOSTLY CLOUDY WITH RAIN AND SNOW LIKELY IN THE
EVENING...THEN DECREASING CLOUDS AFTER MIDNIGHT. NO SNOW
ACCUMULATION. LOWS IN THE 20S. WEST WINDS TO 10 MPH.

There are several places around Fairbanks that are greater than 1,500' above sea level. The only one with at least 15 years of snowfall data is Keystone Ridge. If they receive the forecasted 1" of snow, it would be 2 days earlier than the median date of September 25th. All other stations have a median first snow date between September 30th and October 4th. As the map in Figure 1 indicates, the first snow has been as late as the end of October or even early November!

Figure 1. Dates of first snowfalls for stations around Fairbanks with at least 15 years of complete snowfall data since 1950.

Figure 2. Photo from the Alaska NWS Facebook page showing light snow on the UAF Campus. Image Source:    https://www.facebook.com/NWSAlaska/photos/a.146147645438637.42652.137686999618035/739650926088303/?type=1&permPage=1


Friday, September 19, 2014

Arctic Ice Minimum

Arctic sea ice extent appears to have reached its seasonal minimum in the past day or two.  The National Snow and Ice Data Center has not yet "called" the minimum but indicated a few days ago that the minimum extent would be slightly lower than last year.  However, the Danish Meteorological Institute graphic suggests that the ice extent is very slightly higher than last year (see below).  Regardless, this year's ice extent has followed a similar path to 2013 throughout the melt season.


It's worth noting that the CFSv2 computer model forecast of significantly increased ice extent this year was flat-out wrong.  We discussed the forecast here and here.  Given the magnitude of the anomaly in the forecast, this is quite a bust.

Here are some other figures to document this year's ice cover at seasonal minimum, courtesy of the University of Illinois and NSIDC.


Thursday, September 18, 2014

September Precipitation Days

After the tremendous deluge on September 1st and 2nd, no measurable precipitation has been observed at the Fairbanks International Airport. Is this unusual? Since 1915, the average amount of precipitation between September 3rd and September 17th is 0.49". This is only the 4th year (out of 99) with no precipitation during those dates. The other years were 1963, 1974, and 2006. Also, there are normally 4.3 days with measurable precipitation during these 15 days; but of course none this year.

For the entire month of September, the long-term average number of days with measurable precipitation at the Fairbanks International Airport is 9.8. When days with Trace values are included, the number jumps up to 16.0 days. The 9.8 days with measurable precipitation is actually on the low end of other readings around Fairbanks. Figures 1 shows the normal (average) number of days with measurable precipitation in the Fairbanks area for all stations with at least 10 complete years of precipitation data since 1950. Figure 2 shows all days with at least a Trace of precipitation.

Figure 1. Long-term average number of days with measurable precipitation in the greater Fairbanks area for all stations with at least 10 complete years of summer precipitation data since 1950.

Figure 2. Long-term average number of days with any precipitation (Trace or measurable) in the greater Fairbanks area for all stations with at least 10 complete years of summer precipitation data since 1950.

Readers of this blog probably know that September is past the peak of the wet season for Fairbanks. July is typically the month that observes the most rainfall and the most days with measurable precipitation. Figure 3 show which portions of Alaska are wettest during which month. Most areas south of the Alaska Range are wettest in September through December.


Figure 3. The wettest month of the year across Alaska based on NCDC normals.

At the statewide level, we see that a significant gradient exists with regard to the number of days with measurable precipitation during the month of September from northeast to southwest (see Figure 4). Approximately 1/3 of days see measurable precipitation northeast of a line from Glenallen to Wainwright. Southwest of that line, significantly more days with measurable precipitation are observed.

Figure 4. Long-term average number of days with measurable precipitation in the state of Alaska area for all stations with at least 10 complete years of summer precipitation data since 1950.

What is really interesting is to see the number of days with any precipitation (Trace values included) at the statewide level (see Figure 5). Note the very large number of Trace+ days along the North Slope and the west coast. The portion of the state that sees half or fewer days with a Trace or more of precipitation is now much smaller – with a minimum around Tok.

Figure 5. Long-term average number of days with any precipitation (Trace or measurable) in the state of Alaska for all stations with at least 10 complete years of summer precipitation data since 1950.


Wednesday, September 17, 2014

El Nino and Positive PDO in Winter

Back at the end of July, reader Tracy asked if I could look at the relationship between Alaska winter climate patterns and El Niño or the PDO phase.  I've been very remiss in not getting to this earlier, but now with the change of seasons the topic is more immediately relevant.  Earlier in the year I posted some maps illustrating the El Niño connection to summer and spring conditions, so we can do the same thing for winter.  For the purposes of this post, I've defined winter as November through February: the season that is both cold and dark.

First, the maps below show the distribution of temperature and precipitation anomalies in the top 10 El Niño winters from the period 1951-2013.  The colored columns represent the fraction of years falling in the three climatological terciles, i.e. below-normal, near-normal, and above-normal.  We see that strong El Niño winters most often bring unusual warmth to southeastern and south-central Alaska, but temperatures are most often close to normal overall in the interior and west.  Below-normal precipitation is a common occurrence from Barrow and Bettles down to Cold Bay in these winters.


What if El Niño conditions are combined with a positive PDO phase?  This is the situation that we are currently looking at, and it seems fairly likely to persist into winter, as a weak El Niño episode finally seems to be taking hold in the tropical Pacific, and the PDO phase is moderately positive.  As the maps below indicate, a warm winter becomes more likely in most of Alaska - except for the west and at Barrow - when the PDO phase "lines up" with El Niño.  Also, the precipitation signal is more mixed and shows no clear large-scale signal when the PDO is decidedly positive along with El Niño.


If the PDO were not positive, then the odds would favor near-normal temperatures in many locations (see below) - and the Niño-related warmth in the southeast would be gone.  Recall that we saw the same thing with the earlier maps for spring and summer: El Niño years look vastly different in Alaska depending on the PDO phase.


To confirm the strong connection with the PDO by itself, the maps for the top 10 positive PDO winters show an overwhelming signal for warmth in the interior, south-central, and southeast.


Finally, below are the mean anomaly maps for winter sea-level pressure and 850 mb temperature in the top El Niño winters and top positive PDO winters.  These maps suggest, interestingly, that the patterns are really quite similar between El Niño and the positive PDO, but the surface warmth is much more dominant in the case of the positive PDO.  Cloud cover differences may be an important part of this, but that will have to be a topic for another day.

MSLP, El Niño:
MSLP, Positive PDO:

850 mb Temperature, El Niño:

850 mb Temperature, Positive PDO:

Sunday, September 14, 2014

Summer in September

It doesn't get any better than this in mid-September in Fairbanks: mid-70s F, abundant sunshine, and light winds.  Fairbanks International Airport is reporting 76 °F, which is higher than the normal high temperature at the climatological peak in early July.  It's also just two degrees shy of the warmest ever observed so late in the season.

The scene at the Golden Heart Plaza is simply glorious:


Chinook and Record Warmth

Southerly flow ahead of the Bering Sea storm has brought an intense chinook and very warm conditions to interior Alaska in the past two days, and if you thought records were being broken, you were correct.

At Delta Junction, yesterday's midnight-to-midnight low temperature was in the 60s °F, probably 63 or 64 °F (the official value is not reported yet), and this is a record for September - the previous record highest low temperature for the month was 60 °F in the great chinook of late September 1995.  The latest in the year that a low temperature as high as 63 °F has been reported before was August 28, 1989 (with mostly complete data back to 1943).

The lack of nighttime cooling in the Delta Junction area was of course associated with high winds, which were sustained near 30 knots and gusting over 40 knots for many hours yesterday.  The National Weather Service reported many high wind observations, including a gust of 76 mph from a station 11 miles SSW of Fort Greely.  Blowing dust was reported yesterday and Friday on the METAR observations from PABI; this is confirmed by some FAA webcam photos that I saved yesterday afternoon:


At Fairbanks the high temperature of 74 °F yesterday tied the record for the date, but the warmth was not as extreme as in the 1995 chinook, which took temperatures to 78 °F in Fairbanks on September 21.

Yesterday's low temperature in Kotzebue was 52 °F, which ties the record from 1933 for warmest low temperature ever observed so late in the season.  The high temperature of 65 °F on Friday set a new record for the date, but in terms of absolute anomaly this event again falls short of the 1995 event, which brought 66 °F to Kotzebue on September 21.