Thursday, June 27, 2024

Hot and Smoky

As alluded to in Mike's post yesterday, an upper level ridge has brought very warm conditions to much of Alaska, and yesterday was downright hot in parts of the interior and north, with temperatures reaching well into the 80s.  The Whitestone Farms co-op site near Delta Junction reported 90°F, and that should be quite reliable, unlike the RAWS thermometers that always read high in the strong summer sunshine.

Elsewhere, Eielson AFB reached 87°F, North Pole saw 86°F, and Eagle reported 87°F.  Fairbanks airport, in contrast, only reached 81°F because of dense smoke in the morning: the McDonald and Clear fires are burning to the south of the Tanana River.

The enhanced satellite image below, posted by NWS Fairbanks, shows the location of active fires with the bright red colors.  Note the smaller but still substantial fires to the northwest of Fairbanks too.


Here's a view of yesterday's high temperatures.  Even on the North Slope temperatures jumped up into the 80s, including 85°F (maybe too high) at the Umiat RAWS and 80°F at Nuiqsut.  Up in the Brooks Range, Anaktuvuk Pass reached 78°F, which is pretty remarkable.


Statewide fire acreage has reached 148,000 acres according to the AICC.  This is a significant increase from a week ago, but that's to be expected at the time of year, and the running total remains somewhat below normal.

The relatively modest increase in fire acreage despite very warm conditions recently is probably related to the fact that lightning activity has not been especially problematic.  Sunday and Monday had about 11000 lightning strikes between them statewide, which is notable, but other than that lightning activity has been fairly subdued.  In fact, the total strike count in June is running about 25% below normal, based on a short history since 2012.

But the wet spring probably also has a lot to do with the (so far) modest fire season: ground moisture coming into the season was certainly higher than normal in many places.

https://ak-wx.blogspot.com/2024/06/may-climate-data.html

https://ak-wx.blogspot.com/2024/05/april-climate-data.html


Tuesday, June 25, 2024

Omega Block and the Upcoming Alaska warmspell.

 As like most avid weather hobbyists, I often spend my time studying the plethora of weather maps now available online.  With the upcoming warm spell forecasted for the majority of the state I found myself interested in the upper air patterns that is going to create it.  

The first and foremost player in this game is an unusually deep low-pressure system churning over the Bering Sea. While this area of the globe frequently experiences stormy weather and is the home of the semi-permanent Aleutian low it is unusual to see a storm this deep in the heart of summer.  Computer models have this storm dropping down to 977mb in depth.  Quite surprising for this time of year.  This deep of a storm would be more common in early fall.   See map below courtesy of NOAA.


Rising, cooling air releases a lot of latent heat when water is condensing, building up the existing ridge to is east.  Temperature difference at 850 mb (about 5000 feet in the atmosphere) is strong.  Temperatures are as low at -4.5C (mid 20's F) near the low center and +15C (upper 50's F) over eastern mainland Alaska!  See below 850 mb map courtesy of Ventusky:


Here's the corresponding surface temperatures, quite toasty over the majority of the state! 70's, 80's and perhaps a few 90's in the 40-mile country.  Even the arctic coast will get in on some of the action depending on prevailing wind direction. Southeast or south surface winds are conducive of warmth.


Durning these next few exciting weather days I noticed the upper atmosphere was getting into a stable pattern called an Omega block.  These can hang around for quite some time before breaking down.  Here is the basic definition courtesy of NOAA: Omega blocks are a combination of two cutoff lows with one blocking high sandwiched between them. Because of their size, Omega blocks are often quite persistent. So basically, warm and dry lingering in location while wet and stormy conditions remain day after day.  See computer model below of the forecasted Omega block at 700 mb or 10,000 feet.  Our second low pressure system (which is much weaker in comparison) is located off coast of the Pacific Northwest.  Seattle should have some cool weather the next few days.  Thanks for reading!  


Saturday, June 22, 2024

North Slope marine layer and Brook's Range Thunderstorms

Summer is moving forward up on Alaska's north slope.  The majority of the snow cover has melted, rivers and arctic lakes are opening up.  In response to some of our reader's queries about the recent warm spell affecting the 49th state I thought I'd share a little weather lore for the upper part of the state.  

The majority of Alaska is relatively warm now and will experience the warmest climatological weather in the next month or so (unless you are in the Aleutians when it comes much later).  That said the coastal areas are not as warm or lucky as the mainland.  In this article I am focusing on areas north of the Brooks however any community near large bodies of water will experience similar local microclimate effects.

Today it is bright and sunny across the majority of the North Slope.  As you can see from the infrared satellite, (courtesy of NOAA) northern Alaska has a large area of black north of the Brooks Range.  That dark color indicates warm air all the way to the ground.  Also interesting to note is the thunderstorms blossoming over the mountains.  Plenty of heat from the sun hitting the ground to allow convection along the spine of the mountains. There is additional instability support to the SW from a shortwave. Perfect recipe for storms! The coastal areas however are not near as dark as they are under the influence of the arctic marine layer.  The Arctic Ocean is still mostly frozen over and is reflecting a lot of solar radiation.  


The marine layer over the frozen ocean is cold, hanging around 32 degrees F which is a stark comparison to the landmass just to the south (60'sF).  See below picture courtesy of Ventusky.


One should note the cool greens near the coastal areas.  The winds are onshore, with a much colder marine layer invading coastal areas.  30's and 40's are spread across coastal areas while just a few miles inland its much warmer and in the 50's and 60's. Air inland from the coast being warmer and less dense is being forced to rise.  Colder, denser marine air is rushing in to replace it. Add in a little upper atmosphere instability, some low-level moisture and some elevation rise and it's the perfect recipe for thunderstorms. Here is another example of the marine layer pulled from Utqiagvik's afternoon weather sounding.  The strong June sun can't overcome the inversion caused by the marine layer.  Poor folks on the coast are still wearing winter hats while anyone to the south is in a t-shirt and shorts.


What would it take to get coastal areas to warm up and overcome the marine layer?  That would be the topic of another blog but needless to say it involves a south to north pressure gradient, with down sloping, offshore winds.  On a side note, the mosquitoes are not out yet, but I bet if I went 20 miles inland, they would be.  Thanks for reading!  Kaktovik Mike.


Thursday, June 20, 2024

Wildfire Update

Alaska's fire season has been fairly subdued up to this point, although residents of the Tanana Valley near Salcha might be forgiven for thinking otherwise, as a large fire is burning on the west side of the Tanana River.  The McDonald fire, as it's named, has burned about 40,000 acres, or nearly two-thirds of the state's total of 63,000 acres so far this season.  It's by far the largest fire in the state and has produced dense smoke in the local area.  Here's the latest update from the Alaska Fire Service:

https://akfireinfo.com/2024/06/20/mcdonald-fire-remains-west-of-the-tanana-river/

Elsewhere there are a number of fires in southwestern Alaska, sparked by widespread lightning activity on Monday:

https://akfireinfo.com/2024/06/18/recent-lightning-sparks-multiple-new-fires-in-southwest-alaska/

Also, a few large tundra fires are active in the northwest.

The 1995-2023 median statewide acreage for this date is about 100,000 acres, so the season is slightly less active than normal so far, but it's still early.  The median acreage jumps four-fold in the next 30 days, so things can change fast.

Here's a photo of pyrocumulus cloud over the McDonald fire on Monday, courtesy of the NWS via X/Twitter.  The fire was stirred up on Monday afternoon by winds related to nearby thunderstorm activity.


Speaking of thunderstorms, Bettles reported a heavy thunderstorm with quarter-inch hail yesterday.  This is unusual but certainly not rare: I found the following hail reports in the last 30 years at Bettles.

May 15, 1997   1/4" hail

May 11, 1998   1/2" hail

June 19, 2000   hail reported but no size specified

June 11, 2002   1/2" hail

July 1, 2005   1/4" hail

June 28, 2008   1/2" hail

May 26, 2017   1/4" hail

July 12, 2017   hail reported but no size specified

June 5, 2019   less than 1/4"


Fairbanks has had fewer hail reports in the same time, but the official data is from the airport, and other parts of town are more prone to thunderstorms.

June 8, 1997   no size specified

August 9, 2002   1/4" hail

May 14, 2012   3/16" (reported as graupel or small hail)

June 2, 2019   3/8" hail  (blog post here)

June 16, 2021   less than 1/4"


Monday, June 17, 2024

Some Unusual Warmth

Temperatures have been quite variable for much of the state in the past couple of weeks, as the flow pattern has been generally "blocked" with high pressure in the Arctic and (unusually) low pressure in the Gulf of Alaska.  In a circulation with high-latitude blocking, the jet stream tends to meander more unpredictably than normal, and of course the surface weather depends on where you find yourself with respect to those atmospheric eddies and swirls.

The northern interior has been perhaps the main beneficiary (if warm weather is considered a good thing); Bettles has seen temperatures above 70°F on all but 4 days this month so far.  The 12 days with a high temperature of 72°F or higher so far this year is unusual, although the record is 17 back in 2010 (through June 16).


Nome also had a mini-heatwave a week ago, with the temperature rising to 77°F last Monday.  This isn't the earliest on record for such warmth - it reached 78°F at the end of May in 1981 - but again it's unusual.  It also illustrates the positive skewness of the temperature distribution at this time of year in Nome: large warm departures from normal are more common than equally large cold departures.  For example, the normal daily high temperature in Nome on June 10 is 54°F, so last Monday was 23°F warmer than normal.  Imagine a day 23°F colder than normal: the high temperature would be only 31°F, but that has never happened (since 1907) in Nome in the month of June; the latest is May 28 (1934), and in more recent years May 24 (2001).


A decade ago, Brian Brettschneider illustrated the spatial distribution of daily mean temperature skewness across Alaska: check out the maps at this old post.


Note that this is for daily mean temperature, and there would be some differences for daily max and min temperatures.

Monday, June 10, 2024

May Climate Data

The month of May was the coldest since 2013 for Alaska as a whole, according to NOAA/NCEI data, and it was also wetter and cloudier than normal across most of the state - a rather unpleasant end to spring, and problematic for breakup flooding, especially for Kuskokwim River communities.  The only somewhat dry region was the Arctic northwest and Brooks Range, according to ERA5 data.  Also notable is the fact that it was the first wetter-than-normal month of the year for the southern Panhandle.


The far southwestern mainland and upper Alaska Peninsula saw the most anomalous cold for the month, with the "Bristol Bay" climate division having the coldest May since 2001, and before that 1985.  Checking in on a few sites in the region, Iliamna stands out as particularly unusual: the monthly mean temperature of 37.1°F was the coldest since 1971.


The cold and wet pattern was a direct reflection of a cold upper-level trough over southwestern Alaska.  The jet stream was well to the south, riding the strong north-south temperature gradient between extreme warmth in the central North Pacific and chilly conditions in the Bering Sea region:


By my calculations, the monthly PDO index of -1.8 was the most negative for May since 1950.  The 3-year smoothed PDO index is also the most negative since the early 1950s, illustrating that we're in one of the most entrenched and significant negative PDO regimes in the modern climate history.


As for wind, both northwestern Alaska and the eastern Aleutians were much windier than normal in May, and so was the southern Panhandle, according to ERA5.  However, the Arctic coast was relatively calm after a rather windy start to the year.


Wednesday, June 5, 2024

Bering Sea Cold

Alaska's west coast and southwestern peninsula have been remarkably chilly in the past couple of days - the coldest in many years for this date on the calendar.

But before I get into details on that, it's worth noting that the Fairbanks NWS office has issued 4 severe thunderstorm warnings (so far) today: one early this afternoon to the east of Fairbanks, and then 3 more for severe storms west of Nenana and up towards Manley Hot Springs.  Historically, many years pass with less than 4 severe thunderstorm warnings issued for the whole summer in the Fairbanks office.  Here's a photo taken around 4:20pm from UAF, courtesy of the NWS via X/Twitter:


A very strong and cold upper-level trough to the west and south provides part of the explanation for the stormy weather: there is unusually strong convective instability caused by the cold air aloft. 


The trough has also produced extremely chilly conditions for the Bering Sea and southwestern Alaska yesterday and today.  Bethel's high temperature was only 40°F yesterday, and snow was observed briefly in the morning.  Bethel hasn't seen a daily high temperature that low in June since 1972.  Similarly, yesterday's high in Cold Bay was only 39°F - again with some snow - the coldest this late in the spring since 1985.

Out in the Bering Sea, St Paul Island reported several lengthy periods of light snow earlier today, with visibility down to 1.5 miles and the temperature hovering at or just below freezing.  The FAA webcam showed some accumulation, as illustrated below:


Remarkably, this morning's balloon sounding from St Paul Island reported a temperature of -9.7°C at 850mb, which is the lowest this late in the season since 1985.  This is about the same as the normal 850mb temperature in January.

The unseasonable cold is related to a suddenly very intense negative phase of the PDO.  Check out the SST anomaly pattern across the North Pacific: extreme warmth extends eastward from Japan, but the Bering Sea has become much colder than normal.


The daily PDO index managed to reach -3.0 for the first time since September 2012, and it's only the second time it's happened in the history of daily data since 1982.


What's driving the anomaly?  Well, the negative PDO regime has been more or less locked in for several years now; but the current amplification is happening as the perennial North Pacific ridge has joined forces with Arctic high pressure via a ridge over eastern Russia, allowing the Bering Sea trough to deepen and intensify.  As for the Arctic ridging, it's a "blocking pattern" that's conducive to extremes at lower latitudes - for example, flooding in central Europe a couple of days ago, and snow in upland Scotland yesterday.

Thursday, May 30, 2024

What Will Fire Season Bring?

Alaska's wildfire season traditionally gets under way in June, and it's an interesting question as to what this year will bring.  Two years ago the fire season was very active (3.1 million acres) despite an entrenched La Niña, and that was an unusual combination; see my early season comments from 2022:

https://ak-wx.blogspot.com/2022/06/wildfire-outlook.html

In contrast, last year we had a strongly developing El Niño, and Canada had its worst fire season on record, but remarkably Alaska's fire acreage was less than 300,000 acres (and most of that was in August).  The 1979-2023 statewide annual median acreage is 482,000 acres.

https://ak-wx.blogspot.com/2023/06/almost-zero-fire.html

The chart below highlights that a majority of very active years have occurred with a warm tropical Pacific phase (positive ENSO or El Niño) in recent decades, but the last two years illustrate how fragile the statistical connection is.


In previous comments on this topic, I suggested that the unusual ocean warmth close to Alaska probably had a lot to do with the 2022 season: this too was highly unusual for La Niña.  If we look at conditions in May leading into the 10 most active fire seasons (since 1979), we see a strong connection to unusual warmth across the Bering Sea and western Alaska - see below.  Bear in mind that fires in May rarely contribute significant acreage to the season's total, so this warm signal is a precursor to the vast majority of the total fire activity in big years.


In years with very low fire acreage, May tends to be cool and damp, with a notable cold signal over the Chukchi Sea, no doubt partly related to higher sea ice in the 1980s.


May 2023 was indeed a lot cooler over the Bering Sea and western Alaska than May 2022.


And how are we looking this year?  May 2024 has been quite cool in Alaska, and notably so in western and southern areas, so it seems there may be a good chance of another subdued fire season like last year.  This would also be quite consistent with the CPC's summer forecast, which points to an elevated probability of significantly above-normal rainfall across interior Alaska, albeit with above-normal temperatures for central and eastern regions:


The May 1 wildfire outlook from NIFC called for "normal wildfire potential statewide from May through August", but given how May has unfolded, I wouldn't be surprised to see an adjustment toward below-normal risk in the upcoming June 1 outlook.


Thursday, May 23, 2024

Early Spring Wet Pattern

I promised to follow up with a few remarks about the wet pattern that has become a recurring theme of early spring (March-April) for western Alaska since 2018.  Rick Thoman pointed out this phenomenon on his blog:

https://alaskaclimate.substack.com/p/is-early-spring-precipitation-higher

As I commented briefly before, it seems pretty obvious that the immediate cause of the wet weather is the vigorous jet stream and storm track into western Alaska caused by a persistent ridge over the North Pacific.  Here's the March-April 500mb height departure from trend, averaged over the last 7 years.


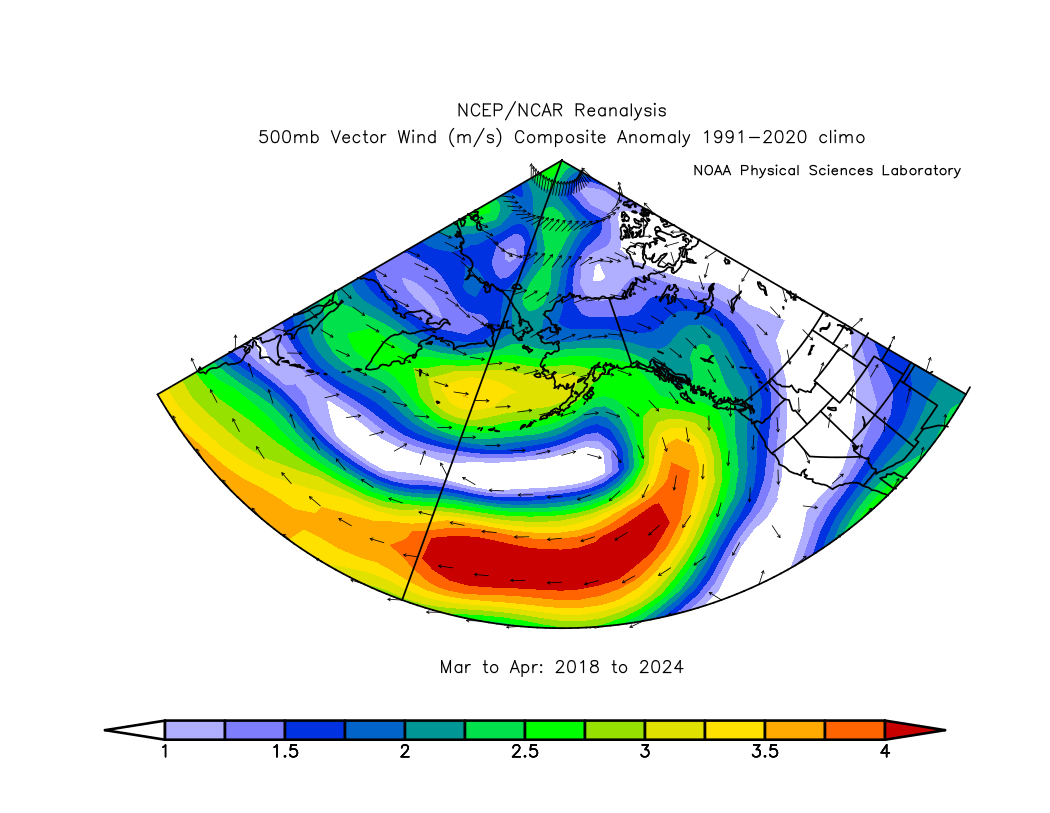
And here's the average 500mb vector wind anomaly (departure from normal): note the stronger than normal westerly flow into southwestern Alaska. 


I decided to look back prior to 2018 for an independent assessment of the relationship between west coast precipitation and North Pacific 500mb height patterns.  Here's the correlation of March-April 500mb height (detrended) with March-April precipitation in Nome:


This certainly supports the idea that a ridge axis from the Sea of Japan to the Gulf of Alaska is favorable for enhanced precipitation in Nome at this time of year.  A trough along the eastern Arctic coast of Russia also tends to be in the mix.  The pattern in the historical analysis implies a southerly wind component across western Alaska, and that corresponds to widespread warmth for western and northern Alaska.


The March-April pattern was slightly different this year, with a more westerly regime and cooler conditions in southwestern Alaska. 


How about sea surface temperatures?  Surprisingly, there's not much historical correlation between Nome precipitation and North Pacific SSTs at this time of year; it seems that early spring precipitation has historically been controlled by the vagaries of the weather pattern much more than by ocean temperatures.


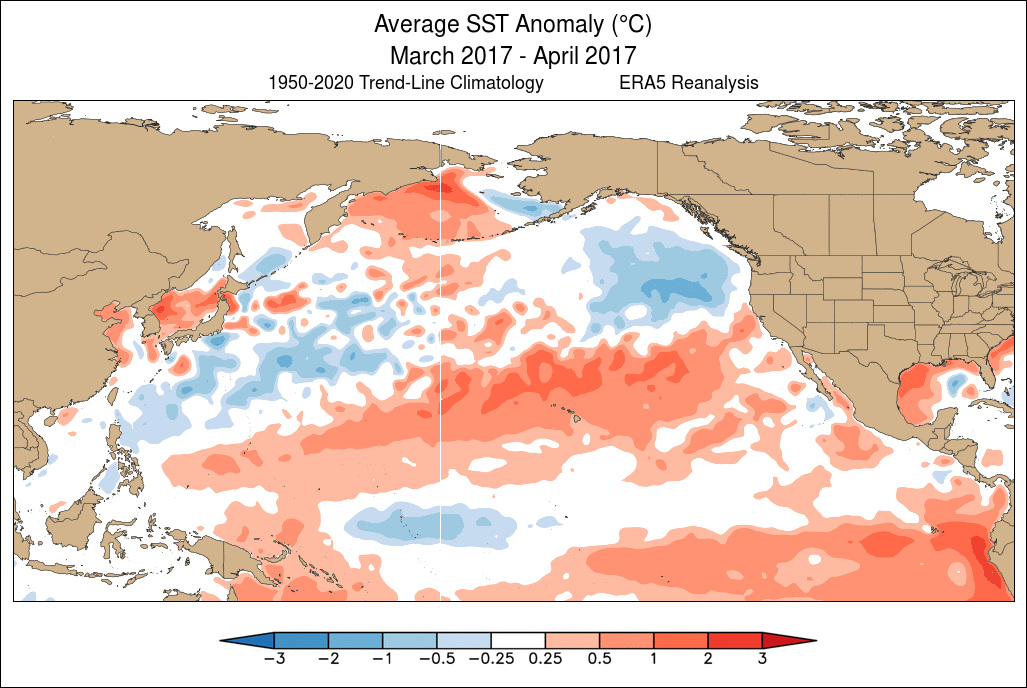
In contrast, however, I think the recurring pattern of the last 7 years is in fact linked to North Pacific SSTs, and strongly so.  Check out the sequence of March-April SST maps below, starting with 2014, when the so-called "blob" of excessive warmth was very much evident in the northeastern North Pacific.  This anomaly was linked to the "ridiculously resilient ridge" over western North America, leading to California drought and other things.  The "blob" pattern evolved into a strongly positive PDO pattern by 2016 in response to the intense 2015-16 El Niño, but then a regime change occurred in 2017-2018 as warmth transitioned to the northwestern North Pacific:


It is remarkable to see how persistent the pattern has become since... yes, 2018.  Here's a summary graphic showing the March-April detrended SST anomaly over the 7 years:


The alignment with the 500mb height anomaly is undeniable:


A really interesting aspect of this is that the warmth from Japan to the waters south of Alaska has persisted more or less unchanged regardless of El Niño and La Niña.  In the sequence of SST maps above, notice the major swings in tropical Pacific SST anomalies.  Normally we expect extratropical SST patterns to respond to ENSO - as in 2015/2016 - but the northwestern North Pacific seems to be marching to a different tune.

As an aside, it's worth noting that the emergence of warmth in the NW North Pacific in 2018 was quite striking at the time, and I commented on it in the North Pacific "blob blog":


Is this just the negative PDO phase that we're seeing in the North Pacific pattern?  Not entirely.  The PDO has indeed been persistently and significantly negative since 2021 - but not in 2018-2019.


A classical negative PDO phase tends to be linked to a trough over Alaska and cool waters from the Bering Sea and Gulf of Alaska to the northeastern Pacific, but the Bering Sea has been generally warmer than normal in recent years (especially in 2018-19), and Alaska hasn't been unusually cold.  Also, a negative PDO is not linked to above-normal precipitation in Nome in early spring.  The following maps show the average March-April pattern when the PDO was strongly negative over the decades.


So what can we take away from this discussion?  I think we can conclude rather confidently that the early spring wet pattern in (especially) western Alaska is linked to the persistent and exceptionally unusual North Pacific warm zone stretching east from Japan that emerged in 2018.  This developed in tandem with atmospheric ridging that both reinforced and was reinforced by the SST anomaly, and the atmospheric circulation anomaly has produced a storm track into western Alaska.

As for the deeper cause of the North Pacific anomaly, we can attribute some of it to the negative PDO phase (i.e. natural multiannual/decadal variability), but the excess warmth from the Bering Sea to the Gulf of Alaska is unexplained.  It feels like a new angle on the multi-year northeastern Pacific warm episode that developed in winter 2013-14, although the new warm zone now has a much greater duration.  I also have a sense that the new regime is related to "Arctic amplification" of the global warming trend, but this is speculation; presumably at some point the North Pacific pattern will shift again.

Finally, a question for next time: how else has the 2018 regime shift affected Alaska climate?  It will be interesting to look for other climate anomalies that developed at the same time, but for other locations and at other times of year.