Showing posts with label Meltout. Show all posts

Thursday, May 29, 2025

Runoff and Temperature

My post about the Fairbanks spring flood of 1948 elicited a comment from reader Andy, who suggested that cold in the second half of April might be a more significant indicator of breakup flooding than unusual cold earlier or later in the spring.  It certainly played a role in the 1948 flood: April 16-30 was by far the coldest in Fairbanks history.  More recently, 2013 saw a very cold April, and breakup was record late with a near-record peak discharge on the Tanana River.

I decided to take a look at this more closely using discharge data from the Chena River in Fairbanks.  Peak discharge isn't the same thing as breakup flooding, because the worst floods are caused by ice jams, but discharge gets at the runoff/meltwater part of the problem.

Here's a chart of the peak daily mean discharge in Fairbanks between April 1 and June 15:


Importantly, the Chena River Flood Control Project was completed in 1979, so the peak flows in Fairbanks have been constrained since then.

The flow typically peaks in May, but there is great variability in the date of peak discharge.  There's a long-term trend towards earlier peak flow, including since 1980; it has become unusual to see peak discharge after May 15 in recent years, but it used to be common.


This year we're seeing a secondary peak as a heavy snowpack is still melting out on the higher hills:


I chose June 15 as the cutoff date for "spring" discharge because that's when the flow is typically minimized prior to its gradual increase through summer; the weather gets wetter in interior Alaska as summer advances.


With all of this as background, I looked at the correlation between the peak discharge and the average temperature in Fairbanks for 15-day intervals throughout the spring.  Here's the result:


The negative correlation indicates that colder conditions correspond to higher peak discharge, which is what we expect: snowmelt is delayed and then occurs more rapidly once the inevitable warmth arrives.  In contrast, unusual warmth allows meltout to get under way early, increasing the window of time for all that meltwater to traverse the drainage basin.

Interestingly, there's no obvious date window that is particularly linked to peak flows, and in fact the greatest correlations are found quite early: late March into early April.  However, the correlations are quite small, so temperature in these 15-day windows does not explain much of the variance in peak discharge.

The potential relationship of temperature with discharge is somewhat confounded by the influence of snowpack depth: greater snowpack implies higher discharge, and spring snowpack is also correlated with temperature.  Not surprisingly, there is quite a good relationship between peak snowpack water content and peak discharge; the following chart uses snow water equivalent data from five SNOTEL sites in the hills above Fairbanks.


Using this relationship, we can remove the linear effect of the snowpack on the peak discharge, leaving us with the "residual" discharge that can't be explained by snow water content.  If we then compare the residual discharge with temperature, the correlations are a bit different:


This result suggests that temperatures in early spring (March 15-April 15) are actually more significant for determining peak discharge than temperatures in late April and early May.  I find this a bit hard to believe, because late March temperatures still average well below freezing in the Fairbanks area, so even warm years wouldn't be expected to see significant meltout that early in the season.  But perhaps there are still other correlations involved; warmth in late winter tends to occur with dry, sunny, and perhaps windy weather, and it's certainly true that humidity, sunshine, and wind can affect snowpack.

As for the larger correlation that shows up in early-mid May, this is right around the average time of peak flows, but at that time I would expect cold weather to actually reduce flows as the latter part of meltout slows down.  Again, perhaps the relationship - which is not particularly strong - is confounded by other factors.

I would be interested to hear any suggestions on how to refine the analysis in order to gain more insight.


Monday, April 28, 2025

Interior Contrast

This is the time of year when there are big climate contrasts across the Alaska interior, depending on where snow is still lying.  Fairbanks versus Bettles serves as a good example: the snowpack melted out (officially) last Wednesday in Fairbanks, and the temperature hasn't been below freezing since then.  The Tanana River ice at nearby Nenana went out yesterday.  In contrast, there are still 24 inches of snow on the ground in Bettles, and only a handful of days have reached 40°F so far.  Of course it's much more difficult to warm up with deep snow on the ground, so locations with earlier meltout get a big boost to temperature.

Using climate data from 1991-2020, April is typically a whopping 9°F warmer in Fairbanks than in Bettles, a bigger difference than in any other month.


Looking at the overlapping climate history for the two sites, the median snow meltout date is April 25 in Fairbanks (so this year was only a couple of days early), but it's May 12 in Bettles - a difference of 17 days.  Obviously part of this is caused by Bettles being farther north and therefore colder to begin with.  Bettles also gets a lot more snow - nearly 50% more total precipitation in winter than Fairbanks - so the snowpack tends to be deeper.

I think another factor is that the Tanana River valley sees an additional boost of spring warming from its location downwind of the Alaska Range, i.e. downslope warming.  The chart below shows the monthly average wind speed and direction in the middle atmosphere above Fairbanks (calculated using vector components).  Notice that the average wind direction becomes progressively more southerly in April, May, and June, before returning to southwesterly in July.


The winds at lower levels tend to be oriented even more from the south for most of the year.  For instance, at 700mb - approximately the height of the Alaska Range - the April wind above Fairbanks is typically from 210° on the compass (see below).  At 850mb (about 4000 feet above ground), the average wind is almost out of due south in April, although with great variability of course.  Episodes of southerly air flow are therefore very common, and the more abundant sunshine of spring tends to produce vertical mixing that brings warmth to the surface very effectively in the southeastern interior.  (Contrast this with winter, when a surface-based temperature inversion is typical.)


The northern interior, on the other hand, sees a much smaller warming influence from Alaska Range chinook flows; and with a slightly higher latitude and locally greater snowpack on the southern slopes of the Brooks Range, the positive feedback of snowmelt and reduced albedo is considerably delayed.

Here's a webcam view from Bettles today:


And just for fun, Arctic Village and Chandalar Shelf: glorious views.


Saturday, April 19, 2025

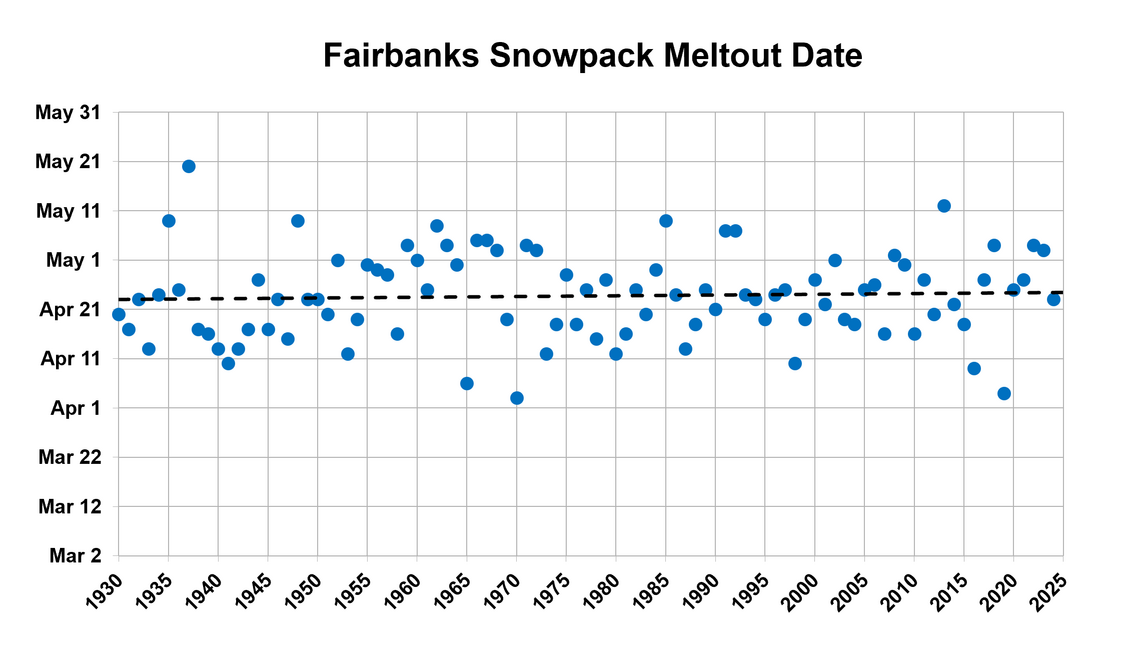
Trends in Meltout Date

The snow is going quickly at valley-level around Fairbanks, more quickly than expected, as there were several very warm days in the past week.  Thursday's high temperature of 58°F was nearly a record high for the date, and the daily mean temperature of 46.5°F was very nearly the earliest on record for such warmth.  Today's official measurement of snow depth for Fairbanks is 10 inches, down from 21 inches a week ago.

It's interesting to observe that there's no significant long-term trend in the date of meltout in Fairbanks.  Meltout is defined here as the first date with zero snow or a trace of snow on the ground, where a "trace" means less than 50% area snow cover OR more than 50% but too little to measure (less than 0.1 inches).


The absence of long-term trend is more than a little surprising in view of the fact that average temperatures have risen substantially at this time of year:


There may be several possible reasons for this discrepancy, but digging into them is a topic for another day.  Two obvious possibilities are (a) snowpack water content has increased, offsetting the increased warmth; and/or (b) changes in measurement location and/or method have influenced the meltout dates.  The measurement location certainly has changed a few times, most recently just a few years ago when (I believe) the location changed from the airport to the university's West Ridge campus.

But on to the main topic of today's post.  I was interested in a spatial view of meltout trends across Alaska, so I used ERA5 reanalysis data to take a stab at this.  First I examined whether ERA5 is able to capture year-to-year variability in meltout for two locations with reliable long-term snow depth data: Fairbanks and Bettles.  The results are quite encouraging, with correlations of 0.86 (Fairbanks) and 0.89 (Bettles) since 1950.


Note that I used slightly different definitions of ERA5 meltout for the two locations, based on trial and error.  For Fairbanks I found that the correlation of ERA5 and observed dates is best when "ERA5 meltout" is defined as the date when ERA5 snow water equivalent (SWE) drops below 0.5cm (liquid equivalent), whereas for Bettles a threshold of 1.0cm works slightly better.  Encouragingly, not only are the year-to-year correlations optimized at these thresholds, but the average dates line up too, i.e. the ERA5 dates are not systematically earlier or later than the observations.  This in itself is quite surprising; I frankly did not expect the model to do this well.

(Note that using zero SWE for ERA5 meltout is not reasonable, because the ERA5 grid cells are almost 20 miles wide and include higher elevations where snow lingers much longer.)

It's interesting to see that, unlike the official Fairbanks observations, ERA5 shows a substantial trend towards earlier meltout in the Fairbanks area.  The ERA5 result is perhaps more like what we would expect in response to the temperature trend; so this does make me wonder about the representativeness of the historical snow cover record from Fairbanks.  In Bettles the ERA5 trend is less than at Fairbanks, and it's also closer to the "ground truth" trend.

Finally, having established that 0.5cm SWE is a reasonable threshold for ERA5 meltout, here's a map of the ERA5 trend across the state.


A 75-year trend of 1-2 days/decade is widespread across central, western, and northern regions, corresponding to about 1-2 weeks of change since 1950.  However, more rapid trends are evident in southern areas.  Note that I have only calculated the trend in locations where the ERA5 snowpack reached at least 0.5cm in every year, and I also excluded locations where meltout did not occur by July 1 in any year; so the analysis is only for areas with a completely reliable late winter snowpack that then always melts out before summer.

Here are maps for North America and for the Northern Hemisphere, using the same 0.5cm SWE threshold for meltout (and I don't know how well that works in other regions).  Click to enlarge.  There are a couple of small zones with slightly positive trends: in interior northern Canada and in far northern Finland.  But overall the picture is one of dramatically earlier meltout, especially in the more southern latitudes.


Monday, April 22, 2024

Warming Up Fast

A very strong upper-level ridge over Southeast Alaska and northwestern Canada has produced a big warm-up for eastern and southern Alaska in the last week, with temperatures reaching record levels for the time of year in some spots.  Yakutat reached 64°F on Friday, which would be the warmest on record this early in the season if it were not for a similar warm-up in 2021.  Numerous locations set daily record highs on Friday and/or Saturday, from Ketchikan (65°F) in the far south to Bettles in the northern interior (56°F).

Here's the 500mb analysis from 4pm AKDT on Thursday, courtesy of Environment Canada:


The most unusual warmth I spotted was at Cordova, where the daily minimum temperature of 47°F on Thursday was the highest overnight minimum this early in the season by a full 3 weeks.  Bettles also saw a record warm night for this early, with a low temperature of 39°F on Thursday despite having 29" of snow on the ground at that time.

As of the last daily report, Fairbanks snow depth is down to 3", so the official meltout date may well be today.  The ice at Nenana is looking very rotten, and the accumulation of thawing heat units is now in the historical range for breakup.  However, with unusually thick ice this year - measured at 50" a couple of weeks ago - perhaps it will be a few more days before the tripod goes out.


With meltout occurring earlier this year than the last two seasons (both in early May), green-up and fire season in the eastern interior will probably come to life a bit earlier as well.  Here's an article discussing this, with a few comments from Rick Thoman:

https://www.webcenterfairbanks.com/2024/04/17/fires-floods-risk-with-early-may-green-up/

It makes sense that there would be a connection between early snowpack loss and increased early-season fire activity, so I had a quick look to see if this shows up in the data.  The chart below shows June 1 fire acreage statewide versus the snowpack meltout date in Fairbanks:


There does seem to be something of a relationship, although it's marginal and the sample size is small (I only have daily fire data back to 1995).  If we step forward to July 1, the relationship seems to disappear:


The highest July 1 acreage on the chart was in 2022, when the Yukon-Kuskokwim region saw unprecedented early fire activity owing to a very dry spring; there's a lot more to the puzzle than just the timing of meltout.

https://ak-wx.blogspot.com/2022/06/early-fire-and-may-climate-data.html


Friday, April 30, 2021

Meltout and Breakup

A couple of quick notes this evening to mark the seasonal transitions of meltout and breakup in the middle Tanana River valley: the Fairbanks snowpack melted out on Tuesday, and the tripod went out at Nenana today.

It's typical for meltout to be about a week ahead of breakup at Nenana, but a 3-day difference isn't too unusual.  There have been a handful of years when the ice went first (most recently 2018: May 1st versus May 4th).

The unusual aspect of this year's events is how quickly it all happened, after the severe cold around the 10th of the month, with 37" of snow on the ground on April 11.  This year's meltout is the fastest on record that snow depth of 30-36" has disappeared in Fairbanks - see the chart below. Remarkably, this is very similar to last year, which still holds the record for losing snowpack of around 27".


An interesting factoid - which is probably related - is that today is one of the coldest breakup days on record, with a high so far of only 38°F in Fairbanks.  Nenana breakup has never been observed with a high under 40°F, so this might be a new record.  It seems very likely that the ease with which the ice moved today is related to the huge meltout flows that are putting a lot of pressure on the ice; without the big snow melt, the ice probably would have held on a few more days.

[Update: the high was 39°F - and a trace of new snow was observed.  Not your typical breakup weather.]