Showing posts with label Snowpack. Show all posts

Wednesday, February 25, 2026

Fairbanks Snow Onslaught

Last month we were talking about record snowfall in Anchorage, and just a few weeks before that the focus was on extreme snowfall from Juneau northward in Southeast Alaska.  Attention now turns to Fairbanks, where there has been a remarkable onslaught of snow (for the interior) in the past two weeks: the NWS reports 37" in the two-week period.  Here's a season-to-date chart courtesy of xmACIS2:


The monthly snowfall of 38.5" in Fairbanks puts 2026 solidly into second place for the February total; the record is 43.1" in 1966.  The monthly total has also broken into the top 10 for all calendar months, which is remarkable given that early winter tends to be snowier than late winter.  If it were not for the snow deluge of December 2021 (50"), this would be the snowiest calendar month since 1993.

The 14-day snow total of 37.3" is competitive with the highest 2-week total in December 2021 (38.9").  Prior to that, 2-week totals of over three feet occurred in January 1937, February 1966, Nov-Dec 1970, December 1984, and December 1990.  It's not a long list.

As for snow depth, the NWS reports 38 inches on the ground in Fairbanks, and that's the highest for a date in February since 1993.  (The snow pack reached 38-40" in early March 2022 and in April 2021, but no other winter since 1993 saw these snow depths.)

Here's the culprit: a strong mid-atmosphere ridge (high pressure) near the Aleutians in the past two weeks, producing a trajectory of moist air flow clockwise around its northern perimeter.


The mid-atmosphere winds originated far to the southwest and flowed into western and central Alaska without let or hindrance: a perfect recipe for persistently wet weather in the interior.


Another unusual aspect of the recent weather in Fairbanks has been the episodes of wind and blowing snow, both yesterday and last week.  I'll have more to say about that in my next post.

Thursday, May 8, 2025

April Climate Data

Last month was the second wettest April in recorded climate history for Alaska as a whole, according to climate data released today by NOAA/NCEI.  The data spans from 1925 to the present.  The only wetter April was 1977, and the margin of difference is very small (3.11" vs 3.09"), so it's essentially a tie.

This marks the third month that has been either wettest or second wettest in the last year, with January and July both equaling or exceeding the previous record for those months.  Interestingly, there have also been very dry months in the past year (notably June, November, and February), so the 12-month running mean statewide precipitation is only slightly above the 30-year normal; but the 10-year running mean is at a record high.


Here's the regional distribution of the April precipitation percentile.  The northern Gulf coast was nearly record wet for April, and the Bristol Bay, South-Central, and Northeast Interior divisions also saw very anomalous precipitation.


ERA5 data paints very much the same picture.

The weather pattern responsible for the wet weather involved a monthly-mean trough from the Bering Strait region to northwestern Canada; here's the 500mb (mid-atmosphere) pressure anomaly for the month.


This is quite similar to the wet pattern in January, particularly in terms of the anomalous ridge axis from the Sea of Okhotsk to the Gulf of Alaska.  Here's the 500mb map from January:


The main difference between the two months is that January saw a much stronger ridge near Southeast Alaska, leading to a more southerly flow direction and therefore more anomalous warmth: January was in the top 10 for warmth statewide, but April lacked unusual warmth in the west and north.


April mean wind speeds were mostly above normal in southern and eastern Alaska, but the west coast was relatively calm, especially around the Seward Peninsula.


With April still being cold enough in northern Alaska that precipitation often falls as snow, the relatively wet weather allowed the northern interior snowpack to become more anomalous compared to a month earlier.  Indeed, ERA5 data suggests the snowpack is one of the greatest in recent decades for parts of the north-central interior.


NRCS SNOTEL data supports this, with Bettles and Coldfoot snow water equivalent currently at 91% and 93% respectively compared to the historical distribution.  1993 and 2019 had greater early May snowpacks at these two sites.


Finally, Bering Sea ice extent was near the multi-decadal normal for April, as the 2018-2019 low continues to look more like a short-term "blip" - although we're nowhere near the high ice coverage of the 2008-2013 period.


Saturday, April 19, 2025

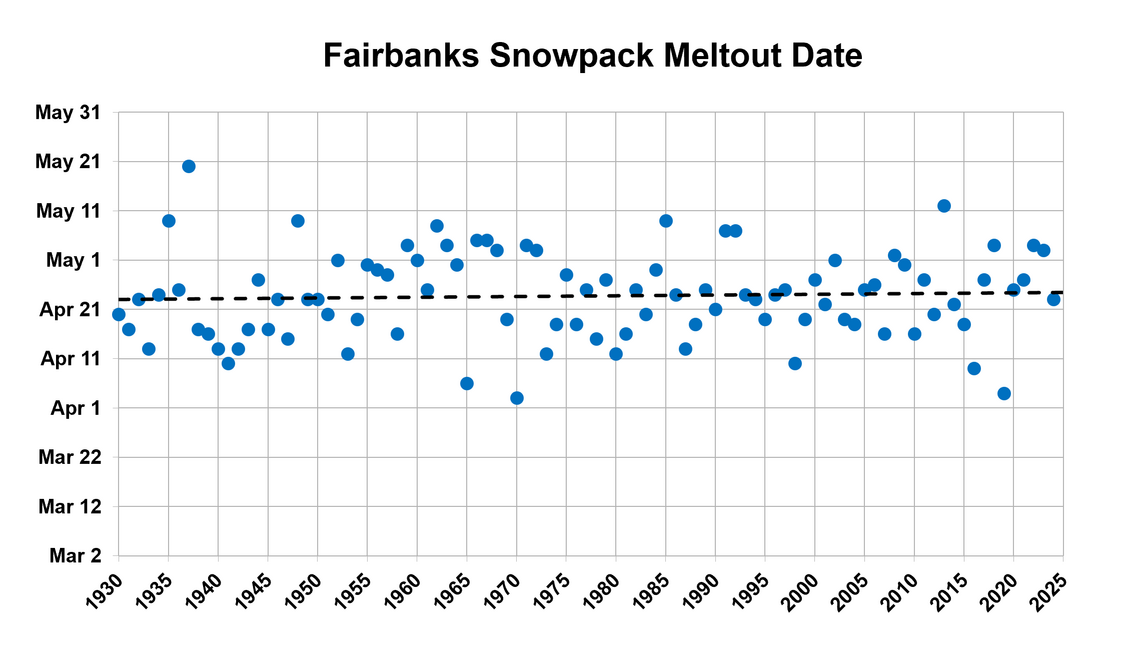
Trends in Meltout Date

The snow is going quickly at valley-level around Fairbanks, more quickly than expected, as there were several very warm days in the past week.  Thursday's high temperature of 58°F was nearly a record high for the date, and the daily mean temperature of 46.5°F was very nearly the earliest on record for such warmth.  Today's official measurement of snow depth for Fairbanks is 10 inches, down from 21 inches a week ago.

It's interesting to observe that there's no significant long-term trend in the date of meltout in Fairbanks.  Meltout is defined here as the first date with zero snow or a trace of snow on the ground, where a "trace" means less than 50% area snow cover OR more than 50% but too little to measure (less than 0.1 inches).


The absence of long-term trend is more than a little surprising in view of the fact that average temperatures have risen substantially at this time of year:


There may be several possible reasons for this discrepancy, but digging into them is a topic for another day.  Two obvious possibilities are (a) snowpack water content has increased, offsetting the increased warmth; and/or (b) changes in measurement location and/or method have influenced the meltout dates.  The measurement location certainly has changed a few times, most recently just a few years ago when (I believe) the location changed from the airport to the university's West Ridge campus.

But on to the main topic of today's post.  I was interested in a spatial view of meltout trends across Alaska, so I used ERA5 reanalysis data to take a stab at this.  First I examined whether ERA5 is able to capture year-to-year variability in meltout for two locations with reliable long-term snow depth data: Fairbanks and Bettles.  The results are quite encouraging, with correlations of 0.86 (Fairbanks) and 0.89 (Bettles) since 1950.


Note that I used slightly different definitions of ERA5 meltout for the two locations, based on trial and error.  For Fairbanks I found that the correlation of ERA5 and observed dates is best when "ERA5 meltout" is defined as the date when ERA5 snow water equivalent (SWE) drops below 0.5cm (liquid equivalent), whereas for Bettles a threshold of 1.0cm works slightly better.  Encouragingly, not only are the year-to-year correlations optimized at these thresholds, but the average dates line up too, i.e. the ERA5 dates are not systematically earlier or later than the observations.  This in itself is quite surprising; I frankly did not expect the model to do this well.

(Note that using zero SWE for ERA5 meltout is not reasonable, because the ERA5 grid cells are almost 20 miles wide and include higher elevations where snow lingers much longer.)

It's interesting to see that, unlike the official Fairbanks observations, ERA5 shows a substantial trend towards earlier meltout in the Fairbanks area.  The ERA5 result is perhaps more like what we would expect in response to the temperature trend; so this does make me wonder about the representativeness of the historical snow cover record from Fairbanks.  In Bettles the ERA5 trend is less than at Fairbanks, and it's also closer to the "ground truth" trend.

Finally, having established that 0.5cm SWE is a reasonable threshold for ERA5 meltout, here's a map of the ERA5 trend across the state.


A 75-year trend of 1-2 days/decade is widespread across central, western, and northern regions, corresponding to about 1-2 weeks of change since 1950.  However, more rapid trends are evident in southern areas.  Note that I have only calculated the trend in locations where the ERA5 snowpack reached at least 0.5cm in every year, and I also excluded locations where meltout did not occur by July 1 in any year; so the analysis is only for areas with a completely reliable late winter snowpack that then always melts out before summer.

Here are maps for North America and for the Northern Hemisphere, using the same 0.5cm SWE threshold for meltout (and I don't know how well that works in other regions).  Click to enlarge.  There are a couple of small zones with slightly positive trends: in interior northern Canada and in far northern Finland.  But overall the picture is one of dramatically earlier meltout, especially in the more southern latitudes.


Saturday, April 12, 2025

Breakup Flooding Outlook

Despite the wintry chill in the air this morning (-6°F in Tanana, -16°F near Huslia), the sun is winning the seasonal battle, and major river breakup is only a few weeks away.  The Alaska-Pacific River Forecast Center in Anchorage produces a breakup outlook once a week, and yesterday's update discusses the wide variation in snowpack and therefore flood potential across the state.


Snowpack is greater than normal from the central interior up to the Brooks Range, and so it's no surprise to see above-average expected meltwater runoff for these areas, and a "moderate" flood potential for several communities:


In the breakup outlook's table of flood potential, the Chena River basin is listed as "above normal", and that's consistent with the hefty snowpack in the hills above Fairbanks.  The NRCS April 1 snow survey report describes it thus:


The report lists Cleary Summit (2250' on the Steese Highway) as having a snow depth of 48", with water content of 11" (177% of normal).  This is one of the most impressive snowpack numbers in the Alaskan interior, and is quite remarkable for the elevation.

Hopefully the process of meltout and breakup will be gradual and not all at once.  The short-term forecast looks encouraging: near normal temperatures in the next 10 days, allowing some melting to get under way.


Here's a link to get updates for this graphic (enter the ICAO code for any airport location, e.g. PAFA for Fairbanks, PAEG for Eagle, etc):


And for bonus content, here's an animation of the Yukon River view at Dawson today, courtesy of dawson.meteomac.com.  It looks like people are still crossing the ice bridge, although it officially closed on Monday:


Monday, March 10, 2025

February Climate Data

NCEI and ECMWF have updated their climate data for February, so we can have a look back at last month and also the traditional climatological winter season of December-February.

February was the "least warm" month of winter for Alaska as a whole, but it was still warmer than the 1991-2020 average across most of the state's land area.  It was especially warm in the west and southwest, and quite warm on the North Slope too:


The obvious difference from December and January was in the Southeast, where February was colder than normal, and quite significantly so in the southern Panhandle.  This change occurred because instead of a ridge over western Canada, February saw a trough from the north-central Pacific to southern Canada, and the flow orientation brought cold interior air to southeastern Alaska.  November was somewhat similar, with Southeast being colder (relative to normal) than the rest of the state.


For Alaska as a whole, December-February was the 3rd warmest such period in the NCEI climate data history (1925-present); only 2000-01 and 2015-16 were warmer.  While unusual warmth was universal across Alaska, it was most pronounced for the Alaska Peninsula and the northwestern Gulf coast.  Both Cold Bay and Kodiak had their second warmest Dec-Feb on record (2013-14 and 2014-15 were the warmest at these two sites respectively).


While February didn't mark a dramatic break with earlier warmth in most of the state, the precipitation contrast between January and February could hardly have been greater, as nearly all of the state was drier than normal in February.  In southwest and south-central areas the deficit was really unusual; Anchorage saw its driest February on record, and according to Rick Thoman several locations in the Palmer area reported no measurable snow at all.  This is really remarkable, following January's onslaught of moisture.


January was so wet that despite February's dryness, large parts of the state were significantly wetter than normal for Dec-Feb overall.  According to ERA5 model data, only the North Slope was notably dry, but the NCEI February estimate strongly disagrees on this.  Given the paucity of reliable ground-truth winter precipitation data, I would tend to trust ERA5 more, but UtqiaÄ¡vik did report over an inch of liquid equivalent, almost enough to be in the top 10 for Dec-Feb precipitation.


As of the end of February, snowpack was very healthy for monitored areas in the western and northern interior, but major deficits are evident in South-Central.  The Iditarod start was moved to Fairbanks for the 4th time (other years 2003, 2015, 2017).


ERA5 snow data shows a similar north-south contrast in snowpack fortunes:


The lack of snow in southern areas increases the risk of early season wildfires, and that has been reflected in the fire potential outlook:


Burn permits will be required beginning just one week from now across southern Alaska:


Finally, I'll close with ERA5's estimate that the Dec-Feb season was much windier than normal across the northern half of Alaska (see below).  This is broadly consistent with the warmth, as winds tend to mix out the surface-based inversion that is associated with valley-level cold; but the relationship is quite weak and is very elevation-dependent.  See here for some previous results on the temperature-wind correlation in the model data:


Friday, January 17, 2025

Snow and Ice Update

Rick Thoman wrote about mid-January snow conditions at his site today, and I think it's worth amplifying some of the information here.  Snowpack is now very poor in western and southwestern Alaska, as there has been some very warm weather - notably so last weekend, but again today it is substantially above freezing over much of the southwest, with rain in some places.  The first map below is several days out of date, being based on ERA5 data, but it shows a more extensive area of very low snowpack than the map I posted on New Year's Eve (second map below):


The satellite image below, taken on Wednesday, shows that there is (or was) still snow on the ground across the Y-K Delta region, but it seems it's a minimal snowpack.  Click to enlarge:


On the plus side, it seems that there's been enough snow at elevation to improve the snowpack a bit in south-central Alaska, although it's still well below normal along the northern Gulf coast:


As for sea ice, the latest NWS analysis lines up nicely with the satellite image, with ice coverage extending just south of Nunivak Island.

The NSIDC analysis (showing regions of 15% sea ice concentration or more) is similar, and it reflects a modest deficit for the Bering Sea compared to the 1981-2010 normal.  Arctic-wide, sea ice extent is running very close to a record low, and it's notable that there are no areas with significantly above-normal ice for the time of year.


Tuesday, December 31, 2024

Snowpack

Happy New Year to all.  Let's check in on Alaska's snowpack at the turn of the year.  It's a mixed bag, but generally snowfall has been much less abundant than in the Fairbanks area (relative to normal), according to ERA5 estimates:


Fairbanks has 22" of snow on the ground, according to the official measurement, and that's towards the upper end of the historical range for the time of year - although there was much more (34") on New Year's Eve in 2021.  The SNOTEL sites in the hills above Fairbanks are reporting about 150-200% of normal snow water equivalent, and the Mt Ryan site (2800' elevation) has been at record high snowpack since late October (only recently dropping behind the 2021 trajectory):


In contrast, there is a real dearth of snow across the Seward Peninsula and across nearly all of southwestern and south-central Alaska.  We have to go back to 2016 to find so little snow in late December for southwestern Alaska; but in that case the shortfall was much greater statewide:


Anchorage has 8" of snow on the ground, a lot less than the last two years, and the least since 2019 on New Year's Eve.  A number of SNOTEL sites around South-Central are reporting well under 50% of normal SWE - see below.  Let's hope this situation doesn't worsen in the weeks and months ahead.


Friday, May 3, 2024

April Snow and Temperature

This year in Fairbanks, the date of snowpack meltout - the first day with less than 50% snow cover, or less than an inch depth reported - was April 23.  This is just a day or two ahead of the long-term normal, despite April being distinctly warmer than normal: the month was nearly 3°F warmer than the 1991-2020 average, and fell just inside the warmest 33% of the historical distribution.

However, the snow depth at the beginning of April wasn't greater than normal - in fact it was slightly less (15" versus a 1991-2020 median of 20") - so it's not immediately clear why meltout didn't occur sooner.  But of course there's a certain amount of randomness in the meltout dates at a single location, and the measuring site hasn't remained the same over the years.

One other note on the meltout date: two of the earliest meltout dates in Fairbanks history were in 2016 and 1998 (April 9 and 10 respectively), and those two years were coming out of intense El Niño episodes.  Given that we also had a very strong El Niño this winter - almost on a par with those earlier events - it's again interesting that meltout wasn't sooner.

Let's consider briefly the relationship between April snow cover and April temperatures.  Of course this is a chicken-and-egg problem: temperature affects snow cover, but snow cover also influences temperature.  The basic relationship is obvious, with a tendency for less snow on the ground in warmer Aprils.


Notice that there's a better correlation for daily minimum temperatures than for daily highs.  This makes sense, as nighttime temperatures are prone to dropping more sharply over snow-covered ground than over bare ground.

The major outlier with record April snow depth was 1991 (42" remaining on the 15th!), but the monthly mean temperature was only slightly cooler than this year.  The incredible snow pack that month lingered in spite of the monthly temperature, not because of it.

If we examine the 850mb temperature in relation to April snow depth, the correlation is weaker: see below.  This chart more cleanly illustrates the influence of air mass temperature on snow depth, rather than the other way around, because we wouldn't expect the snow cover to greatly affect the air temperature several thousand feet above the ground in the "free" atmosphere.


In an attempt to extract the reverse causation - the influence of snow depth on surface temperature - the following chart looks at the temperature difference from the surface to 850mb.


It's a weak relationship overall, but better for daily low temperatures than for high temperatures.  Note that 1991 is less of an outlier here.  In April 1991, particularly at night, the snow pack seems to have held back the surface temperatures compared to what the 850mb air mass temperatures would otherwise suggest.

I also started looking at daily temperatures in an effort to see the seasonality (calendar timing) of snow's influence on temperature in Fairbanks, but I'll discuss those results in another post.