Thursday, April 28, 2022

Radiation Normals

Recently I've been taking a look at the (infrared) radiation climate for Fairbanks, based on data from the state-of-the-art ERA5 reanalysis.  I suppose that many people may find it a rather abstract topic, but to me there's nothing more relevant in the world of weather and climate than radiation, and particularly the long-term trends thereof.  After all, solar radiation ("shortwave" radiation) is the fundamental driver of weather, and the imbalance between incoming and outcoming radiation controls weather and climate variations on many time scales.

The chart below shows the monthly normals for the familiar shortwave radiation budget near Fairbanks, according to ERA5.  Solar input (red columns) is close to zero in November through January, it rises quickly in spring under relatively clear skies, and then its decay in autumn is more gradual because increased cloud cover in July and August brings a premature decline (e.g. July has more daylight than May, but much more cloud cover).


The blue columns show the normal upward (reflected) shortwave radiation at ground level, and this peaks in April because most of the month is usually snow covered under relatively strong sunshine.  However, the albedo (i.e. the fraction of incoming solar radiation that's reflected) does drop off markedly in April as snow disappears from trees and eventually from the ground, and it remains near 0.1 until October, when snow cover typically returns.

This much is pretty straightforward to understand.  However, the longwave radiation budget is less intuitive, and in particular it can be a surprise to see that the rate of energy transfer for both incoming and outgoing longwave radiation is much greater than for shortwave - see below.  Probably not many of us would guess that much more radiation is warming us from the sky above than we receive directly in the form of sunshine, even in summer.  Of course this is largely because we're bathed in longwave radiation at all hours of the day and night (emitted by clouds and the atmosphere), with little change from hour to hour, but intense sunshine is confined to only a portion of the day.


But although the incoming longwave is large, the outgoing is even larger at all times of the year, because the ground temperature is higher than the average emitting temperature of the clouds and air above.  The longwave radiation flux is proportional to the fourth power of temperature, so both upward and downward components track very closely with the seasonal temperature cycle.  The only obvious departure from a simple seasonal cycle that I can see is that the downward flux doesn't increase from January to March as quickly as the upward flux, and that's because the surface warms up more quickly than the air aloft (and also because the air stays very dry well into spring - water vapor is very efficient at absorbing and emitting these wavelengths).

So we have a net loss of longwave energy at all seasons, and a net gain of shortwave in all but winter.  What does the overall net look like?


Here we see that there's a net gain of radiative energy from March (barely) through September, and a small loss from October through February; and overall it's a significant gain over the course of a year, which is perhaps a bit surprising at a latitude of nearly 65°N.

Now someone may ask why the temperature in Fairbanks drops so dramatically in the early autumn when there's still a net gain of radiation - even in September, according to ERA5.  The answer is that this radiation budget pertains to the ground surface, not the air above.  The atmosphere doesn't absorb or emit shortwave radiation, so the longwave balance is the only thing at play - and consider that the atmosphere only gains longwave energy from below, while it emits it both downward to the ground and upward to space.  This implies a significant net radiative loss for the atmosphere year-round, and when heat transfer from the surface (by mixing/convection) drops off in the autumn, there's nothing to stop the air from cooling rapidly.

In another post I'll take a look at long-term trends in the different radiation components.

Thursday, April 21, 2022

Breakup Briefing

Here's a link to Tuesday's UAF/ACCAP/NWS river breakup briefing:

https://uaf-accap.org/wp-content/uploads/2022/04/Break-up_2022_Outlook_combined.pdf

The breakup portion starts on Slide 14.  To probably no one's surprise, the key message is, "We expect a dynamic breakup with above average potential for ice jams and flooding."

I thought this was a helpful graphic to explain the difference between dynamic (mechanical) breakup and thermal breakup:


The higher the ice resistance at the point where it is overcome by driving forces, the more "dynamic" the breakup is said to be; at the dynamic extreme, it's a violent process involving what we might call an irresistible force and an immovable object.  At the other end of the spectrum, ice resistance crumbles before the driving force rises a lot, and the whole process is relatively uneventful.  Most breakups occur somewhere in the middle, but this year's abundant snowpack and this month's chilly conditions have tilted the odds significantly towards the dynamic end.

Here's an NWS graphic showing estimated flood potential for settlements across Alaska.  Circle is the only location with a "high" risk rating, with an estimated breakup window of May 9-15.  Note that the risk pertains to both ice jam flooding and snowmelt flooding, with the latter involving the greatest discharge.


Saturday, April 16, 2022

River Ice Wecams

For those interested in breakup progress, here's a nice resource for daily-updated webcam views:

http://fresheyesonice.org/view-data/realtime-data/river-ice-camera/

Yesterday's photos are linked below via Twitter.  There's no significant breakup yet; the ice is getting soft under the sun with warm afternoon temperatures, but nights have been cold.  Fairbanks has yet to see a daily mean temperature above freezing, and this is unusual: in the past 30 years, only 2013 and 2002 had zero thaw degree days by April 15.  Of course 2013 was the coldest April on record in Fairbanks, with a record late breakup at Nenana, and 2002 was also very chilly, with Nenana breakup on May 7.


Saturday, April 9, 2022

March Climate Data

With March climate data now available, here's a look back at the major climate anomalies.  For the month as a whole, the broad circulation pattern around Alaska was quite similar to that of February - compare the two maps below - and most of southern Alaska was again wet, cloudy, and mild.  However, there wasn't enough sustained ridging to the west to keep cold locked in over northern Alaska, and it was easily the warmest month of the winter for the state (and the only month that was significantly above normal statewide).


Here are the temperature and precipitation rank maps from NOAA and ERA5 respectively:


And to confirm the widespread warmth, Rick's ground-truth temperature anomaly map:


Wind and solar:


According to the ERA5 data, it was an unusually windy winter overall from the west coast to the northern interior, but it wasn't Bering Sea storms that produced this anomaly: MSLP was generally higher than normal from the Chukchi Sea to the Gulf of Alaska (see below).  Looking at ASOS wind data from Kaltag as an example, virtually all of the windiest days had winds from the northeast; this is the favored interior wind direction, of course, but it appears the strength of these winds was considerably enhanced by repeated episodes of high pressure to the north and northwest.


Winter temperatures overall were not as low as might be expected during a significant La NiƱa, and south-central Alaska was actually warmer than normal.


Extremely widespread and very unusual warmth in the northwestern North Pacific may help explain the lack of sustained cold in most of the state despite a negative PDO phase and a circulation pattern (Bering Sea ridge) that was relatively favorable for cold northerly flow.  Sea surface temperatures were far above normal to the south of the Aleutians, and that's a source region for Alaskan air during more southerly episodes such as late February and early March.


Extreme precipitation was the biggest story overall, especially for the interior.  As Rick Thoman pointed out, snowpack water content on April 1 in Tok was nearly 50% higher than the previous record from way back in 1967 - see below.


Click to enlarge the April 1 snowpack map below.  According to NRCS, four subbasins have 250% or more of normal snow water equivalent: Nenana River, Tanana Flats - Tanana River, Healy Lake - Tanana River, and Salcha River.  Meltout and breakup continue to be a very pressing concern in terms of flood risk, especially with the forecast continuing to favor below-normal temperatures this month.


Friday, April 1, 2022

Sea Ice Update

First a quick comment again on northern Alaska, where winter is holding on.  Temperatures have dropped into the -20s °F widely across the North Slope the last 3 nights, and not because it's been calm; strong winds have pushed wind chills down into the -40s and even -50s in some spots.

According to airport ASOS data, Point Lay on the west coast has seen nearly continuous blizzard conditions (blowing snow, presumably) since late Tuesday morning.  Winds have been sustained at 30-40mph or greater the whole time, with a temperature between -10°F and -20°F.  Not bad for April.

But of course we're nowhere near record cold for the time of year across the region.  Daily record lows at Umiat are still in the -40s, and just last year it was -38°F on April 3.  The Umiat thermometer notched -50°F on April 5, 1986, and that stands as the latest observed -50°F in the state of Alaska.

And now for an update on sea ice, a follow-up to this post from two months ago.  Bering Sea ice has remained relatively abundant in terms of areal extent, at least compared to the recent history.  Ice extent has mostly been well above last year and it has been far above the extreme lows of a few years ago.


The chart below shows the strong recovery from 2018, with this year's January-March extent reaching 6% above the 1991-2020 median.


The map below shows today's analysis from the NWS.  On the plus side, full ice coverage is found as far south as Saint Paul Island, but on the flip side Norton Sound ice is already in poor shape, with a lot of open water visible on satellite (per Rick Thoman's Twitter comments).


As for other seasonally ice-covered basins of the Northern Hemisphere, the major anomaly has been in the Sea of Okhotsk, where a January-March shortfall of nearly 200,000 km2 (over 20% of normal) has far exceeded the small Bering Sea surplus relative to normal.  The Greenland Sea has also been running a deficit of about the same size as the Bering Sea surplus.


Friday, March 25, 2022

North Slope Cold

For the third year in a row, the North Slope of Alaska has seen a relatively cold winter, i.e colder than in many recent years.  With a week left to go, the November-March period has been the coldest since 2012-2013 in both UtqiaÄ”vik and Umiat.  The deep winter period of December-February was colder two years ago, but that was mostly because of a very cold February 2020.  Interestingly, February has been easily the coldest month of each of the past 3 winters on the North Slope.

This winter the cold was somewhat persistent from mid-November on, and each month from November through February was colder than the 1991-2020 normal (and the 1981-2010 normal) for the North Slope climate division.   This is also true for the Northeast Interior climate division, but nowhere else in Alaska.  However, with significant warmth in early March, it looks a bit unlikely that this month will be the fifth consecutive below-normal month.


In Umiat the number of days (72) reaching -30°F or lower was the highest since 2011-2012, but it only reached -50°F three times (compared to 11 times in Jan-Feb 2020).  UtqiaÄ”vik did not manage to reach -40° after succeeding in the last two winters.

I found myself curious about the correlation between winter temperatures on the North Slope and temperatures elsewhere in Alaska and farther afield, so here's a map.  I've used detrended November-March average temperatures from ERA5, and the map shows the correlation with a grid cell near Umiat.

The interesting aspect of this to me is how the Brooks Range forms such an effective boundary in the temperature anomalies: the correlation between North Slope and interior Alaska winter temperatures is really modest - mostly less than +0.6 (i.e. less than about a third of the variance is joint).  According to ERA5, Umiat winter temperatures are better correlated with temperatures over the central Bering Sea than in Fairbanks or even Fort Yukon.

(Note that I checked the ERA5 data against actual observations from Umiat since 2007, and the performance is surprisingly good: correlation of +0.99.)

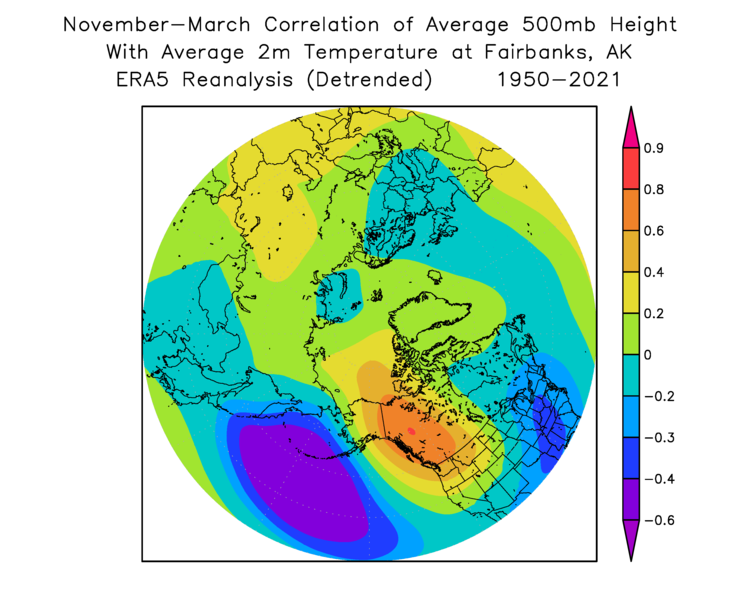
Here's the same correlation map but for Fairbanks winter temperatures: this shows a much more expansive area of high correlation, including across the Alaska Range (much higher elevation than the Brooks Range).

To visualize the flow patterns that have the greatest linear relation to winter temperatures in Umiat, the map below shows the correlation with 500mb height.  A ridge anomaly right over Alaska is favorable for North Slope warmth in winter, but a trough tends to brings cold.  This contrasts with the more expansive (PNA) correlation pattern for Fairbanks - second map below.


For completeness, below are the MSLP correlations.  Interestingly, low pressure over the eastern Bering Sea is closely connected to winter warmth in Fairbanks, but it has the opposite correlation (albeit slight) with Umiat temperatures.


I'd be interested to hear any other observations from readers.

Friday, March 18, 2022

Precipitation Changes

As many readers are aware, it's been an extremely wet winter in western and interior Alaska.  Here are percentile maps for this winter's December-February total precipitation compared to all other years in the ERA5 gridded data (top map) and NCEI's climate division data (bottom map):


The 3-month total was the highest for Dec-Feb across large areas in both data sets, and it was the wettest Dec-Feb period on record for the NCEI state average (data since 1925).

This remarkable outcome reinforces the striking change to wetter conditions in recent years in Fairbanks in particular (where December-February this winter was the wettest since 1936-37).  I've written a number of times about the Fairbanks change that occurred in 2014 - see the blog links at the bottom of this post for a review.

The chart below highlights the change effectively; the 12-month running total precipitation has remained at a high level since that extraordinary summer of 2014 (14.5” of precipitation in June-September, the highest on record).  The longer the sustained wet pattern persists, the more it looks like a true “regime change”, i.e. a new climate normal that has suddenly emerged; but of course 8 years is a relatively short period in climate terms, and it remains to be seen how long the new situation will persist.


The chart above also reveals something else that I find very interesting: the green line shows the 12-month precipitation from days with 0.22” or less of precipitation.  From 1930-2013, such days supplied half of the total precipitation in Fairbanks (but more than half in winter, less than half in summer).  Notice that the running totals from these “lighter” precipitation days have seen only a modest increase – certainly not enough to account for the overall precipitation increase, and not that different from what happened, say, in the mid-late 1940s or around 1990-1993.  Notice too that the “lighter” precipitation totals didn’t rise until the wet autumn of 2017, i.e. more than 3 years after the overall total jumped up.

This means, of course, that a change in "heavier" precipitation days has caused the lion's share of the overall precipitation increase.  This is illustrated in the chart below: in earlier decades, the running totals spiked up occasionally in tandem with the heavier amounts, but the joint increase has been sustained since 2014.  From 2014-2021, the frequency of "heavier" days (0.23" or more) increased by about 50% (while the frequency of much-more-common "lighter" days did not change), and for this 8 year period the heavier days supplied over 60% of the total precipitation.


Another interesting facet of the last 8 years is the changing distribution between summer and winter precipitation.  As noted above, it was the summer of 2014 that kicked it all off, and the next two summers were also very wet; but since then, summer rainfall has been closer to (but still above) prior normals.  The chart below shows how the May-September totals have dropped back somewhat since 2014-2016.


Of course, with less excessive summer rains, cold-season precipitation must have picked up to sustain the very high annual totals, and that's easily seen by inverting the chart columns (and note that the October-April numbers are calendar year totals):


Starting in 2017 - in response to the wet autumn of 2017 - the cold-season precipitation jumped up and has remained high for five years, with 2021 setting a new record.

So it turns out that the sustained nature of the high 12-month totals is related to precipitation increases in both summer and winter, with winters picking up the "slack" from the less-extremely-wet summers of the past five years.

It will be interesting to see where we go from here.  If both summer and winter remain much wetter than earlier decades, then the new regime might be reinforced as both ends of the year make big contributions going forward.  But my suspicion is that decadal-scale changes in the North Pacific are a significant part of the explanation for the new "regime", and in due course we're likely to see a shift to something different.  For example, unusual North Pacific warmth associated with the positive North Pacific Mode emerged in mid-2013 and has been a semi-permanent feature ever since.  I could be wrong, but I doubt that particular spatial pattern of sea surface temperatures will be truly permanent.

Here are some earlier posts on precipitation changes, with a focus on the warm season.  There are probably others I've forgotten about!

https://ak-wx.blogspot.com/2021/05/warm-season-precip-normals.html

https://ak-wx.blogspot.com/2020/08/back-to-rain.html

https://ak-wx.blogspot.com/2020/07/rainfall-trends.html

https://ak-wx.blogspot.com/2020/07/wet-summers.html

https://ak-wx.blogspot.com/2017/07/wetter-in-july.html

Wednesday, March 9, 2022

February Climate Data

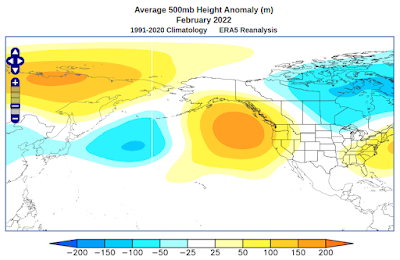
February data are in from the usual sources, so here's a quick look back at an eventful month in Alaska climate.  The circulation pattern was quite unusual, as Alaska found itself caught between two strong ridges - one to the south and southeast over the northeastern Pacific, and another extending from eastern Russia to the Arctic Ocean north of Alaska.


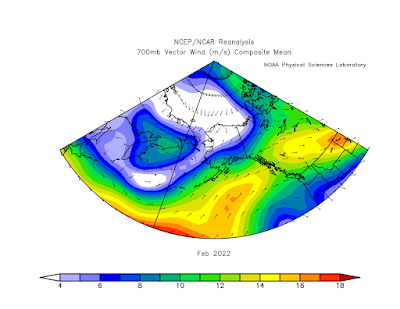
This complex setup had the effect of creating a persistent frontal zone across the southern half of the state.  The trough/ridge dipole over the North Pacific brought up abundant warm air from the south, but the other ridge/trough dipole to the north generated cold northerly flow, with low-level easterlies, that locked in cold conditions over Arctic Alaska.  Here's a map of wind vectors at 700mb, or about 9000 feet above sea level.


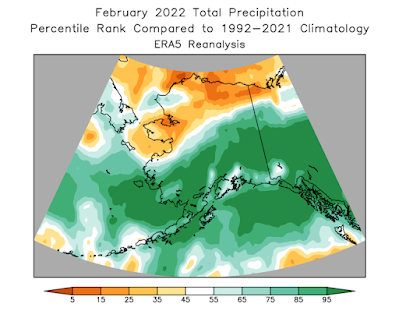
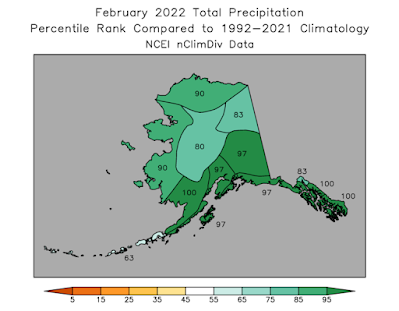
Frontal zones mean precipitation, and there was a lot of it in southern and eastern Alaska.  Total precipitation for the month was near or above the highest in the past 30 years for most of the southern and eastern interior, Gulf Coast, and Southeast.


There's obviously a big disagreement between the ERA5 model data and NOAA's climate division data for the North Slope and northwestern Alaska.  Given how few ground truth snow measurements are made in northern Alaska, I'd actually give more credence to the model.

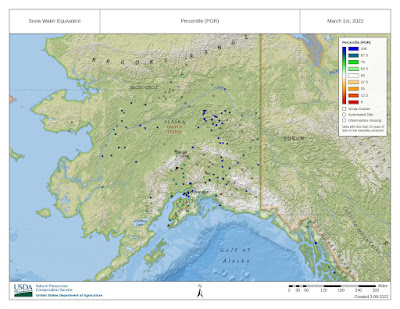
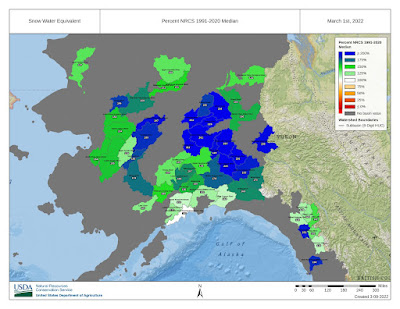
The March 1 snow survey shows record or near-record snow water equivalent across a wide expanse where measurements are made.  There's clearly a much-elevated risk of flooding during breakup this year.  Click to enlarge:


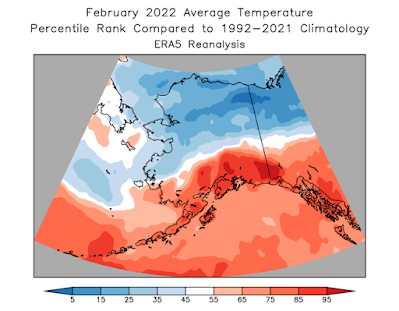
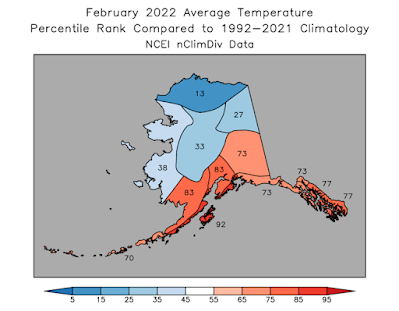
The temperature rank maps below highlight the unusual north-south contrast in the departures from the normal.  As Rick Thoman pointed out, it's much more common to have a west-east gradient in the anomalies.


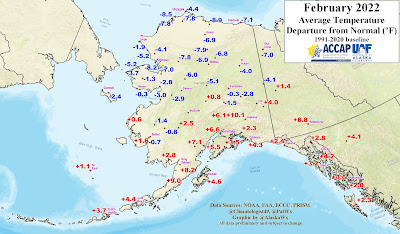
Here's Rick's station anomaly map:


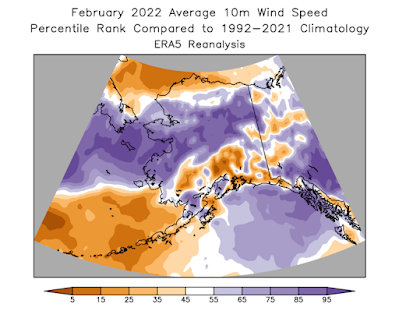
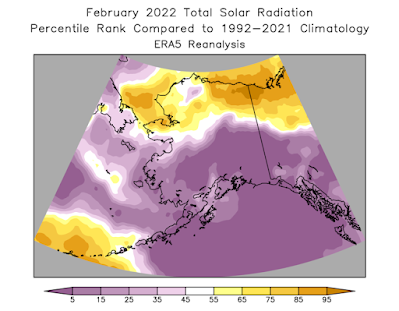
And a couple of other variables from ERA5, showing big departures from normal in many areas: