Friday, May 27, 2022

Radiation Trends

A few weeks ago I wrote about the normal seasonal cycle of infrared radiation that plays such an important role in the climate of Fairbanks (and everywhere else on the planet).  My real goal in looking at the radiation data was to examine the long-term trends: how much has longwave radiation changed in association with the rise in average temperatures?  And are there any notable changes in shortwave (direct solar) radiation?  (Apologies to those who find this an arcane topic, but at least one reader thought the last post was "fascinating"!)

Let's start with shortwave radiation, i.e. sunshine.  Here's a chart of the 12-month running average, both downward (red) and reflected upward (blue), and the net gain at the surface (black).  Recall that we're looking at data from the ERA5 reanalysis: it's a model, not pure observations, but the model is heavily constrained by satellite data and other inputs.


The shortwave annual means tend to jump up and down in summer because that's when solar radiation is by far the greatest; so an unusually sunny or cloudy month in summer can shift the 12-month average quite a bit.

As for trends, there is no significant trend in downward shortwave radiation, but according to ERA5 there is a decreasing trend in the reflected upward shortwave, particularly in the last 15 years or so.  Since 2007, the total upward shortwave radiation has been 7% lower than from 1950-2006.  This is significant, and I'll comment more below.

With incoming sunshine virtually unchanged and a decrease in reflection, the net gain of shortwave energy has increased slightly, but the change is a much smaller fraction of the average gain: only about a 1% increase since 2007 (for example).

How about longwave radiation?  As a reminder, longwave energy fluxes are a lot larger than shortwave, because they occur both day and night.  Longwave radiation is closely linked to average temperature, so it's no surprise to see a clear upward trend in both downward and upward fluxes: see below.  The downward flux is governed by the temperature and humidity of the air, and the upward flux is controlled by the ground temperature.


Notice the big jump in both upward and downward fluxes in 1976, when the Pacific climate regime (PDO phase) suddenly changed and Alaska warmed up dramatically.  Another significant increase in temperature and longwave fluxes has occurred in the past decade.

However, despite highly significant trends in the upward and downward components of longwave radiation, there has been absolutely no trend in the net longwave.  At first glance this is surprising to me: despite a warmer atmosphere aloft, with higher water vapor content and steadily increasing CO2, there has been no net gain in longwave energy at the surface.  This is because surface longwave emissions have increased by just the same amount (due to surface warming).

Let's look at the monthly breakdown of linear trends over the 72-year history of ERA5 data.  Every month has seen an increase in longwave fluxes, with the trends being statistically significant in more than half of the months.  The greatest trend has been seen in December:


The month-to-month variation in trends corresponds to the monthly temperature trends: compare the charts above and below.  For the temperature trends below, I'm showing both ERA5 model data and GHCN station data from Fairbanks, and the agreement is mostly very good.  Curiously, the trends oscillate up and down from one month to the next in the cold season: October, December, February, and April have warmed relatively quickly, but September, November, January, and March have warmed less.
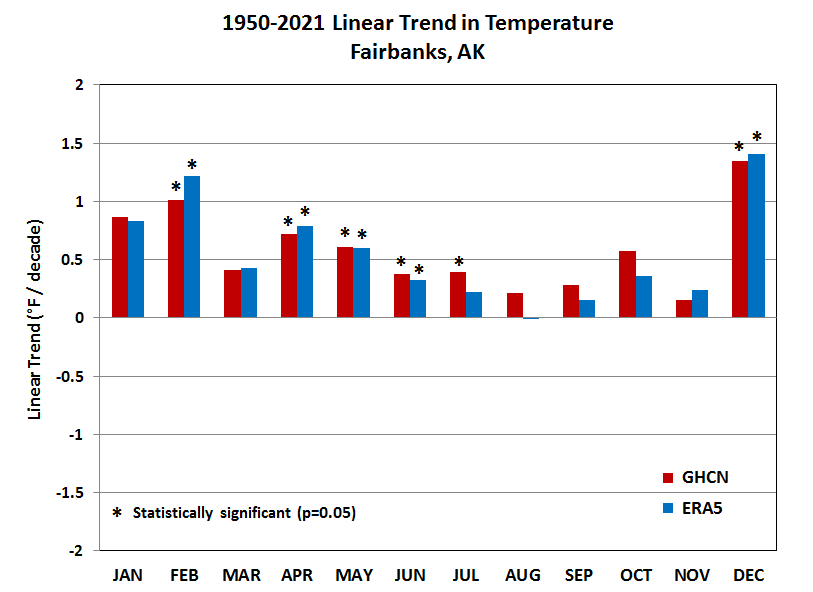

The greatest warming trend has been seen in December, but again there's no change in the net longwave: the upward and downward fluxes vary in lockstep depending on temperature, and the trends are equal.

Interestingly, August stands out as having different longwave trends, with downward longwave having increased much more than upward longwave, and consequently there is actually a statistically significant change in the net longwave for August (the only month for which this is true).  According to ERA5, this has occurred via a significant increase in August cloudiness, so that the surface has failed to warm over the decades (and thus upward emission hasn't increased), while increased temperatures and humidity aloft have produced more downward longwave radiation.

Here are the shortwave monthly trends, with the August change standing out very clearly: August has become considerably more cloudy, at least according to the model.  The loss of direct solar input is larger than the net gain of longwave radiation, so August has seen a net loss of radiative energy, and this is consistent with the relatively small warming trend in that month.


The other month with a big change in the radiation budget over the decades is obviously April.  In this case Fairbanks has seen a statistically significant net gain of energy caused by a decrease in reflected shortwave radiation.  It doesn't take too much thought to figure out why this is: the surface albedo has decreased as long-term warming has shifted snow melt to earlier dates, so that bare trees and bare ground have emerged earlier in recent decades.  This is obviously a positive feedback, as the darker surface means more absorption of shortwave energy and therefore more warming.

The chart below shows the annual variation in the April fluxes: cold Aprils with prolonged snow cover (like 2013) show up with higher upward (reflected) shortwave and lower net shortwave absorption (black line), whereas warm Aprils like 2016 have low reflection and high absorption.


Notice that the April change in surface characteristics also shows up in the longwave trends (reproduced again below for clarity): with the surface warming more than the air aloft, there's been a net loss of longwave energy in April, but this only offsets about a third of the net gain from shortwave absorption.


The April change is easily the most significant shift in the overall radiation budget for Fairbanks, and it accounts for nearly all of the annual net gain in radiative energy at the surface.  In total, the annual surface energy gain (which is positive, as the last post showed) has increased by about 0.4% per decade, and again this is almost entirely because of the large change in April.

I'll stop here and invite comments from interested readers (if there are any).  And for a later follow-up, perhaps I'll look at the spatial distribution of some of these changes across the state.


Wednesday, May 18, 2022

Breakup Progress

River ice breakup has been progressing across the state, and as expected it has been a relatively "dynamic" process with ice jams and flooding in a number of locations (notably McGrath and Manley Hot Springs).  However, it could have been even worse: temperatures have been below normal this month, significantly so at times, and there hasn't been the kind of dramatic warm-up that might have created a more violent collision between rushing meltwater and ice jams.

Here are temperature anomaly plots from (top) Fairbanks and (bottom) the UAF/ACCAP statewide temperature index (click to enlarge).  Every day so far this month has been cooler than normal by both measures.


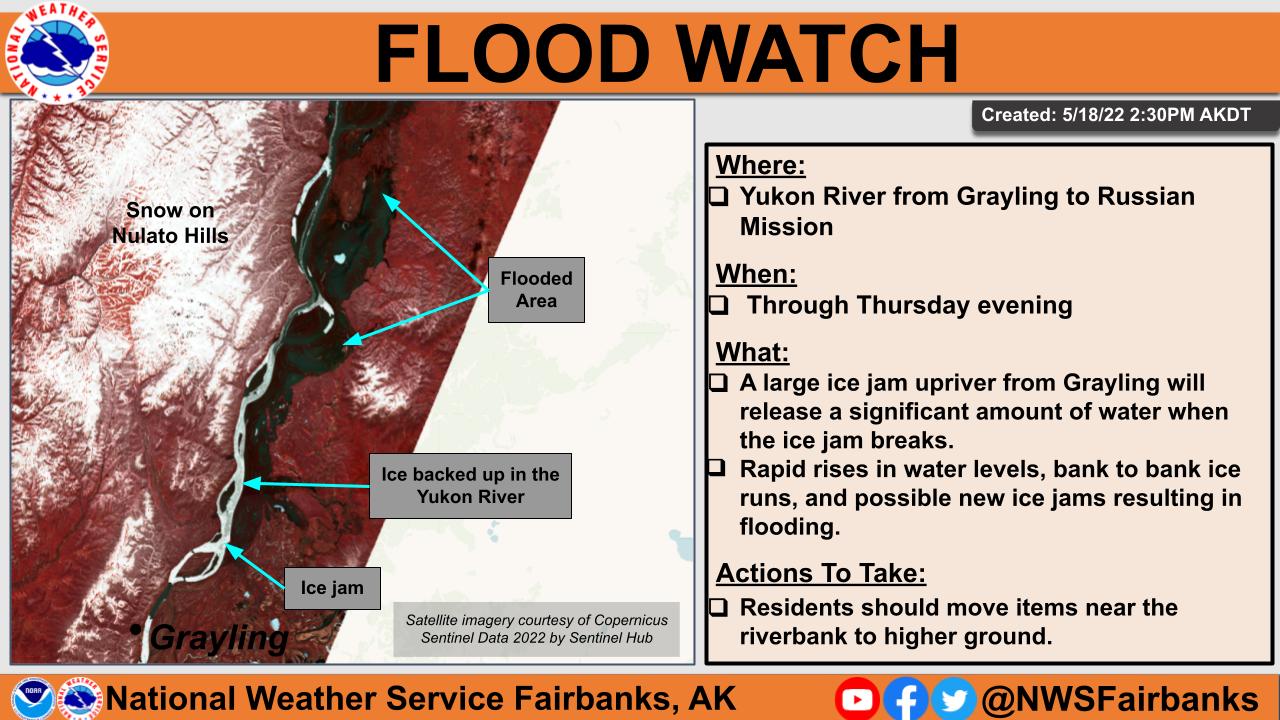
The map below shows the latest breakup situation, with mostly open water now on the major interior rivers.  A major exception is part of the lower Yukon, where flood watches have been hoisted downstream of an ice jam just upriver from Grayling.  Apparently water is so backed up that flooding is occurring for 70 miles upstream of the jam, and when the jam releases there will be a rush of water and ice into communities downstream.


From the NWS river forecast center:

ALASKA SPRING BREAKUP SUMMARY
NWS ALASKA PACIFIC RIVER FORECAST CENTER
ANCHORAGE AK
500 PM AKDT WED MAY 18  2022

..RECENT NOTABLE EVENTS OR FORECAST CHANGES:

Current webcams show the breakup front on the Yukon is right at
Grayling, with ice shifting in the river across from town this
afternoon. Satellite imagery from yesterday showed a very large ice
jam in place 7 miles upstream from Grayling, extending to around 25
miles upstream from the toe of the jam.  This ice jam is causing
water levels to rise overbank and inundate low lying areas nearly 70
miles upstream. Sheet ice is still in place from Grayling down to
Russian Mission. Downriver communities can expect rapid rises in
water levels and heavy runs of ice when this jam releases. Additonal
ice jams could also form as the breakup front pushes into the
stronger sheet ice downstream, thus a flood watch has been issued
for Grayling to Russian Mission. Downstream from Mountain Village
the river was mostly open.

An ice jam released near Old Crow and water levels at the US-Canada
border crested Tuesday.  Rapid rises in water levels along with
heavy runs of ice are expected along the upper Porcupine River.


..SPRING BREAKUP STATUS FOR ALASKA...

Statewide, breakup this year has been largely dynamic with ice jams
observed at Manley Hot Springs, McGrath, Sleetmute, Red Devil,
Crooked Creek, Circle, and Galena so far.  While Manley Hot Springs
and McGrath suffered major flooding, the other ice jams created
minor to moderate flooding due to the cooler than normal
temperatures so far this May.

Breakup is complete on the Kuskowkwim, Koyukuk and Middle and Upper
Yukon Rivers.  The lower Yukon River still has some areas of weak in-
place ice and runs of ice with breakup still continuing on the lower
Yukon River.

The Kobuk, Buckland and rivers north of the Brooks Range are still
ice covered.

Thursday, May 12, 2022

April Climate Data

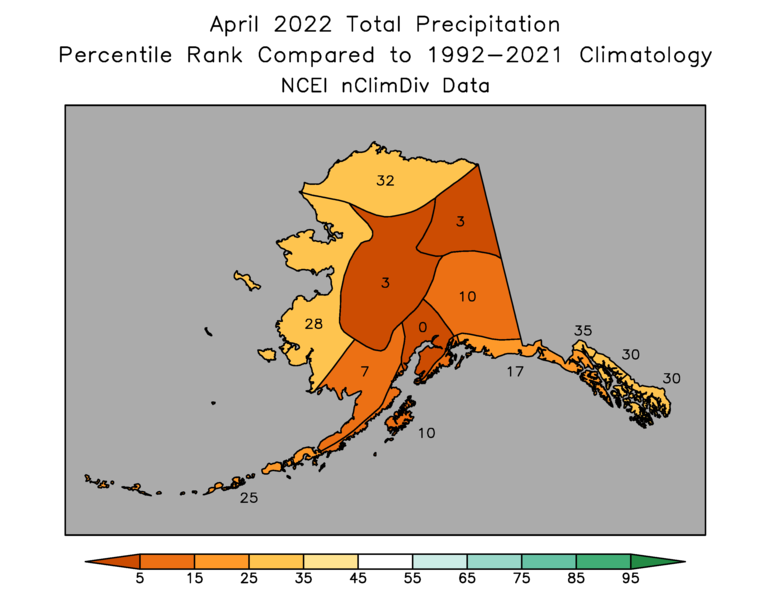
I'm a few days behind on this, but for future reference - here are the NOAA climate division rankings for April in Alaska, expressed in terms of the percentile of each variable within the historical distribution of the prior 30 years.


It was significantly colder than normal in the southeastern interior and southeast Alaska; for example, Northway saw its 3rd coldest April in the past 30 years (coldest since 2013), but April in Fairbanks ended up not being as cold as last year.  Precipitation was very scarce - not an unusual occurrence, given that it's the driest month of the year statewide on average - but this was unusual, with the 4th lowest statewide April precipitation total on record (back to 1925).

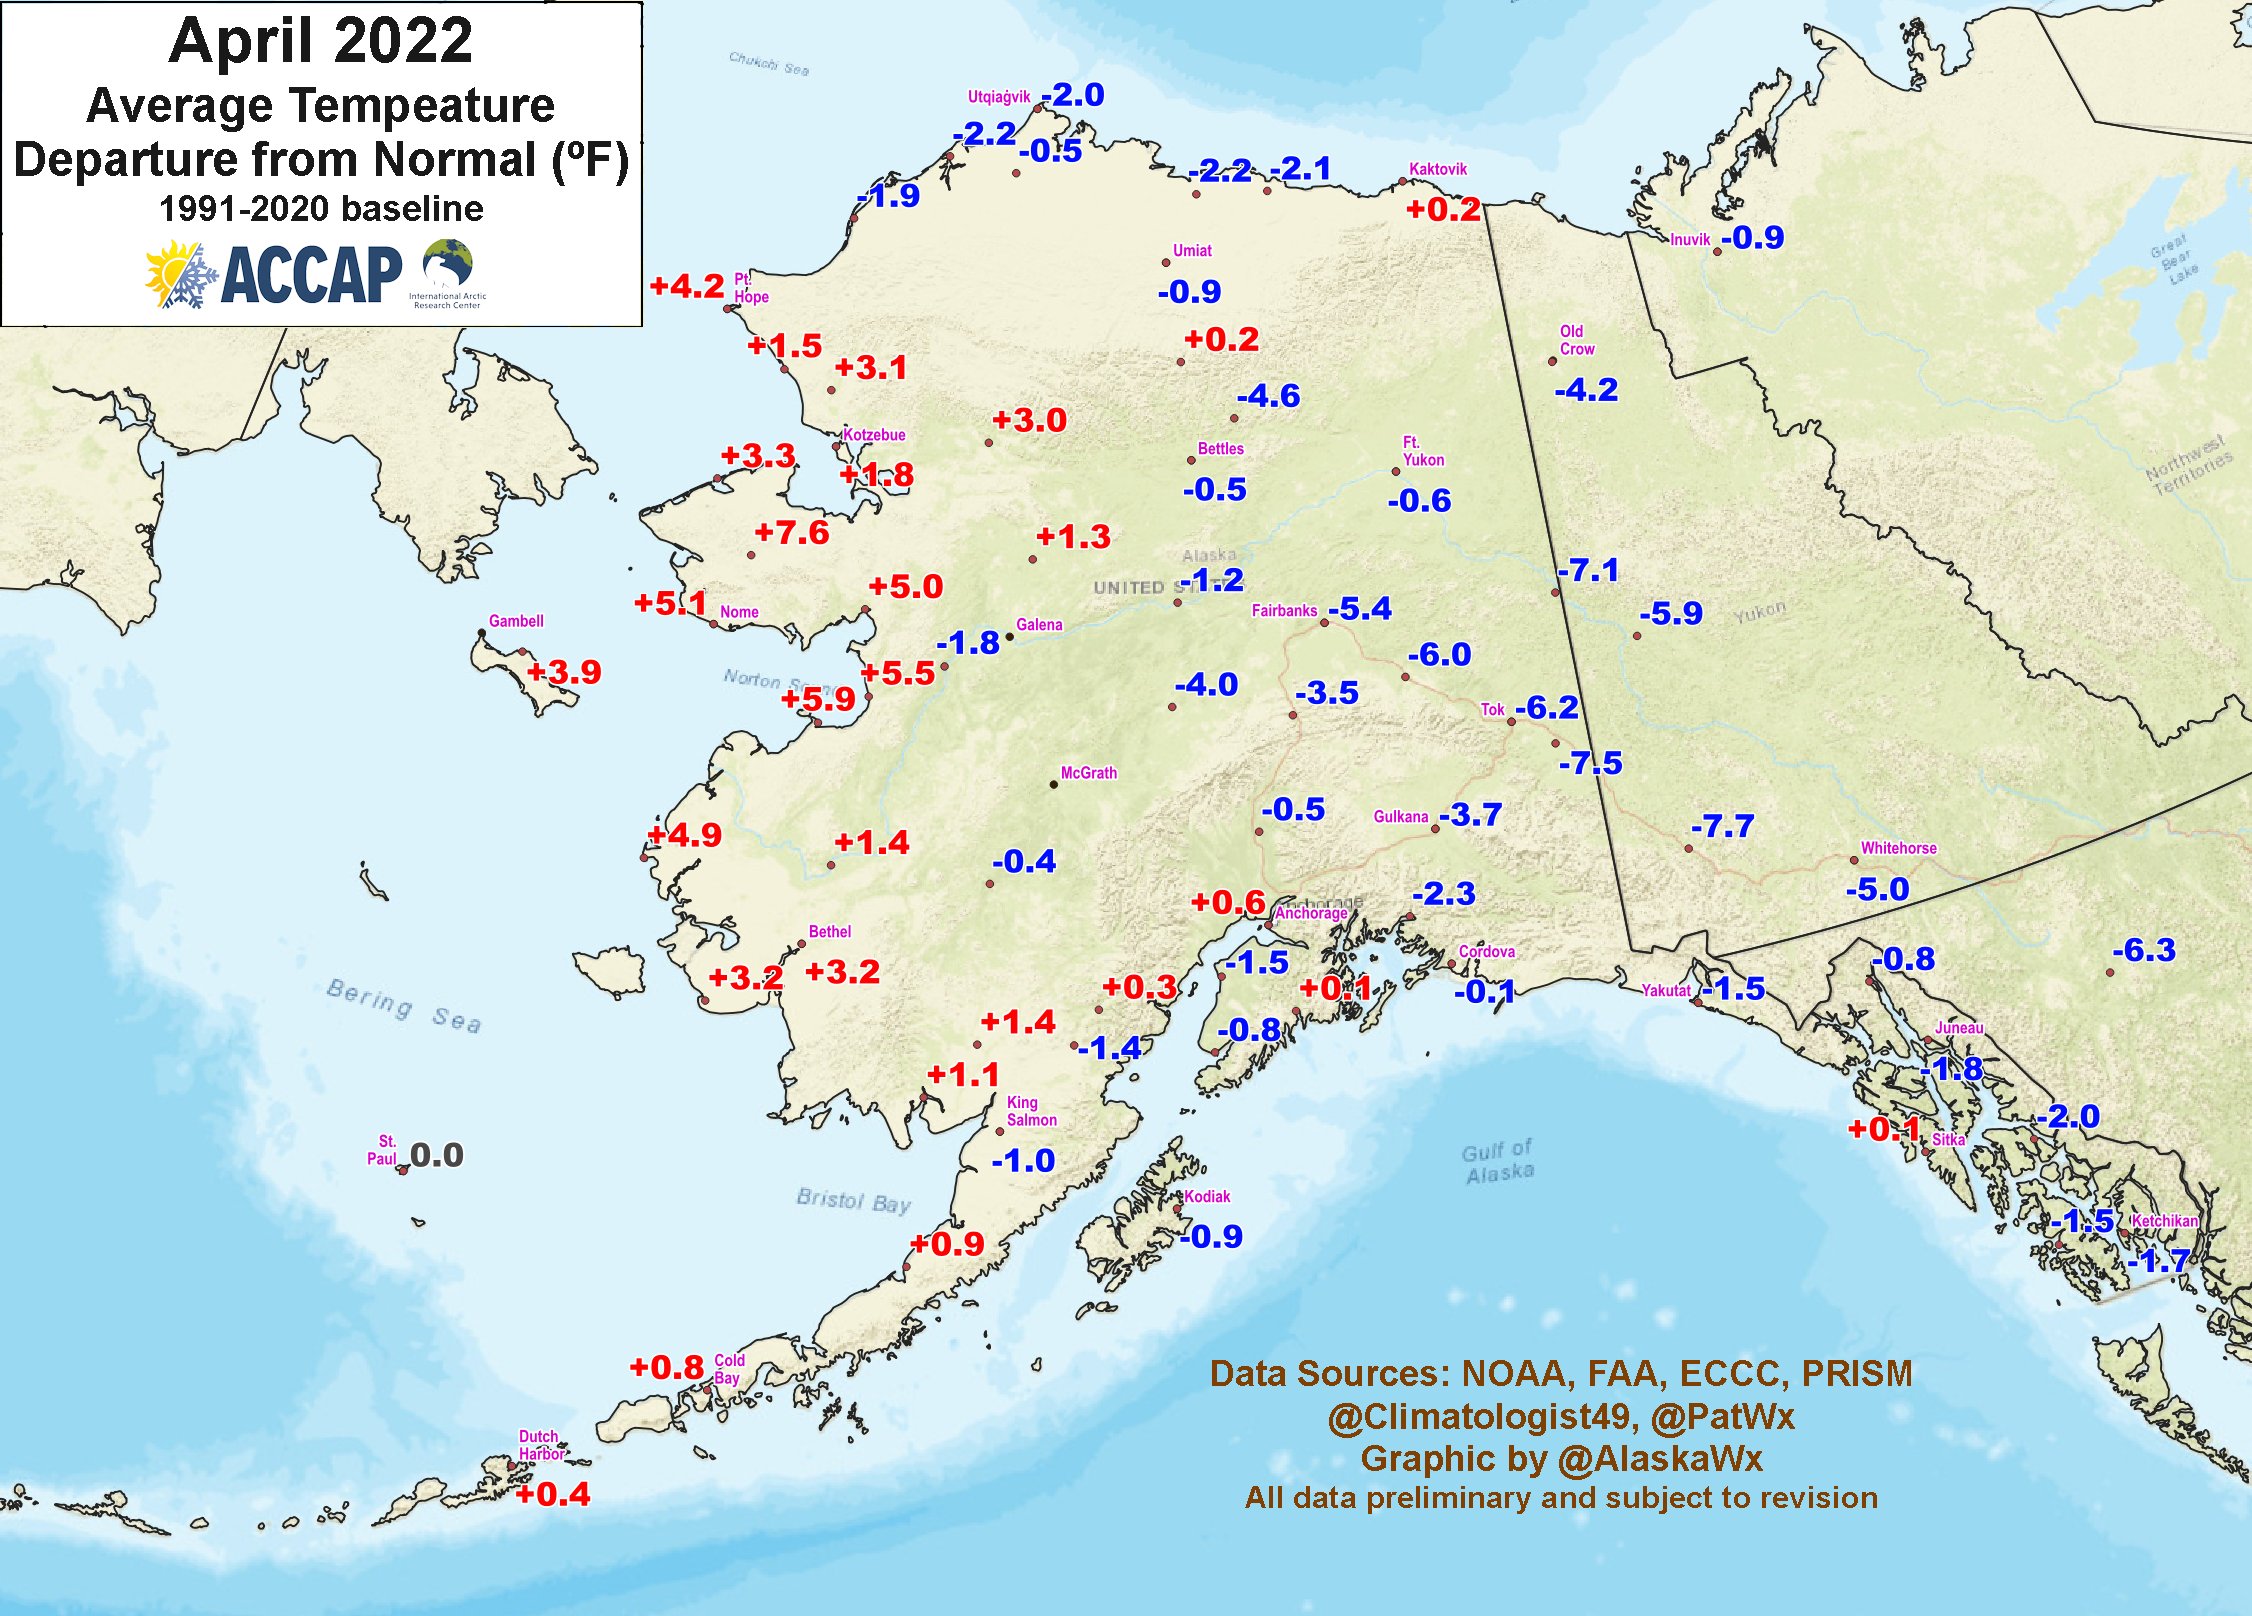
Here's Rick Thoman's temperature plot:


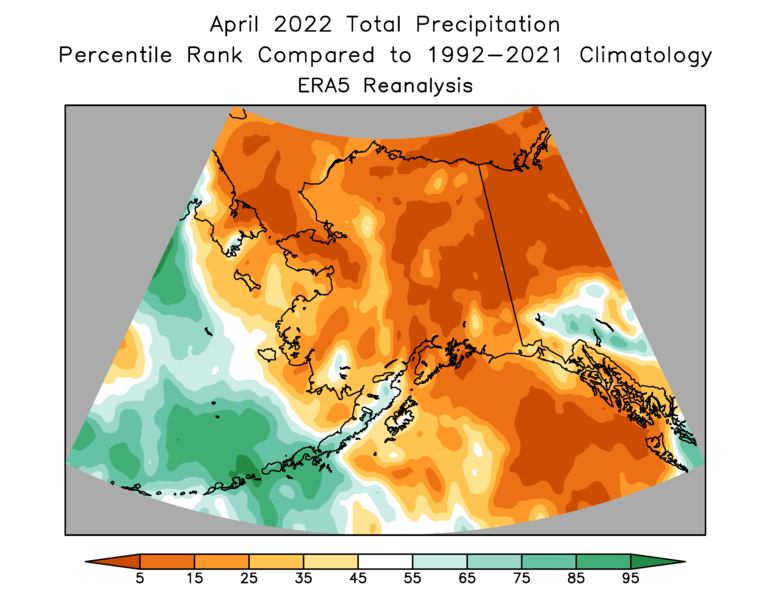
At first glance this suggests that western Alaska had more unusual warmth than indicated by the NOAA data, but note that most of the climate sites with +3-5°F temperature anomalies are right on the Bering Sea coast, where sea ice quickly broke up in April.  ERA5 data (below) supports the idea that really unusual warmth occurred near the coast but not so much inland.


April was another windy month in the northern interior, according to ERA5, and this has been a common theme since November, if the model is to be believed.  ERA5 also shows a wet month in the western Alaska Peninsula, in contrast to the NOAA data.  For what it's worth, Cold Bay has mostly complete data and reported less than normal precipitation for the month; but more work would be needed to comment any further on the discrepancy.


Tuesday, May 10, 2022

New Record Snowpack at Munson Ridge

With a deep trough and cold air aloft, light snow continued on and off last night and for much of today in Fairbanks-land, and it has actually been piling up on the higher hills outside of town.  Remarkably, the SNOTEL instrument on Munson Ridge (3100' elevation) has reported a gain of more than an inch of liquid equivalent in the snowpack, and a 7" increase in snow depth, since Saturday.

The current snow water equivalent of 18.6" is a new all-time record for the Munson Ridge site, with data back to October 1980; the previous record was 18.4" at the start of April 1991.  For the month of May, it's a record by a larger margin (previously 17.1" in early May 2018).


Consider this: the 18.6" of water now on the ground at Munson Ridge is equivalent to the annual precipitation in Fairbanks' wettest year of record (last year, 18.74").  It's all going to be coming downstream in a matter of weeks.

Down at valley-level it has been too warm for additional snow accumulation today, but yesterday's official total of 1.2" is the largest snowfall this late in the season in Fairbanks since 1992.

The number of hours of snow falling is very unusual too: 25 hourly observations reported snow falling (sometimes mixing with rain) yesterday and today, and only 3 other years have managed this feat after the first week of May: 1992 (90 hours), 1964 (44 hours), and 1966 (30 hours after accounting for the 3-hourly spacing of obs at that time).

Here's this morning's 4am AKDT balloon sounding from Fairbanks, showing the steep lapse rate that has made it easy to produce recurring snow showers.

Here's the 500mb analysis from the same time, courtesy of Environment Canada.


Monday, May 9, 2022

Spring Snow

An unusual late spring snowfall is today's story in the central interior, with several inches reported at higher elevations around Fairbanks.  As usual for out-of-season snows, elevation dependence was substantial; Rick Thoman reported 1.7" in South Fox (1000' elevation), but 5" was measured on Keystone Ridge (1600').

Rick also notes that the 4.5" that fell in Denali NP is the greatest this late in the season since the remarkable May snows of 1992 (when over 25" fell there, and 14" in Fairbanks).

Here are a couple of webcam shots from Cleary Summit (2200') above Fairbanks early this morning:

The latest accumulating snow on record in Fairbanks appears to be 1.2" on June 2, 1931, and that was two weeks later than the next latest inch-or-more (May 18, 1943).  However, just a few years ago there was a June 1st snowfall around Salcha and Delta Junction:

https://ak-wx.blogspot.com/2015/06/june-valley-level-snow.html

And just last year Bettles (much farther north of course) saw a couple of inches on May 19:

https://ak-wx.blogspot.com/2021/05/late-snow-in-bettles.html

Spring is something of a fitful and precarious undertaking in interior Alaska.


Tuesday, May 3, 2022

Nenana Tripod Out

Breakup occurred yesterday evening on the Tanana River at Nenana.  This is a couple of days later than the normal of recent decades - no doubt because of the chilly April (5°F below average in Fairbanks) - but it's several days earlier than was typical before about 1990.  Here's Rick Thoman's graphic:


Here's the view at Nenana this morning.


There's little doubt that breakup was brought forward several days by the large volume of water from melting of the deep snowpack upstream from Nenana.  For example, the Little Chena Ridge SNOTEL site (2000' elevation) has lost about half of its deep snowpack in the last 10 days.


Based on April 15 data from 5 SNOTEL sites in the Chena River basin, this year's snowpack water content is the greatest in the past 4 decades.  Looking at Nenana breakup dates since 1982, there is a modest inverse relationship between snowpack water and the amount of warmth needed to cause breakup at Nenana:


Breakup in 2018 and 2020 seemed to be good examples of breakup occurring after relatively little warmth (low thawing degree days) when the snowpack was very deep.  1991 and 1993 don't fit the pattern, but this is almost certainly because April was much warmer in those years - particularly in 1993, which had one of the warmest April's on record, leading to a very early breakup (April 23).  More heat input is required to shift the ice at an early date, because the sun has less time to work on the ice; whereas late breakup tends to occur with lower TDDs because of the long window for increasingly intense solar heat input.  It's a fun multivariate prediction problem.

As for 2002, breakup occurred with both low snowpack and minimal heat input, and that's because it was the wettest April on record, with well over 2" of (mostly) rain in the last week of the month; so the swollen rivers did the job without needing a big snowpack meltout.

Thursday, April 28, 2022

Radiation Normals

Recently I've been taking a look at the (infrared) radiation climate for Fairbanks, based on data from the state-of-the-art ERA5 reanalysis.  I suppose that many people may find it a rather abstract topic, but to me there's nothing more relevant in the world of weather and climate than radiation, and particularly the long-term trends thereof.  After all, solar radiation ("shortwave" radiation) is the fundamental driver of weather, and the imbalance between incoming and outcoming radiation controls weather and climate variations on many time scales.

The chart below shows the monthly normals for the familiar shortwave radiation budget near Fairbanks, according to ERA5.  Solar input (red columns) is close to zero in November through January, it rises quickly in spring under relatively clear skies, and then its decay in autumn is more gradual because increased cloud cover in July and August brings a premature decline (e.g. July has more daylight than May, but much more cloud cover).


The blue columns show the normal upward (reflected) shortwave radiation at ground level, and this peaks in April because most of the month is usually snow covered under relatively strong sunshine.  However, the albedo (i.e. the fraction of incoming solar radiation that's reflected) does drop off markedly in April as snow disappears from trees and eventually from the ground, and it remains near 0.1 until October, when snow cover typically returns.

This much is pretty straightforward to understand.  However, the longwave radiation budget is less intuitive, and in particular it can be a surprise to see that the rate of energy transfer for both incoming and outgoing longwave radiation is much greater than for shortwave - see below.  Probably not many of us would guess that much more radiation is warming us from the sky above than we receive directly in the form of sunshine, even in summer.  Of course this is largely because we're bathed in longwave radiation at all hours of the day and night (emitted by clouds and the atmosphere), with little change from hour to hour, but intense sunshine is confined to only a portion of the day.


But although the incoming longwave is large, the outgoing is even larger at all times of the year, because the ground temperature is higher than the average emitting temperature of the clouds and air above.  The longwave radiation flux is proportional to the fourth power of temperature, so both upward and downward components track very closely with the seasonal temperature cycle.  The only obvious departure from a simple seasonal cycle that I can see is that the downward flux doesn't increase from January to March as quickly as the upward flux, and that's because the surface warms up more quickly than the air aloft (and also because the air stays very dry well into spring - water vapor is very efficient at absorbing and emitting these wavelengths).

So we have a net loss of longwave energy at all seasons, and a net gain of shortwave in all but winter.  What does the overall net look like?


Here we see that there's a net gain of radiative energy from March (barely) through September, and a small loss from October through February; and overall it's a significant gain over the course of a year, which is perhaps a bit surprising at a latitude of nearly 65°N.

Now someone may ask why the temperature in Fairbanks drops so dramatically in the early autumn when there's still a net gain of radiation - even in September, according to ERA5.  The answer is that this radiation budget pertains to the ground surface, not the air above.  The atmosphere doesn't absorb or emit shortwave radiation, so the longwave balance is the only thing at play - and consider that the atmosphere only gains longwave energy from below, while it emits it both downward to the ground and upward to space.  This implies a significant net radiative loss for the atmosphere year-round, and when heat transfer from the surface (by mixing/convection) drops off in the autumn, there's nothing to stop the air from cooling rapidly.

In another post I'll take a look at long-term trends in the different radiation components.

Thursday, April 21, 2022

Breakup Briefing

Here's a link to Tuesday's UAF/ACCAP/NWS river breakup briefing:

https://uaf-accap.org/wp-content/uploads/2022/04/Break-up_2022_Outlook_combined.pdf

The breakup portion starts on Slide 14.  To probably no one's surprise, the key message is, "We expect a dynamic breakup with above average potential for ice jams and flooding."

I thought this was a helpful graphic to explain the difference between dynamic (mechanical) breakup and thermal breakup:


The higher the ice resistance at the point where it is overcome by driving forces, the more "dynamic" the breakup is said to be; at the dynamic extreme, it's a violent process involving what we might call an irresistible force and an immovable object.  At the other end of the spectrum, ice resistance crumbles before the driving force rises a lot, and the whole process is relatively uneventful.  Most breakups occur somewhere in the middle, but this year's abundant snowpack and this month's chilly conditions have tilted the odds significantly towards the dynamic end.

Here's an NWS graphic showing estimated flood potential for settlements across Alaska.  Circle is the only location with a "high" risk rating, with an estimated breakup window of May 9-15.  Note that the risk pertains to both ice jam flooding and snowmelt flooding, with the latter involving the greatest discharge.


Saturday, April 16, 2022

River Ice Wecams

For those interested in breakup progress, here's a nice resource for daily-updated webcam views:

http://fresheyesonice.org/view-data/realtime-data/river-ice-camera/

Yesterday's photos are linked below via Twitter.  There's no significant breakup yet; the ice is getting soft under the sun with warm afternoon temperatures, but nights have been cold.  Fairbanks has yet to see a daily mean temperature above freezing, and this is unusual: in the past 30 years, only 2013 and 2002 had zero thaw degree days by April 15.  Of course 2013 was the coldest April on record in Fairbanks, with a record late breakup at Nenana, and 2002 was also very chilly, with Nenana breakup on May 7.


Saturday, April 9, 2022

March Climate Data

With March climate data now available, here's a look back at the major climate anomalies.  For the month as a whole, the broad circulation pattern around Alaska was quite similar to that of February - compare the two maps below - and most of southern Alaska was again wet, cloudy, and mild.  However, there wasn't enough sustained ridging to the west to keep cold locked in over northern Alaska, and it was easily the warmest month of the winter for the state (and the only month that was significantly above normal statewide).


Here are the temperature and precipitation rank maps from NOAA and ERA5 respectively:


And to confirm the widespread warmth, Rick's ground-truth temperature anomaly map:


Wind and solar:


According to the ERA5 data, it was an unusually windy winter overall from the west coast to the northern interior, but it wasn't Bering Sea storms that produced this anomaly: MSLP was generally higher than normal from the Chukchi Sea to the Gulf of Alaska (see below).  Looking at ASOS wind data from Kaltag as an example, virtually all of the windiest days had winds from the northeast; this is the favored interior wind direction, of course, but it appears the strength of these winds was considerably enhanced by repeated episodes of high pressure to the north and northwest.


Winter temperatures overall were not as low as might be expected during a significant La Niña, and south-central Alaska was actually warmer than normal.


Extremely widespread and very unusual warmth in the northwestern North Pacific may help explain the lack of sustained cold in most of the state despite a negative PDO phase and a circulation pattern (Bering Sea ridge) that was relatively favorable for cold northerly flow.  Sea surface temperatures were far above normal to the south of the Aleutians, and that's a source region for Alaskan air during more southerly episodes such as late February and early March.


Extreme precipitation was the biggest story overall, especially for the interior.  As Rick Thoman pointed out, snowpack water content on April 1 in Tok was nearly 50% higher than the previous record from way back in 1967 - see below.


Click to enlarge the April 1 snowpack map below.  According to NRCS, four subbasins have 250% or more of normal snow water equivalent: Nenana River, Tanana Flats - Tanana River, Healy Lake - Tanana River, and Salcha River.  Meltout and breakup continue to be a very pressing concern in terms of flood risk, especially with the forecast continuing to favor below-normal temperatures this month.