Monday, January 31, 2022

Sea Ice Update

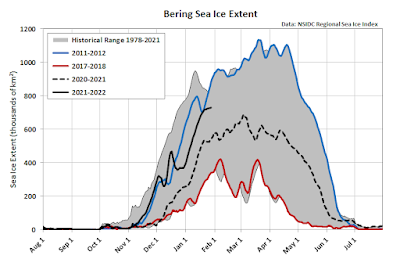
It's high time for an update on sea ice in Alaskan and Arctic waters.  In the Bering Sea, the relatively cold weather of early winter produced a strong start to the ice season in November and early December, and further gains have been seen in January with temperatures closer to normal.  As a consequence, Bering ice extent is considerably above normal for the time of year, although not to the level of the last strongly negative PDO winter of 2011-2012.


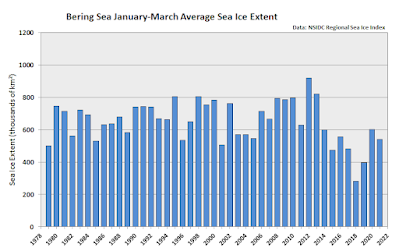
Assuming we don't see an unusual pullback in February and March, it looks like the heart of the ice season (January through March) may see average extent above 600,000 km2, which would be the first time since 2013.  This would mark a further recovery from the lows in 2018 and 2019, as illustrated in the chart below.


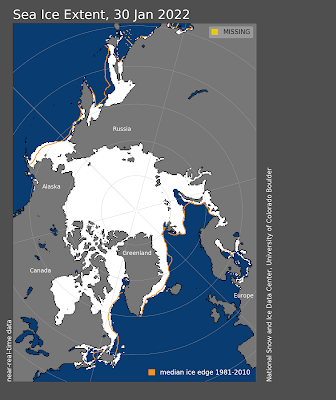
Across the northern hemisphere as a whole, sea ice is also seeing a modest recovery for the time of year, although there are deficits relative to earlier decades in several regions, including - notably - the Sea of Okhotsk, as well as Baffin Bay and southeastern Canada.


Here's a site to bookmark, with a collection of nice graphics as well as data resources:


Sunday, January 23, 2022

Warmest and Wettest in Winter

Today's post is mostly to share some new results pertaining to the Christmas storm, but first a note on recent cold in northwestern Alaska.

Kotzebue reached -40°F or lower on three consecutive days from Tuesday through Thursday last week, with -44°F on the first two nights.  This might not seem too remarkable, but it's the coldest there since February 2012; Kotzebue has had nine straight winters without reaching -40°, and two of them (2013-14 and 2015-16) didn't even reach -30°F.  Prior to 2000, -40° was reached in more than half of all winters.

The recent cold is a brief reprieve from the extraordinary warming that has affected northwestern Alaska in the last decade, particularly in winter.  The change is documented in last year's paper by David Swanson, Pam Sousanes and Ken Hill, as discussed in this post:


And now for some more follow-up on the extreme conditions that occurred in southwestern and interior Alaska just after Christmas.  As a direct result of the extraordinarily powerful ridge to the south of Alaska, incredible warmth and moisture were pumped up into the state.  Rick Thoman highlighted some of the extremes that were observed in the balloon sounding data, such as a freezing level of 9600 feet at Bethel and extremely high precipitable water (i.e. total column water vapor) at Fairbanks.  Many records were broken for the time of year; but how widespread was the record warmth and moisture?

To answer this, I used ERA5 reanalysis data back to 1950 and calculated the area over which the December storm brought the highest 1000-500mb thickness on record for deep winter (December-February).  The 1000-500mb thickness measures the average temperature of the bottom half of the atmosphere, and is an excellent indication of unusual warmth or cold over that deep layer.  Here's the result of the calculation for December 26, when record warmth was most widespread:


The darkest red indicates that the maximum 1000-500mb thickness on December 26 exceeded the peak value observed in December through February prior to this event (by "observed", I mean estimated by the reanalysis, which is very reliable for things like this).  The medium red shading indicates the highest thickness since at least 1979, and the light red shows where the thickness was the highest since at least 2000.

By this objective measure, then, the post-Christmas air mass that reached southwestern Alaska was the warmest on record (1950-present) for the deep winter months of December-February.  As a check on this result, I looked at the sounding data from Cold Bay (data since 1946), and indeed the 1000-500mb thickness on December 26 was well above the previous winter record from, coincidentally, Christmas Eve 1989.  Record warmth did not make it far into the interior, however.  For example, the highest Dec-Feb thickness at Fairbanks still stands, from January 26, 2014.

Here's the sequence of maps showing the extent of record high 1000-500mb thickness by day.


How about deep-layer moisture, i.e. precipitable water?  I did the same analysis using ERA5.  Again the most dramatic extent of record conditions was on December 26, and here records certainly were broken in the interior:


Looking again at Fairbanks sounding data, the December-February precipitable water record was broken by nearly 10%, with the previous record being on February 3, 1982.  Here's the daily sequence of record extent:


It would be interesting to take a look at other reanalysis products that extend farther back in time, including for example January 1937, although of course the uncertainty associated with those earlier estimates is very large indeed because of the lack of upper-air observations.

If readers have suggestions for any other ways to slice and dice the ERA5 data to analyze the recent extremes, I'm all ears.

And by the way, it's worth noting that the extreme cold that developed over the eastern interior at the beginning of this month did not set any records for lowest 1000-500mb thickness; it wasn't even the coldest since 2000, according to ERA5.  The cold outbreak did, however, bring the coldest 850mb temperatures since February 1999 in some areas:


Thursday, January 20, 2022

Follow-Up on Yakutat

A quick follow-up to my last post is in order after some helpful comments from Jim Green (who has an interesting blog post on snow loads here.)  Jim has observed a large shortfall in reported precipitation at the Haines ASOS, and he proposes a similar deficiency in the data from Yakutat.  I think this is a highly credible suggestion given Jim's information, as well as data from the Yakutat CRN site.

I'm not sure why I didn't check this before, but indeed the Yakutat CRN - which is located right next to the airport - reported much more precipitation in November and December than the ASOS instrument.  See below (but the CRN has missing data since January 6).


From November 10 through January 5, the CRN reported over 3.5" (32%) more precipitation than the ASOS, and if we apply this ratio to my earlier estimates, we arrive at perhaps 150" of snow, instead of 100-120".

Jim also points out the following photo from January 11, the day Yakutat declared their emergency.  The snow depth appears to be at least 60", which is consistent with well over 100" of total snowfall.  And if Jim's snow density measurement applies here, then Yakutat's snow pack may have had at least 18" of liquid-equivalent stored in it; this suggests that perhaps even the CRN was reporting too little precipitation.  Snow water storage of 18" translates into nearly 100 lbs of snow load per square foot.


As an aside, I compared November-December precipitation totals between the Yakutat CRN and ASOS, and in the 3 years with complete data, the CRN reported 12%, 33%, and 30% more than the ASOS.  So it appears this is not a new problem with winter precipitation amounts, even in more typically rainy years.

Friday, January 14, 2022

What's Going On In Yakutat?

Weather continues to be in the headlines in Alaska, with the town of Yakutat declaring a "local disaster emergency" on Tuesday because of excessive snow loads that have caused significant damage.  There's been similar trouble in Juneau, with at least two commercial building collapsing earlier this week, and the governor issued a disaster declaration yesterday.

https://www.adn.com/alaska-news/2022/01/13/governor-declares-disaster-for-parts-of-southeast-alaska-hit-by-major-winter-storm/

https://www.alaskapublic.org/2022/01/12/yakutat-declares-state-of-emergency-after-cold-snap-hits-southeast-alaska/


The photos in the second news link above appear to show a snow depth of at least several feet in Yakutat, but I'm not aware of any actual measurements of the current snow pack or how much snow has fallen so far this winter.  Regrettably, Yakutat's airport climate data hasn't included snowfall since the winter of 2017-2018, and there are no other observing platforms (e.g. Snotel) in the area.  The daily climate data only include liquid-equivalent precipitation, and actually this has been far below normal for the time of year - see below.  Yakutat is an extremely wet place in winter, but typically it's mostly rain.


But let's not allow the lack of snow measurements to get in the way of a bit of science.  We do still have hourly ASOS reports from Yakutat, and these include weather type, such as "snow", "rain", "fog", etc, and also hourly liquid-equivalent precipitation.  So I went back through the history to 1973 and calculated the fraction of the November 10 - January 10 precipitation that fell in hours when snow was reported as the weather type.  Of course many hours have both snow and rain reported, so I excluded those hours.  The November 10 - January 10 window corresponds roughly to the period when accumulating snow seems to have occurred in Yakutat so far this winter, judging from temperatures.


I then applied the "snow fraction" to the total precipitation from the daily climate data, resulting in an estimate for snow liquid equivalent each year.  Comparing these estimates to the actual snow data that ended in 2017, we see a pretty good relationship (R=0.89) between measured snowfall and estimated snow liquid equivalent.


Remarkably, this year's snow liquid equivalent (estimated) is 10.4", which is the third highest since 1973 despite total precipitation being the lowest since 1990 for this two-month window!  Using the simple linear regression, we can estimate about 100-120" in total snowfall.

While this is a lot of snow, it's unlikely to have been a record for total snowfall in the two-month window, let alone a full winter; Yakutat has seen well over 300" of snow in a winter before (most recently 2011-12).  However, the key issue is of course how much melts in between fresh accumulations.  Looking at thaw degree days (accumulation of daily mean temperatures above freezing) since November 10, the past two months have been so cold that there has been very little melting in Yakutat; total TDDs were the third lowest on record for the date window.

The following chart summarizes the situation: a lot of snow has fallen (judging from hourly data), and very little melting has occurred.  The combination appears to be unprecedented in recent decades, as the only other years with a lot of snow also had much more meltout.

While this simple analysis provides quite a pleasing explanation for the recent difficulties in Yakutat, a couple of puzzling aspects remain.  If we go back to earlier decades in the climate history, there are a number of years when similar or greater amounts of snow fell in a two-month window with just as little melting; for example, December 1971 - January 1972 saw 138" of snow (and over 18" of liquid equivalent) with very little meltout.  January-February 1988 produced 118" of snow with cold conditions.

We also have the fact that the reported snow depth was as high as 96" in March 2012, and it's difficult to imagine that today's snow load is greater than it was at the end of that epic winter.  But perhaps it is, with the very heavy snow and rain earlier this week pushing it over the edge.  Without ground-truth data, we'll never know for sure.


Monday, January 10, 2022

December Anomalies

Monthly data for December are finally in, so here's a quick look back at that outstandingly unusual month in Alaska climate.

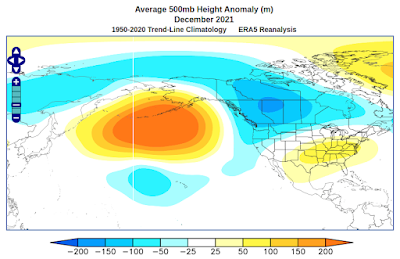
Large departures from normal were driven by an extremely strong ridge centered just to the south of the Aleutians, combined with a strong and persistent trough downstream over western Canada.  This atmospheric pattern reflects a strongly negative phase of the "Pacific/North American pattern", which is correlated with the (oceanic) PDO index in winter - i.e. a negative PNA pattern is more likely when the PDO phase is negative, as it is at present.  The PNA index was negative every day of the month, reached its most negative extreme around Christmas, and produced the most negative December index value on record (1950-present).


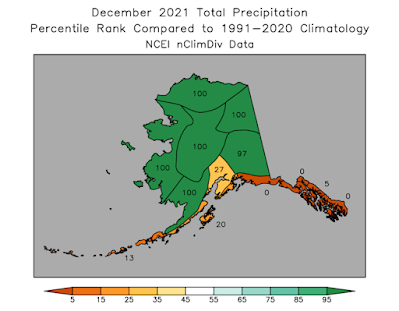
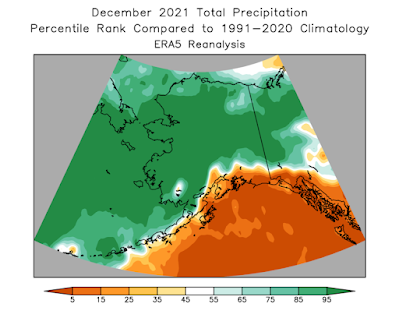
The effect of the intense and sustained North Pacific ridge was to draw up warm, moist air from the southwest and dump copious precipitation over western, northern, and interior Alaska.  NOAA climate division data and ERA5 model data agree that the month was wetter than any other December in the past 30 years over most of the state to the north or west of the Alaska Range.  But in stark contrast, it was much drier than normal along the Gulf of Alaska coastline, as the usual Gulf storminess was greatly suppressed.


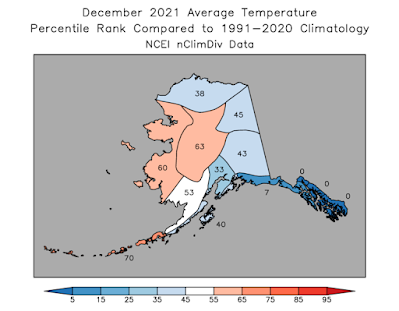
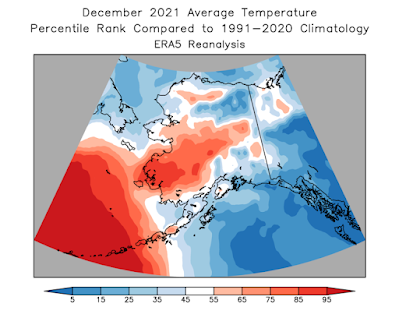
Temperatures were higher than normal in the western interior and Y-K Delta region, but much colder than normal in southeastern Alaska.


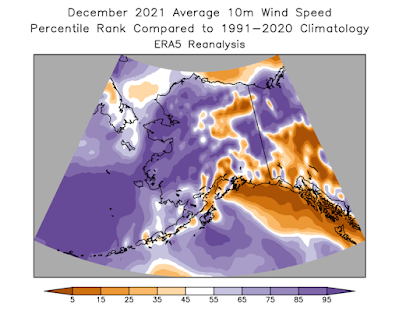
Winds were much stronger than normal over western Alaska and a good part of the interior, but well below normal along the eastern Gulf Coast.


Here are a few tweets from Rick Thoman, highlighting nicely the astonishing precipitation anomalies that will long be remembered.


And one more to summarize:


Tuesday, January 4, 2022

Mat-Su Wind Storm

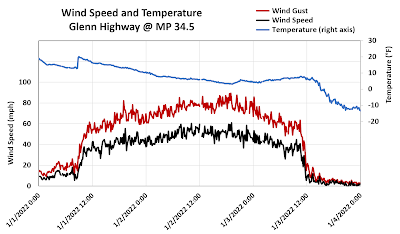
Extreme weather continues to bring major headaches - and worse - for parts of Alaska.  With intense cold over the northern and eastern interior, a tremendous north-south pressure difference generated a damaging, long-duration wind storm in south-central Alaska over the past few days.  Here's a chart of wind and temperature between Palmer and Wasilla, showing wind gusts over 50mph persisting for a full 48 hours.  The temperature dropped to near 0°F at the height of the wind storm on Sunday evening.


Here's one of many news articles:

And another: the local impacts have been severe.


The surface analysis map from 3pm Sunday, courtesy of Environment Canada, shows the intense pressure gradient responsible for the winds: note the 1054mb high over northern Alaska and the sprawling ~980mb low in the Gulf of Alaska.


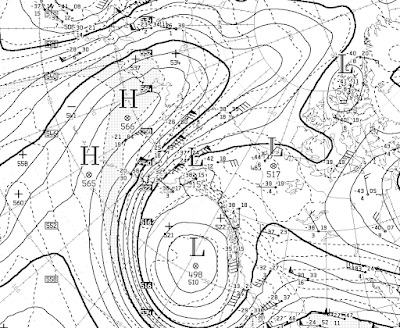
Here's the 500mb height map for the same time.  Now that's an amplified flow pattern!


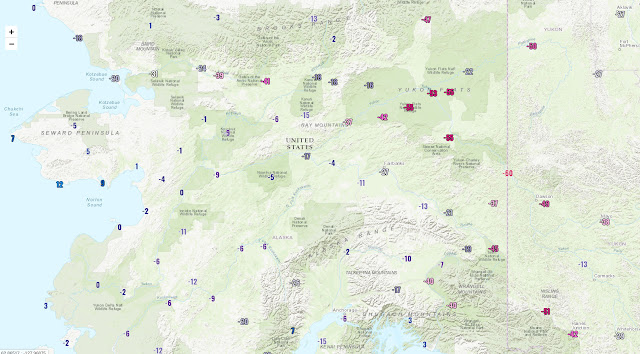
Temperatures have plummeted to extreme lows in the Yukon Flats and the far eastern interior, with Eagle so far the coldest at -59°F today (the -60°F on the map below is a rounding error).  Colder still may occur in the Fortymile country and upper Tanana valley in the next couple of days.


Saturday, January 1, 2022

Cold

It's a cold start to the new year in Fairbanks-land, with an air mass moving through that's worthy of this blog's name, i.e. deep cold.  Temperatures are lower in the hills than at valley level, with nasty wind chills. 

Here are noon temperatures around the area (click to enlarge):


The 3am sounding from Fairbanks reported an 850mb temperature of -28°C or -18°F, but it's closer to -25°F now.


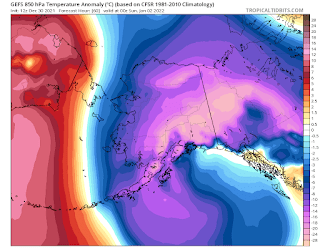
After noting on Thursday the rather extreme cold in the forecast, I did a comparison between the latest GEFS 850mb temperature forecast and the minimum that has been observed in recent decades, based on ERA5 data (1950-present).  It turns out that the predicted 850mb temperatures over the southeastern interior have not occurred since before 2000 (light blue shading in the figure below), and in a few spots not since before 1979 (medium blue shading).


Of course, the comparison may be hampered by systematic bias between the GEFS and ERA5 temperatures, especially over or near high terrain, so we'll have to wait a few days to get the self-consistent ERA5 analysis after the event.

Here's an animation through Tuesday morning.


Thursday, December 30, 2021

How Cold Will It Get?

Given the magnitude of recent extremes in Alaska, it only makes sense that the upcoming cold will also be quite extreme.  The dramatic change will occur as the big North Pacific ridge builds north over the Bering Sea and into the Arctic, so that much of Alaska will soon find itself on the opposite side as far as temperatures are concerned.  Here's the 500mb height forecast for Monday morning, with color shading indicating the departure from normal.


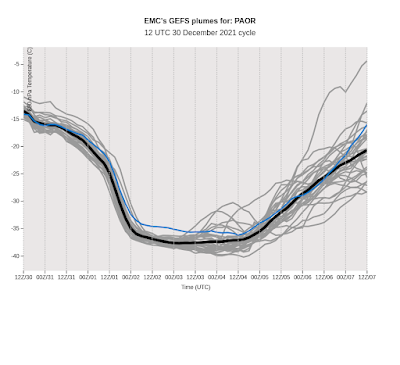
By late Saturday, a very cold air mass will be centered over the southeastern interior, with predicted 850mb temperatures below -35°C.  That's seriously cold.


An 850mb temperature of -35°C hasn't been observed in Fairbanks since 1999, although late January 2012 came very close.  However, it looks like the core of the cold will miss Fairbanks, so -30°C or so seems more likely on the Fairbanks sounding.

Cold at valley-level will be severe, but just how bad will depend on winds and cloud cover, as usual.  Widespread -40s seem likely, and given the location of the cold core I wouldn't be at all surprised to see -60°F at Chicken.  The last -65°F at Chicken was in 2009.

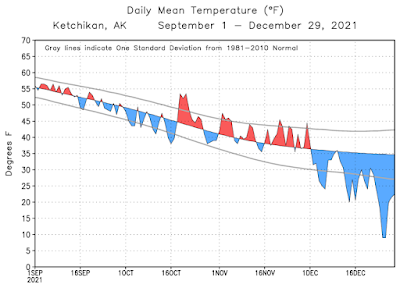
Speaking of cold, it's worth noting that southeastern Alaska has already been experiencing the cold side of the flow pattern in recent weeks, even while extraordinary warmth has occurred elsewhere in the state.  Ketchikan dropped to 0°F and saw two back-to-back days with high temperatures below 20°F; both of these feats were last achieved in 2012. 


Wednesday, December 29, 2021

More Wild Weather

Another day, another climate headline: 2021 is now the wettest year on record in Fairbanks.  Rick Thoman illustrates the remarkable increase since 2013:


A leading hypothesis for explaining the change has to be the sustained tendency for North Pacific high pressure, which is linked to unusual sea surface warmth (recall the so-called "blob" of warmth dating back to winter 2013-2014).  As discussed in recent days, an intense North Pacific ridge is to blame for the current onslaught of wild weather; here's a nice animation courtesy of Stu Ostro at the Weather Channel:


Last night's winter storm in Fairbanks ended with a remarkable and extremely unusual snow squall this morning: heavy snow, near-zero visibility, and winds gusting to 45 mph.


For posterity, here's the airport METAR at the height of the squall:

PAFA 291653Z 28024G39KT 1/4SM R02L/1200V2600FT +SN BLSN FG VV004 M01/M03 A2956 RMK AO2 PK WND 28039/1645 SLP020 P0003 T10061033 $

Heavy wind-driven snow like this is virtually unheard-of in Fairbanks, and I found only a tiny number of past cases when conditions may have been similar.  In fact there are zero previous observations with a combination of moderate or heavy snow, visibility of 1/4 mile or less, and sustained winds of 20 knots or greater; but Rick pointed out that in earlier decades the observer may have just reported "blowing snow".  Even then, the only dates that may have been similar are the following:

March 28, 1948

Dec 28, 1951

March 10, 1963

Feb 26, 2011

Here's one of Rick's comments in the aftermath of the 2011 event: "February 2011 will be long remembered in the annals of Fairbanks weather lore, with back to back storms that are close to "blizzards" as Fairbanks ever gets (which is to say, not that close)."

https://ak-wx.blogspot.com/2011/03/february.html


Tuesday, December 28, 2021

Storm Follow-Up

As if to add insult to injury, freezing drizzle is being reported around the Fairbanks area today, following a modest snowfall earlier in the day.  A vertical profile from this morning's GFS model run, valid at 9am, shows a cloud-top temperature of about -14°C, which is a bit colder than you would expect for freezing drizzle, but presumably in reality the cloud top is a bit lower and warmer than that.  See here for an old post on freezing drizzle.


A big portion of the interior is under a Winter Storm Warning again, and the latest available GEFS forecast shows the potential for an inch or more of additional liquid-equivalent precipitation in total with this latest event.
Then it will get cold.  The lowest 850mb temperature in Fairbanks back in November was -28°C, and it appears that this weekend may rival that.  There's certainly the potential for -40° again at valley level.

Meanwhile, extremely warm - and in some places absurdly warm - conditions are persisting in southwestern Alaska, as the powerful North Pacific ridge continues to pump warm air up from the south.  This is the 12th consecutive day that Bethel has seen 32°F or higher, which seems like a prolonged warm spell, but the record is 26 consecutive days in - no surprise - January 1937.

The turn-around from the November cold is really striking:


I can't fail to mention also the ridiculous warm record that was broken in Kodiak on Sunday: 65°F at the airport (the official climate site) and 67°F at the harbor tide gauge.  This is a new record for the entire state of Alaska in the month of December.  Astonishingly, a temperature of 65°F or higher has not previously been seen in Kodiak between early October and late April, i.e. more than 6 months of the year.  On that basis, it would be the equivalent of Fairbanks reaching nearly 70°F at this time of year. (Note that there is Kodiak data from January 1937, but the best Kodiak could do then was 50°F).  

What could explain such a dramatic shift from the cold of November to the extreme warmth this month?  Obviously it's tied to the position of the North Pacific ridge, but why did it shift east?

To illustrate the shift, here's a time-longitude diagram showing the recent and forecast evolution of 500mb heights in the 45-75°N latitude band.  During November we can see yellow/orange colors (ridging) to the west of Alaska and a preponderance of blue (troughing) at the longitude of Alaska, and this was the pattern that produced the cold.  However, beginning about 10 days ago, a very powerful ridge emerged to the east of the Date Line, and it has been holding steady with remarkable persistence (and may generally continue to do so, if this forecast is correct).


Now here's what I think forced the transition to a more easterly ridge: an eastward shift in tropical convection (thunderstorm activity) in early December.  The graphic below shows areas of enhanced convection along the equator in blue and suppressed convection in yellow, and in the first half of November we see that convection was focused from the eastern Indian Ocean to Indonesia.  However, at the beginning of December the convection migrated into the western Pacific Ocean, and this represents a breakdown in the typical La Niña pattern over the equatorial ocean.  As I discussed in this post, the typical cold of a La Niña winter in Alaska is linked to the position of the convective activity, and so it makes sense that the North Pacific pattern would shift in the weeks following the tropical change.  This also means that if the La Niña forcing doesn't re-emerge, then sustained cold may be less likely in the rest of winter.


For the technically inclined, the eastward shift in tropical convection was brought about by a strong eastward-propagating pulse of the Madden-Julian Oscillation (MJO); see here for an introduction to the MJO.  The phase diagram below demonstrates the change of phase from November (green) to December (blue), with the key transition occurring around December 1, as noted above.  If the MJO activity eventually makes it back to the lower part of the diagram, then it may again reinforce La Niña-like patterns over the North Pacific, but this appears unlikely to happen before late January.