Tuesday, April 25, 2023

Cold

It's a good thing this didn't happen in winter - unless extreme cold is your sort of thing.  Rick Thoman has posted comments on the latest cold blast, which for some places brought the coldest daytime temperatures on record for this late in the season.

https://alaskaclimate.substack.com/p/extreme-april-coldagain

In Fairbanks, Sunday's high temperature of only 17°F was a daily record, but the early May cold of 1945 and 1964 was more extreme: May 8 and May 9 of 1964 saw a high of only 19°F.

Here's a figure showing the coldest on record in Fairbanks for "this late in the season", both for daily high and daily low temperatures.  For instance, the record coldest for late April or later is given by the 1945 record of 17°F on May 2 (not Sunday's 17°F, as that fell on an earlier date).


2021 and 2013 both show up on the chart, along with 1964 of course (but I didn't label all the years).  The two most anomalous events seem to be the -20°F high temperature on March 29, 1944 (no high temperature below zero has ever occurred after March 31), and the -1°F low temperature on May 9, 1964 (no low temperature below 20°F has ever occurred after May 11).

(Note that I'm only using data from the NWS/Weather Bureau era of 1930-present.)

Saturday, April 22, 2023

Breakup Postponed

Those of us who guessed on the early side for breakup at Nenana are out of luck this year, as the scene is still quite wintry, and fresh cold moved in this morning - with notable wind I might add.  Here's the webcam view at Nenana this morning.


Winds gusted to 35mph in Fairbanks, from a direction just east of due north.  Here are the max gusts since midnight:


So far Fairbanks has seen a grand total of 6 "thaw degree days" this year, which is the accumulation of daily mean temperatures above freezing (e.g. a daily mean temperature of 40°F supplies 8 TDDs).  This amounts to the 8th lowest on record through April 21.

But if we assume the 7-day NWS forecast is correct, then this year will move up to 5th place in the next week.  This all but guarantees a later breakup than normal at Nenana: normal for recent decades is April 30, and the top 35 years for lowest TDDs through April 28 all saw breakup in May (without exception).

Of course the sensitivity of breakup date to temperature increases more and more rapidly as normal temperatures rise, and as the sun gets stronger by the day; so it would take an increasingly unusual level of cold to push the breakup date towards mid-May.  Given the current situation and the latest forecasts, I think it's unlikely to happen before May 7, but May 10 may be near the mark.

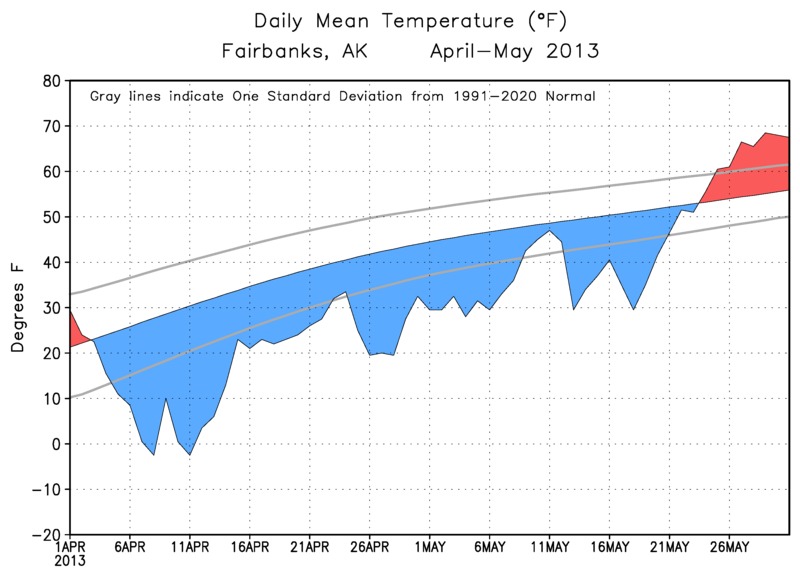
The chance of approaching the 1964/2013 record of May 20 is still remote, but just for fun, here's a comparison of this year's temperature trace - including the NWS forecast - with those years.  Even with the fresh cold arriving today, it's unlikely that this month will equal April 2013 for overall cold, and in that year the cold was relentless into May.  As for 1964, April wasn't even in the top 10 for cold, but then the cold was incredibly extreme in May.


Wednesday, April 19, 2023

Cold Days in Context

The cold spell is relaxing its grip for many areas today, with temperatures rising widely above freezing; but thermometers in the interior will reverse course this weekend as another very cold air mass drops in from the northeast.

It's useful to view the recent spate of significant cold days in the context of the last decade.  For example, here's a chart showing the monthly number of days with a mean temperature at least 2 standard deviations above or below normal in Fairbanks.  I've used the 1981-2010 normal as the baseline, because it predates the period shown here.


The dramatic flip from cold to warm in spring 2013 is the standout feature; it really was a most remarkable sequence of events.  Following that reversal, warm days were favored quite heavily through 2019, but since then there's been a more even split in the frequency of very warm and very cold days (relative to the time of year).  April 2021 and now April 2023 stand out as the most unusual calendar months of recent years; but the current cold spell has a long way to go to equal the April-May 2013 cold.

How about Nome, which tied its April record for cold earlier this month?  In this case the prevalence of warmth was overwhelming from 2014 through 2020, with not a single 2SD cold day for more than six years.  Ordinarily, of course, +/- 2SD days would occur about 5% of the time (combined) for a Gaussian distribution (but in fact temperatures are quite significantly non-Gaussian).  But now April 2023 has the most cold days of any month since the notorious September of 1992.

The chart for Bethel looks quite similar, although there was more significant cold there in 2011 through May 2013.  Early summer of last year saw extraordinary heat, leading to very bad fire activity for the Y-K Delta region.

As for Anchorage, warmth in 2018 and 2019 was extreme, and even though this month has been quite wintry, the cold hasn't been significant enough to show up on this chart.


Juneau saw more frequent cold days in 2020 and 2021, and that can be attributed to La Niña and the negative PDO phase; but there was a lot of warmth last year despite those bigger climate anomalies persisting.


Finally, we see the unending warmth of Utqiaġvik, with a mere 3 days of 2SD cold in the past 12 years.  This month's cold isn't registering on the chart at all, and just last month there were 7 days of 2SD warmth relative to the 1981-2010 baseline.


Friday, April 14, 2023

A Belated Extreme

While the cold snap this month has been most pronounced and unusual for western Alaska, it's been very chilly in Fairbanks too.  On Monday and Tuesday of this week the daily mean temperature was only 1.5°F, which is nearly 3 standard deviations below normal - a very unusual event.

Here's an interesting statistic: the week ending yesterday in Fairbanks saw the largest departure from normal of any 7-day period in the entire winter, and that's quite remarkable given that temperature variability typically drops off a lot by April.  The week ending December 22 was a close second for largest departure from normal.


However, this cold spell still pales in comparison to the 2021 cold snap, when Fairbanks had a daily mean temperature of -12°F on April 9 (41°F below normal, or nearly 4 SD below normal).


Rick Thoman penned a summary of the cold spell as of Wednesday, noting that the recurrence of severe April cold in recent years is starting to become a bit intriguing:

https://alaskaclimate.substack.com/p/april-cold-snap-in-western-alaska

Reader Gary asked about temperature variability and the lack of extremes this winter, and it certainly is true that Fairbanks has had a benign winter from the standpoint of temperature extremes (until now).  In December through February, only 8 days had a daily mean temperature below -20°F or above +20°F, and looking back at the history, only 1930-31 and 2020-21 (there it is again) had fewer such days.

As for the variance of daily temperatures across the broader winter season of November through March, this winter had the 4th lowest variance on record, with 1997-98 holding the title for least variable.  (Note that I'm calculating variance using daily temperature departures from normal, not absolute temperatures.)  Here's the very unusual temperature trajectory from winter 1997-98, when the most powerful El Niño on record prevailed across the tropical Pacific.


Reduced temperature variance is a common feature of El Niño winters in Fairbanks, as I discussed back in 2016, during the last super El Niño:

https://ak-wx.blogspot.com/2016/02/lack-of-cold-and-low-variance.html

Here's another post, showing that El Niño tends to produce a stable flow pattern, whereas the circulation tends to jump around more than normal during La Niña.

https://ak-wx.blogspot.com/2015/09/enso-height-patterns.html

This of course means that the lack of variance this winter is particularly odd, given that it was a La Niña winter!  Both cold and variance were missing until now; but perhaps they were not sorely missed.


Tuesday, April 11, 2023

Another Warm and Wet Winter

First, a note on the continued cold, which is primarily focused on western and northern Alaska.  The Selawik ASOS reached -39°F this morning, Noatak saw -37°F again, and -31°F at Bettles today is the latest on record for such cold, although the cold snap of two years ago was more noteworthy (-39°F on April 9).

For the state as a whole, this is a more unusual cold spell - in terms of standard deviations below normal - than anything that happened during winter.  Courtesy of UAF/ACCAP, here's the statewide standardized temperature index.  A value of -10 means the statewide average is close to or at a record level for the time of year, relative to the 1991-2020 climate.  More details on the methodology here.


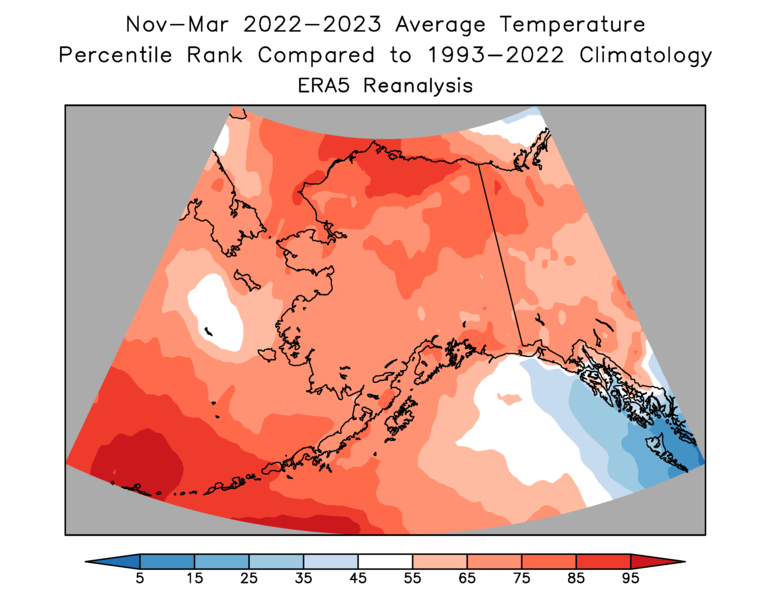
Speaking of winter, for the third year in a row La Niña failed to produce significant cold for the state as whole, and in fact both the December-February and November-March periods were somewhat warmer than the previous two winters.  2019-2020 was colder than any of the winters since, and that was a weak El Niño winter.

However, the southern half of the Alaska Panhandle was significantly colder than normal this winter: the 3rd coldest of the past 30 years for the southernmost climate division, according to NOAA/NCEI data.


Precipitation was well above normal to the north of the Alaska Range, but generally lacking around the Gulf coast, and especially in the Panhandle, according to NOAA.  Juneau received about 24" of liquid-equivalent precipitation in November-March, in contrast to nearly 38" in both of the preceding two winters.

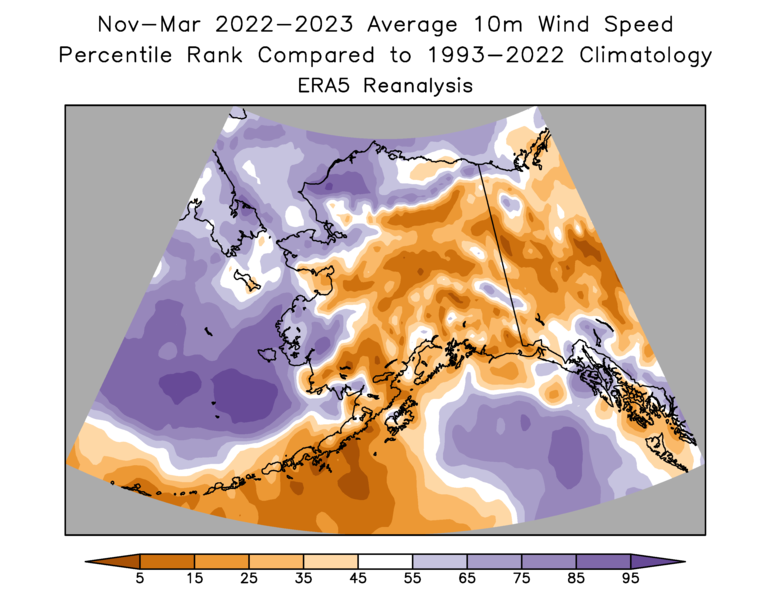
The circulation feature responsible for these patterns was a major high pressure anomaly just to the south of Alaska; this tended to block Gulf storms from affecting the coast and also produced a northerly flow that imported cold air to the Panhandle.

In contrast, persistent westerly and southwesterly flow to the north of the ridge brought widespread mild and snowy (or rainy) conditions to western and interior Alaska and the North Slope.  Unsurprisingly, ERA5 shows that winds were above normal for the west coast and also much of the North Slope; but the sheltering influence of the ridge kept winds to a minimum for much of the interior, south coast, and Alaska Peninsula.


Saturday, April 8, 2023

Record Cold in Spots

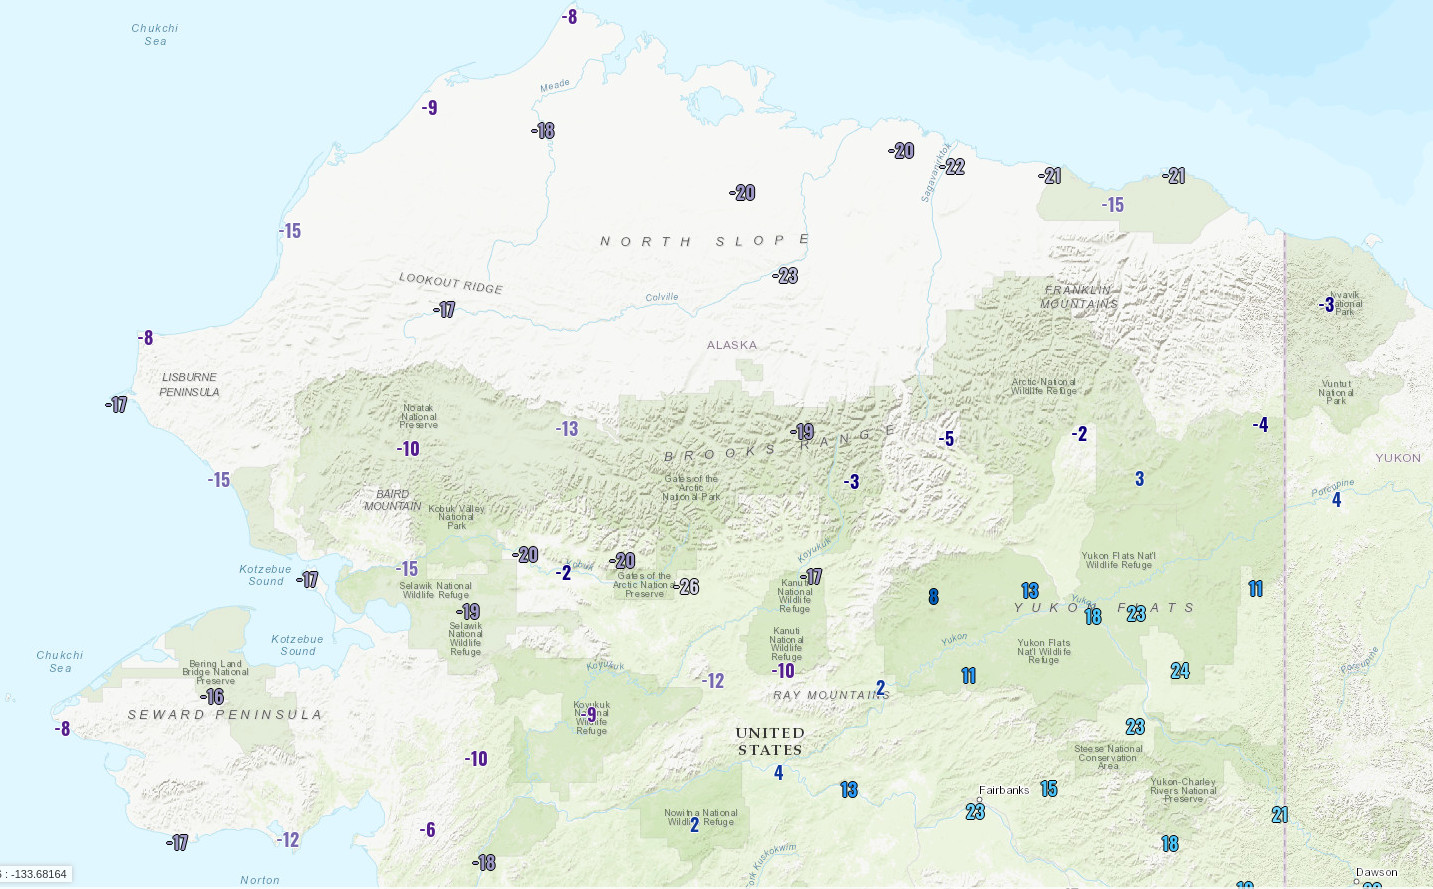
Cold has intensified for western and northern Alaska, with -30°F being reached in a number of spots this morning.  Most notably, Nome was one of those spots, and this ties the record for the month of April and is also the coldest on record this late in the winter.  The only previous instances of -30°F in April were April 5, 1918, and April 7, 1968.

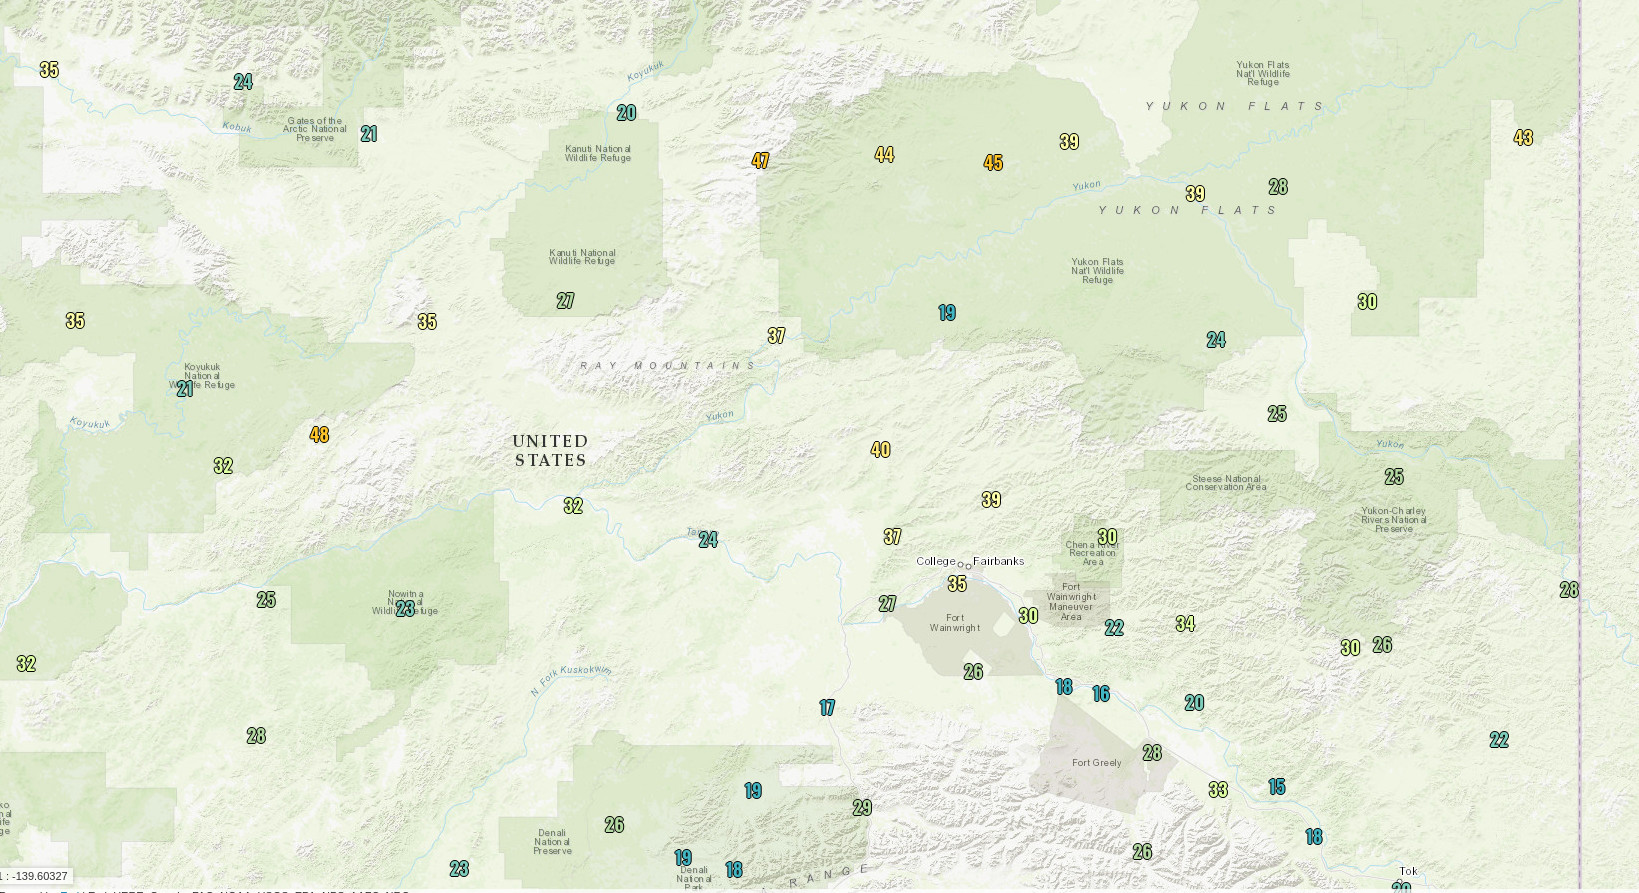
The maps below show the lowest hourly-observed temperatures since midnight, and the minimum temperatures (e.g. as measured by ASOS instruments) can be a bit lower than these hourly numbers, as at Nome.  Click to enlarge.


Here's a roundup of some other notable low temps:

-37°F  Noatak

-36°F  Umiat RAWS

-33°F  Selawik 28E CRN

-32°F  Kivalina

-28°F  Utqiaġvik

A couple of days ago Bettles had -31°F, and Wiseman saw -32°F.  This is verging on record territory for the time of year, but it doesn't seem all that remarkable after the 2021 cold snap, which was much colder for the interior.  Read more about that here.

Reader Andy makes a good point about the increasing risk of flooding at break-up because of this cold weather, as there is a healthy snowpack across much of interior Alaska.  Rick Thoman just wrote about the snowpack on his Substack newsletter - check it out if you haven't already:

https://alaskaclimate.substack.com/p/spring-2023-snowpack


Wednesday, April 5, 2023

Winter Lives

Winter is lingering in northwestern Alaska and the North Slope, where a cold air mass has been reinforced in the past couple of days by an upper-level low developing just to the north of Alaska.  Temperatures were in the teens and 20s below zero Fahrenheit this morning across a wide area, and the wind chill dropped to near 50 below at Deadhorse (for example).  Pretty chilly for a location with nearly 15 hours of daylight.

Here are minimum temperatures since midnight:


It's interesting to see a notable cold signal for much of Alaska in the CPC's latest 6-10 and 8-14 day outlooks:


I'll be curious to see if Alaska can manage a cold April overall, because I've long held a hypothesis that a disruption to the stratospheric "polar vortex" in January or February can sometimes (not always) produce a cold pattern for Alaska at this time of year.

The spectacularly cold spring of 2013 is the poster child for this idea: there was a major "sudden stratospheric warming" (SSW) in early January, and the effects definitely lingered for months in the boreal high-latitude circulation.  2006 and 2009 were also notably cold for Alaska in March-April, following January stratospheric warming events.  More recently, 2021 was cold, but less so, and 2018 and 2019 were warmer than normal, especially in March; all of these years had SSW events.

We had a major SSW this winter on February 16, so let's see how the next few weeks play out.  Late breakup, anyone?  There are still a few hours left today to make a guess on breakup at Nenana...

Wednesday, March 29, 2023

Another Kotzebue Blizzard

It's only been 3 weeks since I wrote about back-to-back blizzards in Kotzebue that led to a local disaster declaration (news link courtesy of reader Gary), but another major storm affected the area last weekend.  Remarkably, hurricane-force wind gusts were reported by the airport ASOS, although the observations were missing for several hours, so perhaps the instruments malfunctioned.

By my count, this makes five real blizzards in Kotzebue this winter: November 7, December 10-11, February 21-23, March 4, and March 25.  Each of these had sustained winds above 40mph.  There was also a storm on January 27-28 that briefly met the blizzard criteria (35mph wind and 1/4 mile visibility).

In light of the recurrent storminess in Kotzebue, reader Andy's recent comment about Nome being "inundated with snow in many recent winters" is very interesting and worth a closer look.  Let's have a look at November-March precipitation for the two sites: the charts below show results both from the standard climate observations and from the nearest grid cell in the ERA5 reanalysis.


The large wet bias in the ERA5 data is not unexpected in model data, and it's not generally regarded as a problem - the user just has to implement a bias correction.  Much more importantly, the year-to-year correlation between ERA5 and the ground truth data is fairly good back to about the mid-1970s, giving us some confidence in both sources for the last several decades.  (The ERA5 does not use precipitation observations in creating its global gridded estimates.)

Excluding pre-1980 data, there's little trend in Nome winter precipitation, although the two very wet winters of 2017-18 and 2018-19 certainly count as being "inundated".  At Kotzebue, however, there does seem to be a significant trend towards wetter winters in both the ERA5 and ground-truth data, and the absence of a "dry" winter since 2016-17 is notable.

As for the earlier decades, the situation is more uncertain.  The Nome precipitation data doesn't seem to have enough year-to-year variability in the 50s and 60s.  The correlation with ERA5 is poor in the early decades for both sites, although that by itself doesn't invalidate the climate observations, as the ERA5 uncertainties are much greater for that time.  The pre-1970 numbers from Kotzebue are so low that they seem unreasonable at first glance, but if indeed the winter climate was more truly Arctic back then, then perhaps much lower precipitation is plausible.  Utqiaġvik averages less than 2 inches total precipitation in November through March even after becoming much wetter in recent years.

So much for precipitation; but how about high winds (the "blizzard" aspect of the problem)?

We don't have consistent wind measurements across the decades, so I again turned to ERA5 and extracted the hourly wind speed back to 1950 for both sites.  I determined the peak wind speed for each winter (November-March), calculated the median of those numbers, and then found the number of hours each winter that exceeded that "typical winter maximum".  The ERA5 winds are a bit lower than reported by the ASOS instrument of today, and in reality this "typical winter maximum" corresponds to sustained winds of about 40mph in Nome and 50mph in Kotzebue.  Half of all winters see winds of at least this strength at some point.


To bolster confidence that ERA5 winds are realistic, I checked the highest values in the history.  The highest ERA5 hourly wind speed for Nome was at 9pm on December 28, 2021, and indeed that day saw a major wind storm that peaked at 8:30pm.  In Kotzebue, the highest ERA5 wind speed in recent decades was at 11pm on February 18, 2006, and the observed wind speed peaked at the very same hour.

It's interesting that both sites have seen an increased frequency of winters with relatively high winds in the past 20 years; there have been few winters without high wind, especially at Kotzebue.

As for the maximum winds each winter, there's a hint of an upward trend in recent year for Nome, with few recent winters on the low side of the distribution, and the change seems a bit more pronounced at Kotzebue - see below.

Finally, looking at the number of days that met the blizzard criteria in the past 25 years (approximately the ASOS era), there's again perhaps just a hint of an increase in Nome, and Kotzebue has had 9 or more blizzard days in 5 of the last 6 winters.


All in all, it does seem that a trend is emerging at Kotzebue, although as usual the year-to-year variability makes it difficult to be sure, and formal significance testing would likely not give a resounding message.  The trends at Nome seem more tentative and uncertain.  Remind me to take another look at this a few years from now...

Thursday, March 23, 2023

More on Snow Ratio

A few weeks ago I commented on the decrease in "snow ratio" of the last decade or so in Fairbanks.  Although winter precipitation obviously still falls as snow the vast majority of the time, the recurrent warmth of recent years has produced a lower ratio of snow depth to liquid-equivalent precipitation, and the occasional winter rain events (a few of them very large) have contributed significantly to this trend.

One would expect similar or larger trends to be found at western Alaska sites, where the proximity of the Bering Sea has produced excessive warmth in recent years: other than the North Slope, the west coast and Aleutians have seen the most significant winter warming of anywhere in Alaska in the past few decades.

But interestingly the results are mixed when looking at Bethel and Nome.  [Note that "snow depth" in the charts and discussion refers to the accumulation of daily snow amounts - the "total snowfall" - and not the actual depth of snow on the ground at any one time.  The latter is affected by compaction, evaporation, melting, blowing away, etc.]


Sadly snow measurements ended at most Alaska climate sites a few years ago, so the data isn't up-to-date, but I'm not sure there is much to glean from these two sites.  Bethel had several low-ratio winters after 2010, but the historical record looks a bit unrealistic, with clusters of high and low ratio winters that do not look as randomly distributed as we would expect.

As for Nome, the upward trend is quite striking, but I'm skeptical, given what we know about the dramatic warming in recent years.  It seems possible that snow depth may have been systematically lower in early decades, perhaps because of less shelter from buildings near the observing site, or perhaps because of different measuring practices.

We can look at the ERA5 reanalysis data for an alternative view of changes in the proportion of snow versus rain.  My last post showed that the model shows a change in Fairbanks since 2010-11, which agrees with the ground-truth observations.  On a statewide basis, the fraction of winter precipitation falling as snow has also dropped, with an increasing number of years with percentages in the low 90s, and fewer years (but still some) with nearly all precipitation falling as snow.


Note that the data prior to 1950 is a newly-released component of ERA5, and I included it "just because I can".  It's highly uncertain and probably not worth much at all.

On an annual basis the fraction of precipitation falling as snow has dropped off quite a bit since the 1970s, according to ERA5, with 1992 being the last year with more than half falling as snow (and that certainly was a very unusual year).


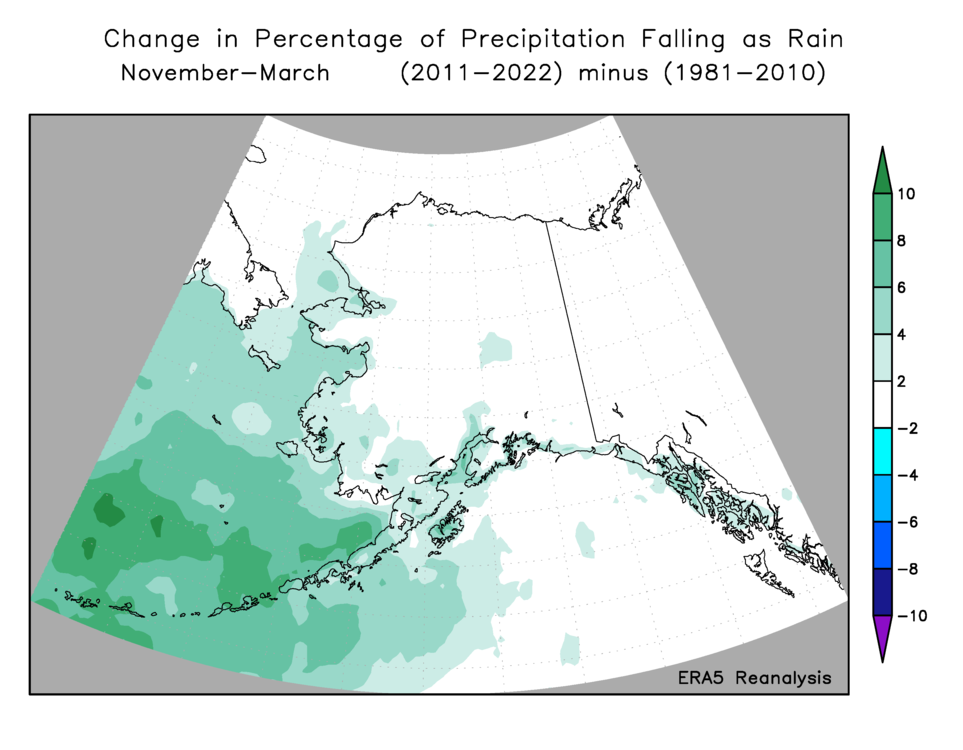
Here's a map of the total fraction of November-March precipitation falling as rain in the last 12 years (this makes for a more pleasing map than the inverse fraction):

The change from the prior 3 decades is heavily concentrated over the Bering Sea, where the increase in the percentage has been as much as 10% (e.g. a change from 50% to 60%).

The increase over land is much smaller in absolute terms, but of course it is large in relative terms.  Here's the percentage change, but only for locations with at least 0.1% rain fraction in the 1981-2010 period.


Looking farther afield, it's interesting to see that the largest changes, in absolute terms, have been across eastern Europe, the Norwegian Sea, and eastern mid-latitude China.  These are places where both rain and snow are common in winter, and the relative fraction varies a lot from year to year and decade to decade.  The tendency for a positive Arctic Oscillation in recent years has certainly produced warm winters in much of Europe and Asia.


The charts below illustrate the year-to-year changes for all land area north of 60°N.  It's interesting to see the annual fraction of snow apparently peak in the 1970s, consistent with a cool phase of the Atlantic Ocean.


Thursday, March 16, 2023

Lingering Cold

Temperatures have been volatile in Alaska over the past month or so, but overall the past 5-6 weeks have produced more cold than warm weather, and this week is certainly on the cold side for much of the state.

Last night dropped into the -20s and -30s Fahrenheit in many of the colder locations: click to enlarge the map below.


This kind of cold is a bit unusual for the middle of March, although nowhere near record territory.  For instance, today's record low at Bettles is -49°F, and just two years ago Bettles saw a remarkable -39°F on April 9.  Read more here on the great April 2021 cold snap.

It's interesting to note that the northern interior has had an unusual number of days with much colder conditions than in, say, Fairbanks this winter.  For example, Bettles typically sees half a dozen days with a low temperature 25°F colder than Fairbanks, but there have been 13 such days this winter.  This is the fourth straight winter with 10 or more such days.

Here's this morning's mid-atmosphere (500mb) map, courtesy of Environment Canada.  A deep trough extending south from the Arctic means a cold air mass, a weak pressure gradient means light winds, and with the main jet stream activity far to the south, clear skies provided the final ingredient for sharp overnight cooling.


Views from the FAA webcams this afternoon are simply glorious; here's Bettles and the Chandalar Shelf DOT site: