After last week's extreme rainfall in Southeast Alaska, a noteworthy North Pacific storm brought a lengthy episode of strong winds to southwestern parts of the mainland earlier this week. Here's a surface analysis from 3am Sunday, courtesy of Environment Canada:
Bethel had two unusually windy days on Sunday and Monday - with snow and temperatures down near 0°F to start - and the wind was really howling at the more exposed locations. For instance, Cape Romanzof (admittedly a very windy place) reported sustained winds around 60-70 mph for a full 24 hours, with gusts of 80 mph.
Our old friend Howard Pass, up in the western Brooks Range, also saw a modest blow as the pressure gradient worked its way north this week. In characteristic fashion, the temperature dropped as the wind picked up at the pass, and bottomed out at -20°F with 40-45 mph winds. Nasty, but nowhere near the conditions that have been observed there on some past occasions.
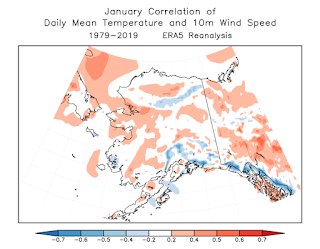
The fact that the strongest winds in western Alaska often seem to prevail from a northerly direction got me thinking about whether there is in fact an inverse correlation between temperature and wind speed in these areas. In the interior lowlands we would generally expect the opposite in winter: wind brings warmth, but what does the relationship look like on a map?
With the ERA5 reanalysis, we can answer this question with a fair degree of confidence. The sequence of maps below shows the correlation coefficient of daily mean 2m temperature and daily mean 10m wind speed, by month, from 41 years of data. Click the images to enlarge.
Interesting features to me are:
- Inverse correlation (cold when windy) in the highest elevations
- Positive correlation (warm when windy) in winter across the interior North Slope, the Kobuk valley, the Yukon Flats, the mid-Tanana valley, and elsewhere in the lower elevations of the west.
- Inverse correlation in summer across western Alaska and the oceans (warmth occurs in conjunction with high pressure and reduced winds)
- Very high positive correlation in the warm half of the year across northwestern Canada and parts of eastern Alaska - but apparently not directly corresponding to elevation. I'm not sure what to make of this.
If readers have any comments or insight on the patterns, I'd be glad to hear them.


No great insights, but: In summer wind helps move warm surface air around, up, and over terrain. Lots of dark trees-vegetation with low albedo especially on solar facing slopes. In winter wind scours cold surface air and moves it around, up, and over terrain. Surface terrain shielded by any low angle solar gets real cold.
ReplyDeleteNow what would be interesting is comparing Howard Pass temps when windy with nearby stations that are lower an not as windy. Maybe has been done. It's an example of a location subject to exposure to cold that's likely developed elsewhere.
Gary
Also....when windy over terrain it tends to mix layers of upper cold air (it tends to be that way even above a lower inversion) down into that terrain. Higher faster wind aloft mixing into lower slower flowing air. Or something like that.
DeleteGary
Richard, catching up on the blog posts...
ReplyDeleteAre your monthly correlation graphs only correlating that month's data? I can see the temperature swings in interior winter really screwing with the correlation values. And Bering sea storms act differently in winter than summer. And thunderstorm cooling give different results than calm overcast drizzles. Since variability in some areas is so different compared to other areas, I'm not sure if you can draw any good observations with absolute wind speeds and absolute temperature.
I think you should correlate standardized temperatures and standarized wind speeds. Also separate out windy and non-windy days and heavy thunderstorm days (where temperatures can drop 20 degrees for half a day).
Yes, each month is done separately. I agree there should be better ways to examine the data, but I'm not sure about separating out different regimes, because it's the full population relationship/correlation that I'm interested in. However, I admit the non-Gaussian distribution of wind can be a problem for Pearson correlation; rank correlations would be a bit better.
Delete