Monday, June 27, 2022

Prediction of Extremes

[Warning: technical discussion]

Lately I've been spending some time exploring forecasts of short-duration extreme events on the seasonal forecast horizon, i.e. months ahead.  Seasonal forecasts are usually presented in terms of the shift in probabilities for seasonal-average conditions, for example total rainfall or average temperature over the course of a summer, but it's interesting to consider whether we can say anything about the chance of short-duration extreme outcomes within that seasonal window.

To look at this problem, I'm using forecast data from the ECMWF and UK Met Office seasonal models, available via the EU's Copernicus service.  The models produce daily data out to 6 months in the future, and as usual there is an ensemble of different outcomes to sample the uncertainty.  Moreover, in addition to the realtime forecasts, the models are run in hindcast mode for 1993-2016, so that we can calculate things like model bias and model skill.

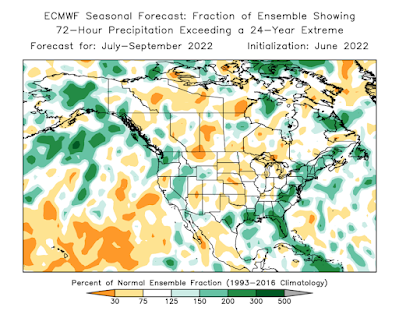
Here's the result that grabbed my attention and prompted this admittedly technical post: notice the wet signal over interior Alaska.  Qualitatively, this shows an enhanced risk of an extreme 3-day precipitation event some time during the July-September period.

Bear with me on the explanation of this map, as it's not entirely simple.  There are two steps involved in the calculation.

First, use the hindcasts to find the threshold for a once-in-24-year precipitation event in the model climate for this time of year.  The 24-year recurrence interval is arbitrary, but it makes the calculation easy with 24 years of hindcast data and corresponding observations.  On average, 1 in 24 model ensemble members show a 3-day precipitation event of this magnitude at some point in the July-September window.

Second, count the number of ensemble members in the current forecast that show 3-day precipitation above this threshold; and divide by 1/24 to get the increase in risk relative to the model climate.  For instance, if 5/51 members show the extreme, then the risk is about 2.4 times normal (240% of normal on the map).  If only a single member (1/51) shows it, then the risk is about 50% of normal.  Of course, all of the probabilities are small: 5/51 members is still only a ~10% chance.

The spatial patterns in the map above are fairly consistent with the model's standard forecast for 3-month total precipitation, as you'd expect, although the extremes-focused calculation provides some interesting nuance.  Here's the Copernicus map for July-September total precipitation anomaly, i.e. departure from normal.


The Climate Prediction Center's seasonal forecast (see below) also has a slightly enhanced probability of significantly above-normal precip for much of interior Alaska, and of course by itself this does imply an increased risk of a short-duration extreme event.  It's certainly possible to see upper-tercile seasonal total precipitation without any particularly extreme events (e.g. summer 2015 in Fairbanks), but there's obviously a correlation in general.


How about the UK Met Office model?  Interestingly this highly-regarded model also shows a signal for increased risk in the southern interior, although the forecasts are fairly dissimilar otherwise.


The burning question here, of course, is whether the models have any demonstrable skill in anticipating extremes.  This is a very challenging question, because by definition we only have a single extreme outcome at each location in the 24-year hindcast history.  Running any meaningful statistics requires aggregating the data over a large area, and therefore smoothing out potentially important local variations in the model skill.

We also have to reckon with the fact that gridded reanalysis data, which is typically used as "ground truth" in this kind of work, is undoubtedly deficient when it comes to representing short-duration precipitation extremes.  A quick calculation based on ERA5 "observations" suggests that skill may be very marginal or non-existent over Alaska at this time of year, but it's actually possible that real-world skill is better.

In any case, it's an interesting result, and food for thought regarding the best way to make these forecasts.  Let's see what happens in the next 3 months.

Thursday, June 23, 2022

Precip Graphics

Just a quick follow-up note to say that I automated a set of precipitation graphics based on the NWS analysis, and they can be found in the following directory:

https://worldagweather.com/alaska/qpe/

If time permits I may set up a simple interface to view the graphics more easily, but for now it's just the simple image links.  The graphics should update around mid-morning Alaska time.  Let me know if any problems arise.


Monday, June 20, 2022

Precip Data

With some help from Rick Thoman, I've managed to get hold of the NWS daily Alaska precipitation analysis data, i.e. the precipitation estimates that are displayed by the Alaska-Pacific River Forecast Center at:

https://www.weather.gov/aprfc/qpe_qpfViewer

Here's how the last 30 days stack up against normal for the time of year (using PRISM 1981-2010 normals):


That's a lot of dry.  Fairbanks picked up its first measurable rain in over a month yesterday, amounting to 0.35", but most locations around the area didn't see that much.  Here are estimated totals from the last 7 days:

A couple of cautionary notes about the data: first, obviously, there are very large areas with little or no data, so don't be impressed by the level of detail on the maps.  The analysis method takes the often-scarce observations and uses the high-resolution PRISM normals to create a best guess of how the precipitation may have varied depending on elevation, terrain orientation, and so forth.

The other note is that the analysis uses only automated observations, because the daily analysis is valid for 1200-1200 UTC, or 3am-3am AKST.  Manual observations like co-op or CoCoRaHS are not included.

The 90-day maps show less than 0.75" of liquid-equivalent precipitation in the Y-K delta region, and less than 20% of normal near Bethel and a few other spots around the state.


Friday, June 17, 2022

More Fire

Wildfire continues to be the big weather-related story for Alaska, and it's getting bigger quickly, with fire acreage increasing by over 100,000 acres a day in the last week.  Today's AICC report states that over 900,000 acres have now burned this season, i.e. basically in the last 10 days.

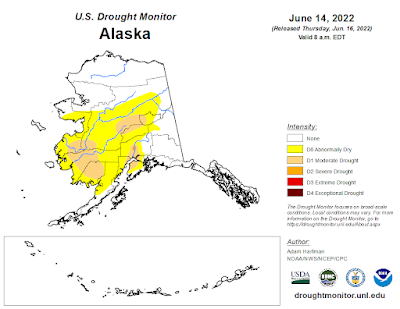
Last week I mentioned the dryness in April and May that set up the fire situation in southwestern Alaska, and widespread dryness is now becoming really unusual over a large area.  Fairbanks has had no measurable rain for a month, which is unprecedented for the time of year.  Here's this week's update to the Drought Monitor analysis:

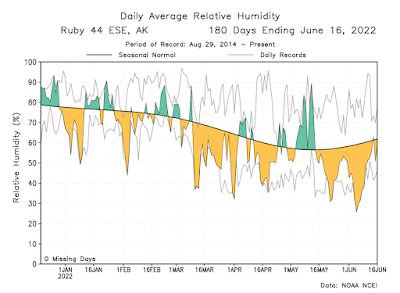
It's not just the absence of rain that has produced very dry fuel conditions; it has also been unusually sunny with low humidity.  Here are charts showing the last 6 months of sunshine and humidity data from the CRN site in the Nowitna NWR (SE of Ruby):


These graphics are taken from my informal Alaska CRN visualization page:

https://www.worldagweather.com/crn/

Using temperature and humidity data at 5-minute intervals from the CRN sites, I calculated the vapor pressure deficit since May 1st; this gives a first-order estimate of evaporation rates, excluding effects of sunshine and wind.  The VPD is easily the highest in the short period of record for a number of the sites; for example, here's the May 1 - June 15 average VPD and total rainfall at the CRN site on the Kenai Peninsula.


Saturday, June 11, 2022

Early Fire and May Climate Data

Last week I commented about the dampening effect of La NiƱa on Alaska's wildfire season, and that theory is being put to an early test only a week later.  Extremely warm and dry weather in southwestern Alaska has produced an early and aggressive start to this year's fire activity, with statewide fire acreage jumping to over 300,000 acres today.  This is more than burned in either of the last two years over the entire summer.

Rick Thoman has been posting lots of great information on Twitter, with a focus on the threatening East Fork Fire that has burned over 100,000 acres on tundra just to the northeast of the town of St Mary's on the lower Yukon.  This is remarkably far down the Yukon for a large fire, and it's easily the largest fire on record for the Yukon-Kuskokwim delta region:


Rick also posted a nice satellite view of the smoke plumes yesterday afternoon: click to enlarge.


Very dry land surface conditions have developed over the past couple of months in southwestern Alaska, owing to a dry and warm spring.  April was warm and dry relative to normal, and it's worth noting (I missed it at the time) that over 10,000 acres burned in April near Kwethluk and Bethel:

https://akfireinfo.com/2022/04/27/narrated-aerial-surveillance-flight-infrared-footage-of-kwethluk-fire-april-26-2022/


May was also very dry for southwestern Alaska; here are my usual NOAA and ERA5 precipitation rank maps:

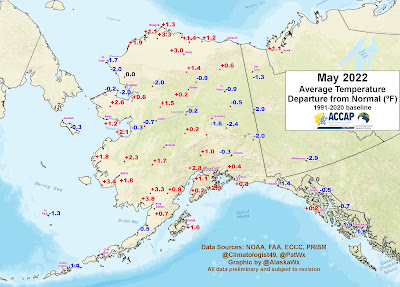
Temperatures were above normal in the Y-K Delta region and from the Bering Sea coast to Alaska's south-central region.


Sunshine and wind were both above normal across the southwestern mainland in May, and the dewpoint was below normal:


The result: the month of May had the lowest soil moisture in at least 30 years (in May) for the Y-K Delta, according to the top subsurface model level in the ERA5 data:


And that's before the exceptional warmth so far this month: until today, every day so far in June has been at least 73°F in Bethel.  It's easily the warmest start to the month on record, and with almost no rain to relieve the situation.

The analysts at the U.S. Drought Monitor agree that the situation is significantly abnormal over a wide area:


Does this portend a big fire year despite what I said in last week's post?

Not necessarily.  Of 7 other years since 1995 that had burned over 100,000 acres by this date, only 3 of 7 ended well above normal for statewide fire acreage.  The two years that were already ahead of this year (2002 and 2010) both ended up with over a million acres burned, but 2011 and 2014 both saw only minor fire activity after this date.

As for La NiƱa, it's interesting to note that there has been significant disruption to La NiƱa in the past several weeks, caused by vigorous atmospheric waves that have been traveling around the globe along the equator.  La NiƱa has been weakened - probably temporarily, but circulation patterns have been affected in extratropical regions, and this could explain why the weather has been more or less opposite of the typical June-July La NiƱa pattern for southwestern Alaska.  Let's hope we soon get back to business as usual.

Saturday, June 4, 2022

Wildfire Outlook

First a quick note on meltout at higher elevations around Fairbanks: the Munson Ridge SNOTEL site (3100' elevation) is still reporting 4.9" of water content in the snowpack early today (and a snow depth of 18" yesterday).  With relatively warm weather, nearly 12" of snow water equivalent has melted out in the past 10 days, and the snowpack is no longer a record for the date: in 2000, there was still 7.8" of water on the ground on June 4.  Since 1981, there have been 4 other years with snow remaining at this date: 1982, 1985, 1992, and 2000.

Down at Denali NP headquarters, the reported snow depth dropped to zero on Monday, which makes this the latest meltout on record for the venerable climate observing site:


But onto another topic: the National Interagency Fire Center issued their wildland fire potential outlook on Wednesday.  Large areas of the lower 48 are facing above-normal wildfire risk, but there is no departure from normal in the forecast for Alaska.  For example:


The discussion does acknowledge unusual dryness in southwestern Alaska, and indeed this week's Drought Monitor has "moderate drought" in south-central (see below), but the ongoing La NiƱa episode is recognized as a negative factor for wildfire activity.


I've commented before on the strong relationship between Alaska wildfire acreage and ENSO (El NiƱo vs La NiƱa), but it's worth looking at this again with a few more years added to the analysis.  The scatterplot of fire acreage versus June-July ENSO phase is quite remarkable:


I don't have fire data prior to 1990, but in the last 32 years, the top 9 fire years all had a positive ENSO phase (but marginally so in 1990), and the highest acreage with a negative ENSO phase was 1.3 million acres in 2013 (a hot summer, but dry with little lightning).

For reference, the April 2022 ENSO index was -1.6.  The current La NiƱa episode is one of the strongest on record for the time of year, and it's very likely to persist through summer:


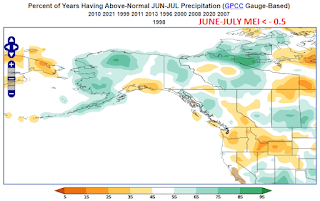
As for why La NiƱa tends to prevent excessive fire acreage in Alaska, it's clearly related to La NiƱa's influence on the prevailing weather pattern: it is often relatively cool, damp, and cloudy, especially in western Alaska.  Here's a frequency analysis of the June-July weather anomalies in the 11 years since 1990 that saw La NiƱa conditions:


There tends to be an upper-level trough from western Alaska to British Columbia, and this is aligned with the negative PDO phase that tends to prevail in conjunction with La NiƱa (and indeed the PDO is quite strongly negative at present):


One other aspect: wind speeds tend to be lower than normal across the entire interior, which may help reduce fire growth.


In summary, the ongoing La NiƱa regime strongly favors a relatively inactive wildfire season this year in Alaska.  However, I'd caution that it's not a certainty: one of these years there will be an exception to the rule, and even "relatively inactive" could still be problematic: there were 3 La NiƱa years with 1+ million acres burned.  And of course, if the current warm and dry weather persists, there will definitely be problems.