This is the time of year when there are big climate contrasts across the Alaska interior, depending on where snow is still lying. Fairbanks versus Bettles serves as a good example: the snowpack melted out (officially) last Wednesday in Fairbanks, and the temperature hasn't been below freezing since then. The Tanana River ice at nearby Nenana went out yesterday. In contrast, there are still 24 inches of snow on the ground in Bettles, and only a handful of days have reached 40°F so far. Of course it's much more difficult to warm up with deep snow on the ground, so locations with earlier meltout get a big boost to temperature.
Using climate data from 1991-2020, April is typically a whopping 9°F warmer in Fairbanks than in Bettles, a bigger difference than in any other month.

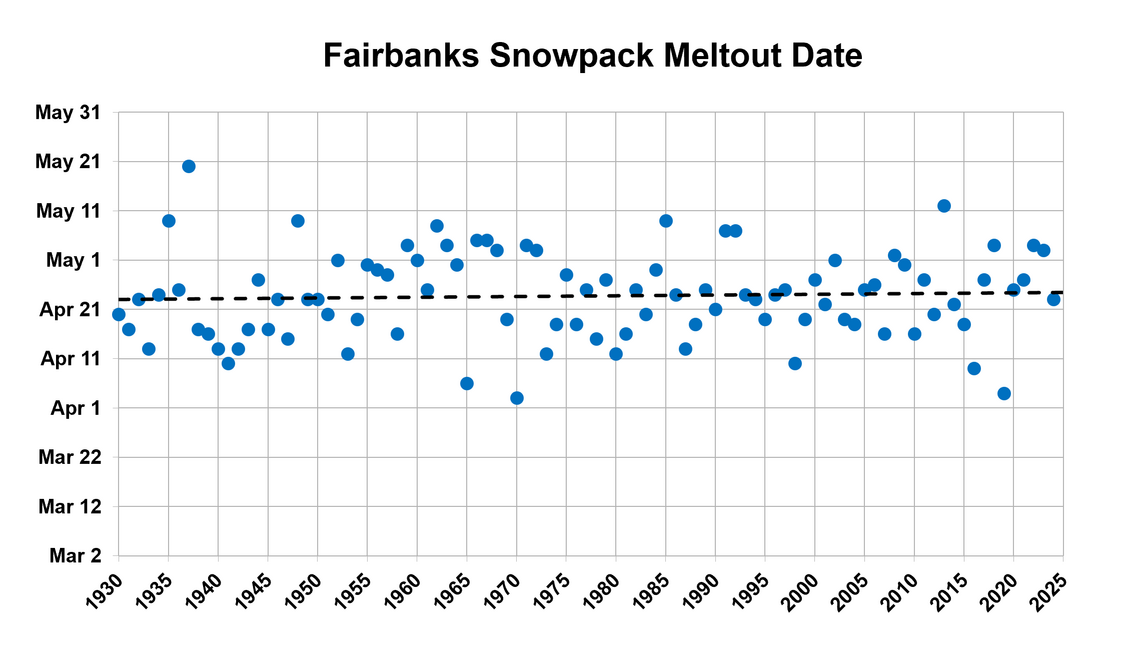
Looking at the overlapping climate history for the two sites, the median snow meltout date is April 25 in Fairbanks (so this year was only a couple of days early), but it's May 12 in Bettles - a difference of 17 days. Obviously part of this is caused by Bettles being farther north and therefore colder to begin with. Bettles also gets a lot more snow - nearly 50% more total precipitation in winter than Fairbanks - so the snowpack tends to be deeper.
I think another factor is that the Tanana River valley sees an additional boost of spring warming from its location downwind of the Alaska Range, i.e. downslope warming. The chart below shows the monthly average wind speed and direction in the middle atmosphere above Fairbanks (calculated using vector components). Notice that the average wind direction becomes progressively more southerly in April, May, and June, before returning to southwesterly in July.

The winds at lower levels tend to be oriented even more from the south for most of the year. For instance, at 700mb - approximately the height of the Alaska Range - the April wind above Fairbanks is typically from 210° on the compass (see below). At 850mb (about 4000 feet above ground), the average wind is almost out of due south in April, although with great variability of course. Episodes of southerly air flow are therefore very common, and the more abundant sunshine of spring tends to produce vertical mixing that brings warmth to the surface very effectively in the southeastern interior. (Contrast this with winter, when a surface-based temperature inversion is typical.)

The northern interior, on the other hand, sees a much smaller warming influence from Alaska Range chinook flows; and with a slightly higher latitude and locally greater snowpack on the southern slopes of the Brooks Range, the positive feedback of snowmelt and reduced albedo is considerably delayed.
Here's a webcam view from Bettles today:

And just for fun, Arctic Village and Chandalar Shelf: glorious views.