Saturday, June 26, 2021

Low Fire Acreage So Far

The big story in the climate world this weekend is the outrageous heat wave currently affecting British Columbia and the Pacific Northwest of the lower 48 - and also far southeastern Alaska - but for today I'll highlight a bit of good news: Alaska fire acreage so far this season is surprisingly low.  As noted by Rick Thoman today, acres burned so far amount to only 60,000 - which is the lowest for the date since the exceptionally quiet year of 2008, when only 63,000 acres burned in the entire season.

Typically one-third of the season's fire acreage has accrued by this date, so it's becoming somewhat unlikely that we'll end up with an active season; there's a pretty good correlation between June 26 acreage and final acreage.  But let's not be hasty: fire activity can really take off in July, so the verdict isn't in yet.


I said the acreage is "surprisingly low" because lightning activity has been almost exactly normal so far, and temperatures have been above normal much of the time since spring, with a couple of notable warm spells this month (see below).  [Update July 6: this chart is not quite correct, see July 6 post for an update.]  It also hasn't been particularly wet, although my impression is that the thunderstorms that have occurred have been significant rain makers in localized areas.  So perhaps there has been less dry lightning than normal, and hence a reduced number of fire ignitions.


Monday, June 21, 2021

Arctic Temperature Trends

Following up on the topic of Arctic-wide temperatures (see this post from a couple of weeks ago), I've started working on some new graphics to visualize the ongoing ebb and flow of temperature anomalies across the 32 longstanding climate observing sites that I mentioned before.  But first, here's another view of monthly anomalies since 2010, but this time presented in terms of standard deviations; so this puts all seasons on a level playing field and eliminates the spike in temperature variance during winter.


The message is the same: Arctic-wide temperatures saw a jump up in winter 2015-16 and have remained generally elevated.  Since 2016, there have only been a handful of months in which any of the sites was 2 standard deviations below the 1991-2020 normal (last February at Bettles was one of them), but more often than not at least one site has been 2-3 standard deviations warmer than normal.  The community of Resolute in northern Canada saw a +3.5 SD anomaly in January last winter (it was the warmest January on record).

Here's a look at the 1980-2020 linear trend by calendar month, for the 32-site average temperature.  The absolute value of the trend is smallest in summer (a "mere" 0.4 °C/decade), but the statistical significance of the summer warming is on par with the rest of the year, and considerably exceeds the late winter minimum in significance.  All in all, the trend is most pronounced in late autumn, as we well know from discussing Utqiaġvik over the years (e.g. here).


Now on to a map view of monthly anomalies so far this year: below are pairs of maps for each month, showing departures from normal in both absolute and standardized terms.

January:


February:


March:


April:


May:


As noted in the previous post, February and March were slightly colder than (the 1991-2020) normal overall, but this was a mere blip in the context of the sustained warmth of recent years, as the top chart above shows.  Two Canadian sites - Resolute and Pond Inlet - had their warmest January on record, and the widespread warmth in Siberia in May echoed the persistent, excessive warmth of last year (see here for comments on 2020 in Siberia).

This month will also end up much warmer than normal in most of northern Siberia, because there's a major heat wave under way at present.  Here's a chart for Suhana at 118°E longitude, showing daily mean temperatures in the last 60 days as well as a forecast from today's ECMWF ensemble.  Temperatures are peaking at well over 10°C above normal for the time of year; today's high temperature was 32.7°C or 91°F.


For the 32 sites collectively, we see that temperatures have been running about 1-2°C above normal since late May.  The forecast suggests a respite towards the end of the month, with temperatures dropping back to near or just below normal Arctic-wide; we'll see if this pans out.


Tuesday, June 15, 2021

Summer Heat

The heat is on for the eastern half of the interior today, with widespread 80s, including 83°F so far in Fairbanks and 84°F in Eagle.  Many RAWS site are hotter, but that's typical under strong summer sunshine.  More notable is the heat across the eastern North Slope: 72°F at Barter Island, and 80°F at Deadhorse on a southwest wind before the sea breeze kicked in.  Click to enlarge:


The 80°F at Deadhorse is the first time in nearly 3 years that the temperature has exceeded 73°F.  The calendar years of 2019 and 2020 had maximum temperatures of 73°F and 71°F respectively, which is actually the coolest pair of summers (by this metric) since 1987 and 1988.  But all four years from 2015-2018 saw at least one 80°F day in Deadhorse.  Here's a visual representation of all 75+ and 80+ days since 1970 in the combined history from Deadhorse and (prior to 1999) Prudhoe Bay.


It's interesting to note the occurrence of warm days in August - remarkably late in the summer for the Arctic coast - between 1989 and 2007.  Also, the trend towards earlier hot days seems notable: prior to 1990, the earliest 75°F was July 3, and today was the earliest 80°F on record.

In other (but related) news, Fairbanks airport has been reporting distant wildfire smoke this afternoon: presumably the result of the Haystack fire 20 miles north of town.  This is the first smoke report at the airport since June 1st of last summer, and that was the only day last year that reported smoke.

Friday, June 11, 2021

Stubborn Northwest Chill

It's been a cold start to climatological summer in the Bering Strait region, with a remarkably stubborn upper-level low residing over the area for an entire week.  Cut-off low pressure features like this are often persistent, but it's unusual to see almost no movement for such a long time.  Here's a simple animation of 500mb height analyses, courtesy of Environment Canada, at 3am each day from June 1-10.


With cloud and cold air stuck overhead, Nome has seen the coldest first 10 days of June since 2006.  Another statistic: the week ending June 8 was the third coldest week entirely within June since 1977; but 2006 and 2013 both had slightly colder weeks in early June.  Like this year, 2006 and 2013 both had major disruptions to the stratospheric vortex in January; there may or may not be a connection (perhaps more likely not), but I'm always on the lookout for these things.

Some fresh snow has been seen at various locations around the Seward Peninsula: here's a photo from Shishmaref on Tuesday (June 8), courtesy of Alaska DOT&PF on Twitter.


And here's a video of snow in Nome on June 5.


As for the larger context of Nome's temperatures so far this year: it was a chilly end to winter, but spring has been considerably warmer than normal most of the time since mid-April.


Saturday, June 5, 2021

Arctic-Wide Temperatures

Several years ago I spent some time looking at Arctic-wide air temperature trends based on measurements at climate observing sites around the basin, and it's probably worth returning to that idea for an update.  See here (and links therein) for previous work.  In my fresh look at this, I found 32 sites - distributed fairly evenly around the Arctic land areas - that have nearly complete data since 1980 and also report reliably on a daily and monthly basis.  Here's a map of the sites:


This set of locations is designed to sample both inland and coastal environments above the Arctic Circle (neglecting interior Greenland); previously I was focused on coastal sites clustered around the central Arctic Ocean.

The chart below presents a multi-decadal view of monthly mean temperatures at these locations; the black line shows the 32-station average of the monthly departure from normal, with "normal" being defined as 1991-2020.  The red and blue lines show the highest and lowest monthly anomalies within the set (with the largest anomalies occurring in winter, when variance is highest).  Click to enlarge:


The overall warming trend amounts to +0.76°C per decade (using linear regression), or a little over +3°C in the 41-year period.  This is much more warming than has occurred across the globe as a whole, illustrating the reality of "Arctic amplification".  I should note, however, that this analysis is based on the unadjusted ("unhomogenized") data from GHCN-M, so it's the "raw" data without corrections for changes in station siting, instrumentation, or observing practices; read more here.

Looking at the last decade or so, it's remarkable to see the jump up that occurred in winter 2015-2016, when the super El Niño occurred; temperatures seem to have remained at a higher baseline since then.  Since 2016, it has become fairly uncommon to have any station with a -5°C anomaly (even relative to the warmer 1991-2020 average), whereas most months in the past few years have had at least one site with a +5°C anomaly.


Interestingly, November of last year was the second warmest month in this period of record, with a +3.7°C average anomaly for the 32 sites.  Only January 2016 was warmer, at +4.3°C.  Again, this is relative to the new 1991-2020 baseline.

However, there was quite a drop-off in Arctic-wide temperatures as last winter progressed, and both February and March were colder than the new normal.  Here's a chart of the daily progression (with a few missing days just before the turn of the year).  For a little over two months in late winter, the Arctic was generally colder than normal, but it warmed up considerably in April, reaching 4.7°C above normal by late April.  The year-to-date temperature anomaly so far (January through May) is +0.47°C.


Now that I've identified this more comprehensive set of stations, I'll be able to slice and dice the historical data in various ways, and keep on top of Arctic temperature variations going forward.  If readers have any suggestions for interesting analysis, feel free to leave a comment.

Wednesday, June 2, 2021

Winter Lives

The calendar may say June, but the weather has been more than a little wintry in the past few days at Howard Pass in the western Brooks Range.  Readers of this blog are well acquainted with the extreme wind chills that occur regularly up there in the winter, but it turns out that the site can put on a good show even in "summer".

As the chart below illustrates, two multi-day episodes of wind chill below +10°F have occurred in the past few days, and early yesterday morning the wind chill dropped below 0°F for a few hours.  This is the first time a sub-zero wind chill has been measured at the site in the summer months; previously the latest was on May 19, 2013, and the earliest was on September 9, 2012.  (However, there are only 5 complete June's in the station's history since 2012, because the anemometer had been disabled by winter winds and was not yet repaired in June 2015, 2018, and 2020).


An interesting difference from the winter wind chill setup is that the cold air blowing through Howard Pass this week is not being drawn from a locally reinforced cold pool on the North Slope.  In the cold season the extreme wind chill occurs when severe cold develops across the interior North Slope under a surface-based inversion, and then a strong pressure gradient forces that cold air up and over the shallow pass.  But in this case it's just an early summer Arctic air mass; there's no serious radiative cooling at the surface in the continuous daylight of Arctic summer.

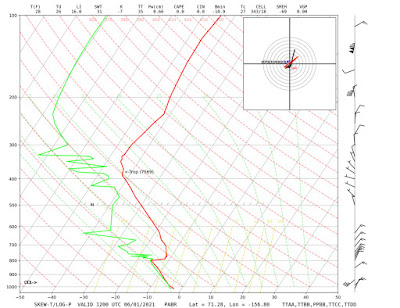
To document the nature of the air mass, here are the surface observations at 5am yesterday, and the 3am Utqiaġvik sounding (click to enlarge).