Wednesday, December 27, 2023

Cold At Last

Cold air aloft and clear skies allowed temperatures to drop to the coldest of the season so far across much of western Alaska in the past couple of days, and -40° was breached for the first time at a measuring location in the state.  This is much later than usual.  Several sites dropped below -35°F earlier in the month, including -39°F at the Ruby 44 ESE co-op site, but yesterday's cold was more significant.  Here are some 24-hour low temperatures ending at midnight last night.


The coldest reported (not on the map) was -49°F at the Kaiyuh RAWS near Kaltag.  McGrath reached -45°F, the coldest since the pre-Christmas cold spell of last year.

But more unusually, Bethel reached -30°F, the coldest since February 2017.

In other news, Anchorage snowfall continues to track at record levels, with 79" so far this season.  This is above the normal total for the entire winter.

On a different note, while fiddling with climate data over the break, I took a look at the relationship between temperatures aloft and temperatures at the surface in the depths of winter, for all the major balloon sounding sites in Alaska.  For temperatures "aloft" I used the 850mb pressure level, which averages about 4000-4500 feet above sea level at this time of year.

There's a robust positive correlation, of course, between 850mb and surface temperatures at all locations, but it does vary quite a bit across the state.  The site with the highest correlation of average December-January temperatures is Nome:


The lowest correlation is at Utqiaġvik, but this is at least partly because of the differing trends at the surface and aloft: surface temperatures have warmed more rapidly because of sea ice loss.


In general we expect lower correlations for more interior locations that have strong and near-permanent surface-based temperature inversions at this time of year, and higher correlations at maritime sites where inversions are less common.  This is broadly what we find:


The highly maritime climates of Kodiak, Cold Bay, and St Paul Island are at the top right, with Annette Island also quite similar.  On the far left, with strong inversions, are Fairbanks and McGrath, and these sites have a weaker relationship between surface and 850mb temperatures.  Anchorage is right in the middle.

The only one that surprises me is Yakutat, with a weak correlation despite a rather maritime climate and positive lapse rate (i.e. no temperature inversion on average).  More investigation would be needed to illustrate why this is the case.

Wednesday, December 20, 2023

AI Forecast Follow-Up

Last month I penned a few comments on the big news in the weather industry: the emergence of AI models as a legitimate competitor to traditional physics-based models for weather forecasting.

To provide a more concrete example of the impressive performance of the new models, I pulled out forecasts for Fairbanks from two of the AI models that I've been running over the past couple of months.  Note how remarkable this is: the models can be run on pretty modest hardware; you don't need a supercomputer.

Here's a basic comparison of forecast skill for days 1-14 of the 2m temperature forecasts for Fairbanks (click to enlarge).  Here I'm using ERA5 reanalysis data as "ground truth".


The two AI models are GraphCast (Google) and FourCastNet (NVIDIA), and I'm running FourCastNet with 50 members based on the initial conditions in the ECMWF ensemble forecast.  GraphCast is more computationally demanding, so I only have a single member each day.  The usual (traditional) ECMWF and GEFS ensembles have 51 and 31 members respectively.

Remarkably, GraphCast's single forecast member equals the ECMWF ensemble skill out to 9 days.  The ECMWF ensemble is the gold standard for medium-range forecasting, so this is a terrific result that confirms the power of the new models.  In contrast, FourCastNet starts out strong but roughly equals GEFS after 5 days, with inferior skill.  Note that systematic bias could affect these results to some extent, as I used the ERA5 seasonal normal as the baseline, without any bias correction.

Looking at the mid-atmosphere 500mb height forecasts, it's interesting to note that GraphCast drops off significantly after 10 days, while FourCastNet shows a very strong performance.  This may be reflecting the benefit of an ensemble approach for the medium-range (7-14 day) forecast.


More results will be forthcoming when I have time.  In the meantime, here's the latest forecast I have access to: the message is "warmer than normal" in Fairbanks, and perhaps especially around Christmas Eve and New Year's Eve.


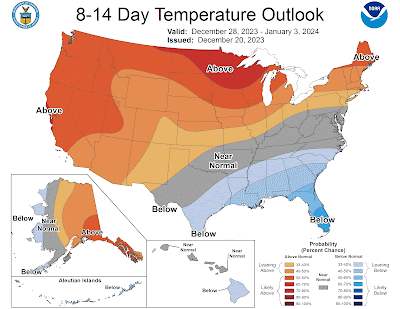
The CPC's 8-14 day forecast also calls for warmth for central and eastern Alaska around the New Year period.  It's a very typical El Niño pattern nationwide.


Thursday, December 14, 2023

Stormy Weather

The last few days have brought wild weather to large parts of Alaska, courtesy of a very powerful upper-level trough and associated low pressure system over the northern Gulf Coast.  Anchorage received measurable snow for 7 days in a row, with a total of almost 20", and that's enough to put them in first place for season-to-date snowfall at this point in the year.

Not surprisingly, the surface pressure analysis on Tuesday afternoon looked very similar to that from about a month ago, when Anchorage received its really big snow storm: the low center was a hundred miles or so to the southeast of the city.


Compare to the November 9 map posted here:

https://ak-wx.blogspot.com/2023/11/south-coast-snowstorm.html

The 500mb map from the same time on (this) Tuesday afternoon shows the mid-atmosphere trough in all its glory:


The eastward "tilt" of the trough at lower latitude is characteristic of particularly strong storm systems with a lot of upper-level "energy".  The sub-500 dm height at Anchorage (499dm to be precise) is notably low: about a third of winters in recent decades haven't seen a 500mb height that low all winter.

Here's an estimate of 3-day total liquid-equivalent precipitation, and the second map below indicates the estimated return frequency: over 5 years in parts of the higher terrain from the northern Panhandle up towards the Alaska Range.


The Fairbanks area received a significant snowfall, with a surprisingly large precipitation total of 0.54" (liquid equivalent) in the last 2 days (Tuesday and Wednesday).  I say "surprisingly" because temperatures were fairly low, only peaking at 10°F and 7°F on the two days respectively, and the snow:water ratio was an unusually low 11:1.  About 50% of winters in Fairbanks don't see a single 2-day precipitation event as large as this - although it has become more common in recent years.

Finally, the big pressure gradients associated with the broader circulation anomaly also generated big winds, especially for the West Coast, where the winds were northerly and created blizzard conditions.  Here are peak wind gusts (mph) for Monday and Tuesday.


Sadly the weather appears to have been a contributing factor in the deaths of two Nome residents on Sunday night:

https://www.adn.com/alaska-news/rural-alaska/2023/12/13/missing-nome-snowmachiners-found-dead-troopers-say/


Friday, December 8, 2023

Warm November and El Niño

With climate data now available for November, it's time to review the obvious: it was a very warm month for most of Alaska compared to long-term normals, and it was especially mild in northern Alaska.  Statewide, the average temperature was the 4th highest on record, trailing 2002 (the warmest), 1979, and 1952.


According to the NCEI climate division data, the North Slope saw its 2nd warmest November since 1925, with only 1979 having been slightly warmer.

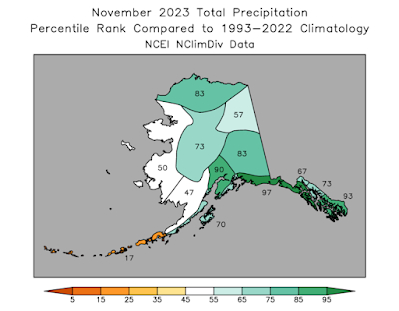
Model-estimated and (sparsely-observed) grouth-truth measurements of precipitation are broadly in agreement that the month was generally wetter than normal except near the West Coast and in southwestern Alaska.  Anchorage saw an amazing snow onslaught in the middle of the month that led to a new record for November snowfall (39.3") and liquid-equivalent precipitation (3.44").


Rick Thoman's post over at Substack provides much more detail:


Perhaps surprisingly, the monthly mean mid-atmosphere pressure pattern doesn't show particularly amplified anomalies; we might have expected a stronger Bering Sea trough and western Canada ridge, for example, to have produced such pronounced warmth.


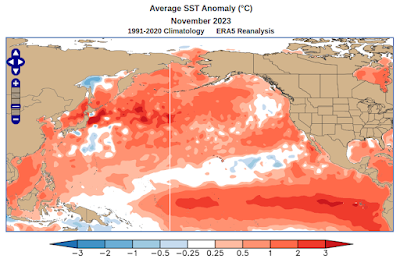
However, the weak ridge over British Columbia and the trough over far eastern Russia did create more southwesterly flow than normal, and there is very widespread unusual warmth in the surface waters of the North Pacific (see below).  Given this kind of ocean warmth, the odds are stacked heavily in favor of warm weather in downstream locations.


It's interesting to look at what happened in past winters that had a very mild November in Alaska.  Here's the December-February temperature analysis for the top 8 such years since 1950:


The big warm patch in the central tropical Pacific signals the presence of El Niño, which lines up with current conditions: we are currently in a robust El Niño - see the large and pronounced equatorial warm tongue in the November SST map above.  A warm November is more often than not followed by a warmer than average winter in interior and eastern Alaska, which is also consistent with the typical El Niño outcome.  The small sample of warm Novembers also suggests that below-normal temperatures may be slightly favored for Alaska's West Coast, but I wouldn't take that seriously with so much warmth in the North Pacific and Bering Sea this year.

Here's the average 500mb height (pressure) anomaly in the 8 years with very warm Novembers.  This indicates a trough with low pressure near southwestern Alaska, a very typical setup for El Niño.


In light of this, today's forecast for the days leading up to Christmas is absolutely classic: the GEFS ensemble mean shows a powerful trough over the Aleutians and a very intense North Pacific jet stream - see below.  It's rare to see ensemble-mean signals this strong nearly two weeks ahead of time, and as long as El Niño has this kind of grip on the pattern, it will be tough to get sustained or significant cold in Alaska.


Saturday, December 2, 2023

Hythergraphs

A couple of days ago, Amanda Young of UAF's Toolik Field Station posted a link to a new tool for visualizing climate data since 1988 at Toolik:

The temperature data is incomplete prior to 1994, and unfortunately precipitation coverage is rather poor until the last few years, but nevertheless the presentation is worthwhile.  It's interesting to note that 2021 was the coldest year since 1999 at Toolik; this is a more significant cold anomaly than I had realized.  Both NOAA/NCEI and ERA5 indicate that 2021's average temperature fell at approximately the 25th percentile compared to the 1991-2020 climate on the north side of the Brooks Range, i.e. not as cold relative to "normal".


The Toolik website also presents hythergraph climate summaries.  This is a visual presentation that I hadn't come across before, although it seems it's been around for more than a century.  I decided to try my hand at the hythergraph, so here's one to illustrate the statewide monthly climate averages, per NOAA/NCEI data:


The chart has several attractive features.  It nicely summarizes the similarity or contrast between different months, with the "vector difference" on the chart showing the difference in this two-dimensional temperature/precipitation phase space.  For example, November is a lot more similar to December than it is to October, on a statewide basis.  The hythergraph also provides a nice synthesis of the combined annual cycles in temperature and precipitation, with the second half of the year being much wetter.

The comparison between the 1951-2010 and 2011-2022 trajectories also provides a useful quick look at how the last 12 years have compared to the earlier climate.  The striking difference has been the increased precipitation in August and September.  It's also notable that winters have been warmer recently.

A possible improvement on the diagram would be to include the typical year-to-year variability in each month, perhaps as a background shading.  This would reveal how significant the recent changes are compared to natural variability.

[Update December 4: Chris Swingley experimented with this idea, see his blog post here: https://swingley.dev/blog/p/2022/]

Here's one for Fairbanks:


The interesting shape is driven by the heavy concentration of precipitation in the warm season, skewing the top of the diagram to the right.  June through September have been notably wet in the last decade or so, but so have all of the cold season months except (presumably by chance) January.

Finally, Utqiaġvik, where the climate has changed so dramatically in the last 20 years or so.


The differences in September, October, and November are very striking; notice that October and November have become as wet as September and October used to be, respectively.  The much warmer and wetter climate of autumn and early winter is a response to much reduced sea ice, with open water providing not only a warming influence but also a lot of extra moisture.  In fact, every month of the year has been both warmer and wetter in the last 20 years.

I'm sure readers will observe other interesting aspects of this visualization; feel free to leave a comment.

Monday, November 27, 2023

AI Weather Forecasts

I'm sure many readers have come across recent headlines about new breakthroughs in Artificial Intelligence for weather forecasting; here's one example:

https://arstechnica.com/science/2023/11/ai-outperforms-conventional-weather-forecasting-for-the-first-time-google-study/

It's not always easy to distinguish between hype and reality when it comes to claims of new technological advances.  Is the enthusiasm justified in this case?  Are weather forecasts about to see a revolutionary step forward in accuracy?  I'll offer a few words of my own perspective, as someone in the "weather business".

First, there's no doubt that AI and Machine Learning (closely related concepts) have made amazing strides for weather prediction in the past few years.  In early 2021, ECMWF (the world's leading "traditional" weather forecasting organization) published a "road map" for the future of AI weather forecasts, anticipating a rather gradual pace of innovation and change; but it turned out that several leading technology companies achieved remarkable success in just the next 2 years.  Crucially, the latest AI models were suddenly revealed as being able to match or even beat the ECMWF's forecast accuracy according to some metrics.  ECMWF wrote about it here:


The headline result - exceeding the ECMWF's basic skill level - is a big deal.  It means these new models are legitimate competitors, and it's truly remarkable that the AI scientists have achieved this so quickly, with relatively early-stage, experimental models.  In contrast, the accuracy of traditional forecast models has developed steadily but very slowly over the years, relying on bigger and faster computers, more satellite data, and incrementally better physics in the models.  Modern weather forecast accuracy is a great scientific accomplishment; but now without warning it is being equaled (by some metrics) with an immature technology that presumably has a lot of room to improve.

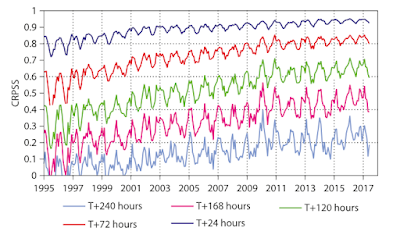
Here's an example figure from ECMWF showing gradual improvement of skill for predicting Northern Hemisphere 500mb height at various lead times.  After all this work, the idea that an upstart new technology can suddenly jump in with similar or better skill is quite surprising and perhaps difficult to swallow!


But notice that I alluded to specific metrics that show the new models in a favorable light, and this is because the first generation of AI models has significant limitations.  For example, it seems the models don't do particularly well with extreme events, because they are guided by (constrained by) the historical data rather than the laws of physics.  It seems to me that models trained purely on historical data will always struggle in this way, but hybrid statistical-dynamical models are an obvious extension that would be more likely to handle unprecedented events.

Another area where the new models aren't yet fully capable is in terms of handling uncertainty.  Forecast centers like ECMWF have become adept at running traditional models in a way that encapsulates and predicts uncertainty, and this is extremely important for valuable real-world forecasting: we need to know the plausible range of possible outcomes.  In contrast, the first-generation AI models just give a single answer to the question: "given today's weather, what will the weather be N days from now?"

It's also worth noting that - at least for now - the new AI models rely on the traditional models to provide the initial conditions for the forecast, i.e. to specify what "today's weather" is in great detail around the globe.  This "initialization" process is itself a tremendous scientific achievement, requiring a very advanced model to "assimilate" data from the entire observing system and create a single best guess of what's happening at every location.

What Difference Does It Make?

It's worth asking what practical difference there will be for weather forecasts created with AI models rather than traditional models.  This is of course difficult to foresee, but I suggest the answer is "not much" until the mainstream weather industry fully comes to grip with the new technology and builds it into the forecasting process.  The AI models have been developed by big technology companies (e.g. Google and NVIDIA) that are not (yet) in the business of selling forecasts, and the vast majority of meteorologists and meteorological scientists work elsewhere in government, academia, and traditional private sector weather companies.  These two "worlds" will need to come together if the new technology is to be deployed widely, and the process won't be quick or painless.

In terms of specific predictions, I can see two things happening.  First, the big-tech AI models will be licensed to private weather companies who find value in the AI forecasts and can build products for customers.  The leading forecast centers like ECMWF will also build their own AI models and provide the results to users, and so the industry will gradually adapt to the new source of information; but the traditional methods certainly won't be ditched any time soon.

Second, I think the AI methods will be used to develop much better forecasts for some specific high-impact problems that are not handled well by traditional models.  An example might be fire weather forecasts: for example, an AI model trained on past weather-driven fire events could provide powerful guidance for future risk.  The deadly fires in Hawaii and California in recent years might have been much better predicted with a specific application of the new technology, allowing aggressive early evacuations in those rare and dangerous weather situations.

I'd be glad to hear comments and insights from readers.  What else do AI methods have to offer that physics-driven "deterministic" models can't provide?  What other forecast problems are poorly handled by today's usual weather guidance and might be particularly amenable to historical/statistical methods like AI?

Tuesday, November 21, 2023

Wild Weather in the South

Weather is never very far from the news in a place as big as Alaska, and the more extreme events aren't usually good news.  Yesterday a major Gulf of Alaska storm barreled into a cold air mass and high pressure over southern Alaska, and the results were dramatic: damaging winds in the Matanuska Valley, and a major landslide down south in Wrangell.  Sadly the landslide brought loss of life, and perhaps worse than the 2020 Haines landslide.

ADN news links:

https://www.adn.com/alaska-news/mat-su/2023/11/21/most-power-restored-and-roads-cleared-following-mat-su-windstorm/

https://www.adn.com/alaska-news/2023/11/21/large-landslide-south-of-wrangell-closes-highway-draws-search-and-rescue-team/

The rain in the Southeast doesn't appear to have been particularly unusual for the region; the map below shows 72-hour totals (click to enlarge).  But it was pretty wet earlier in the autumn, so there may have been a compounding risk.  Sitka is in the top 10 for rainfall since September 1.


As for the winds around Palmer and Wasilla, the map below shows how localized the wind storm was in the greater Anchorage area (showing yesterday's peak gusts in mph).


This looks like a great example of channeled downsloping flow from the east, driven by a strong pressure gradient.  The map below shows the sea-level pressure analysis at 3pm yesterday, courtesy of Environment Canada.  Check out that pressure gradient over the southeastern coast of Alaska; high winds were seen throughout the region.


Thursday, November 16, 2023

A Few Notes

A few comments on various topics.  First, the snow onslaught in Anchorage: the recent 10-day total of 38" amounts to the 3rd highest on record.  Last year's December snow was even a bit greater, and the top event was back in February 1996.


It's really remarkable to see such a large amount of snow at the airport - where there is typically less snow than across most of the area - and in back-to-back years.  With La Niña last winter and El Niño this winter, we can't pin the blame on similar climate forcing, so perhaps it's just "luck of the draw".

Second, the Tanana River at Nenana froze up last week on Wednesday the 8th.  The scene is suitably wintry today:


But the mighty Yukon River hasn't frozen over at Dawson yet; here's the latest video from the webcam:


The situation at Dawson looks about the same as last year at this time:

https://ak-wx.blogspot.com/2022/11/historical-context-for-warmth-freeze-up.html

Long-time readers will recall discussion of the lack of a proper freeze-up all winter long at Dawson in some recent years:

https://ak-wx.blogspot.com/2020/02/yukon-frozen-at-dawson.html

This autumn has certainly been on the warm side of normal in Dawson, but it's not breaking records for lack of freezing potential: here's a chart of accumulated freezing degree days (accumulated temperature differential below 32°F):


This is from the reliably-reporting "LRP" site in Dawson, not the airport, where many observations are missing.  The city does have a much longer history of climate observations, of course, but it seems there are some discrepancies between the different climate sites that would affect any long-term trend analysis.

And finally, I'll highlight the remarkable lack of sea ice along Alaska's west coast at this time, related to persistent southerly winds and warmth.  Rick Thoman posted a graphic to illustrate:

"Sea ice concentration analysis for Wednesday and the same date last year from the National Weather Service Alaska Region Sea Ice Program. Much less ice in the southern Chukchi and Bering Seas currently than this date last year. November 15 and effectively no ice in Kotzebue Sound is especially shocking, even by recent norms."

https://mastodon.social/@AlaskaWx@alaskan.social/111417939896937766


Here's a longer archive of November 15 analyses, from 2021 (top) to 2018 (bottom):


Friday, November 10, 2023

South Coast Snowstorm

Yesterday a number of 747 cargo planes were spotted at Fairbanks airport, and that usually means only one thing: Anchorage is having a big snow event.  And indeed they were: 2-day snowfall amounts ranged from 17" at the airport to 30" on the Anchorage Hillside and over 36" up Turnagain Arm.  Here's a graphic courtesy of NWS Anchorage, showing storm totals as of this morning:


With substantial snow earlier in the week as well as more today, the weekly total is really something: Brian Brettschneider indicates that the airport's 6-day total of over 28" is the third highest on record in the Anchorage climate history.  The only larger snow events in that time frame over the last century or so were in February 1996 and December 1955.  Quite a way to start off the winter!

The snow depth of 21" yesterday afternoon is easily the greatest for this early in the season in Anchorage.

Of course, far more snow fell in topographically favored locations.  Courtesy of NWS Anchorage (and publicized by Brian), here's an astonishing report from the Richardson Highway:


The liquid-equivalent precipitation estimates from the NWS are wild too, with over 10" estimated in the high terrain on Wednesday, and another few inches yesterday.


Here's a satellite loop showing the powerful cyclone and associated "atmospheric river" that brought such prodigious moisture to the south coast.


Yesterday morning's 3am surface analysis shows the 964mb low tracking directly into the Kenai Peninsula and Anchorage area.  Winds gusted as high as 60mph in Yakutat.


And here's a nice loop of the Anchorage-area radar reflectivity, courtesy of Randy Chase on Twitter:


Tuesday, November 7, 2023

October Climate Data

Rick Thoman has a nice write-up of October's Arctic and Alaska climate anomalies here:

https://alaskaclimate.substack.com/p/october-2023-climate-summary

The precipitation contrasts across Alaska were striking: it was much drier than normal for the time of year in the southwest and south-central, but the North Slope and eastern Alaska were notably damp.  Rick notes that the Utqiaġvik CRN site measured 1.68" of liquid-equivalent for the month - the highest on record there for October (at either the CRN site or the much longer Barrow/Utqiaġvik climate site).  It's also the fourth consecutive month with more than an inch of precipitation at the CRN location.


Snowfall was also relatively abundant in eastern Alaska: as high as 19" in Tok and 17" in Eagle.  Also 18" on Keystone Ridge outside of Fairbanks.

Here's a look at snow water on the ground at 5-day intervals through the month, expressed in terms of historical percentile, and estimated by the ERA5 model:


The snowpack was established on October 6 in Fairbanks (considerably earlier than normal), but very little snow remained by the end of the month in the southwestern quadrant of the state.  The last week of the month was very mild, but chilly weather earlier in the month allowed for a near-normal monthly average temperature for much of the interior.  The Aleutians, North Slope, and Southeast were notably warmer than normal, however.


As for wind, October was relatively calm for the southwest and south-central, but windier than normal in the north and northeast.


Here's the mid-atmosphere pressure pattern that contributed to the surface climate anomalies: the ridge over southwestern Alaska explains the dry and calm weather there.


Sea surface temperatures remain much higher than normal in the western Bering Sea and northwestern North Pacific, so we can expect that winds from that direction will tend to bring unusually mild conditions to Alaska in the coming months.


Given that we have a strong El Niño in play this winter, which tends to produce a strong Aleutian low and frequent southwesterly flow across Alaska, I'd say the chances of a very mild winter are much higher than normal.  NOAA's Climate Prediction Center agrees:


For a comprehensive discussion of the winter outlook, check out Rick Thoman's November 17 presentation here:

https://uaf-accap.org/event/nov-climate-outlook/